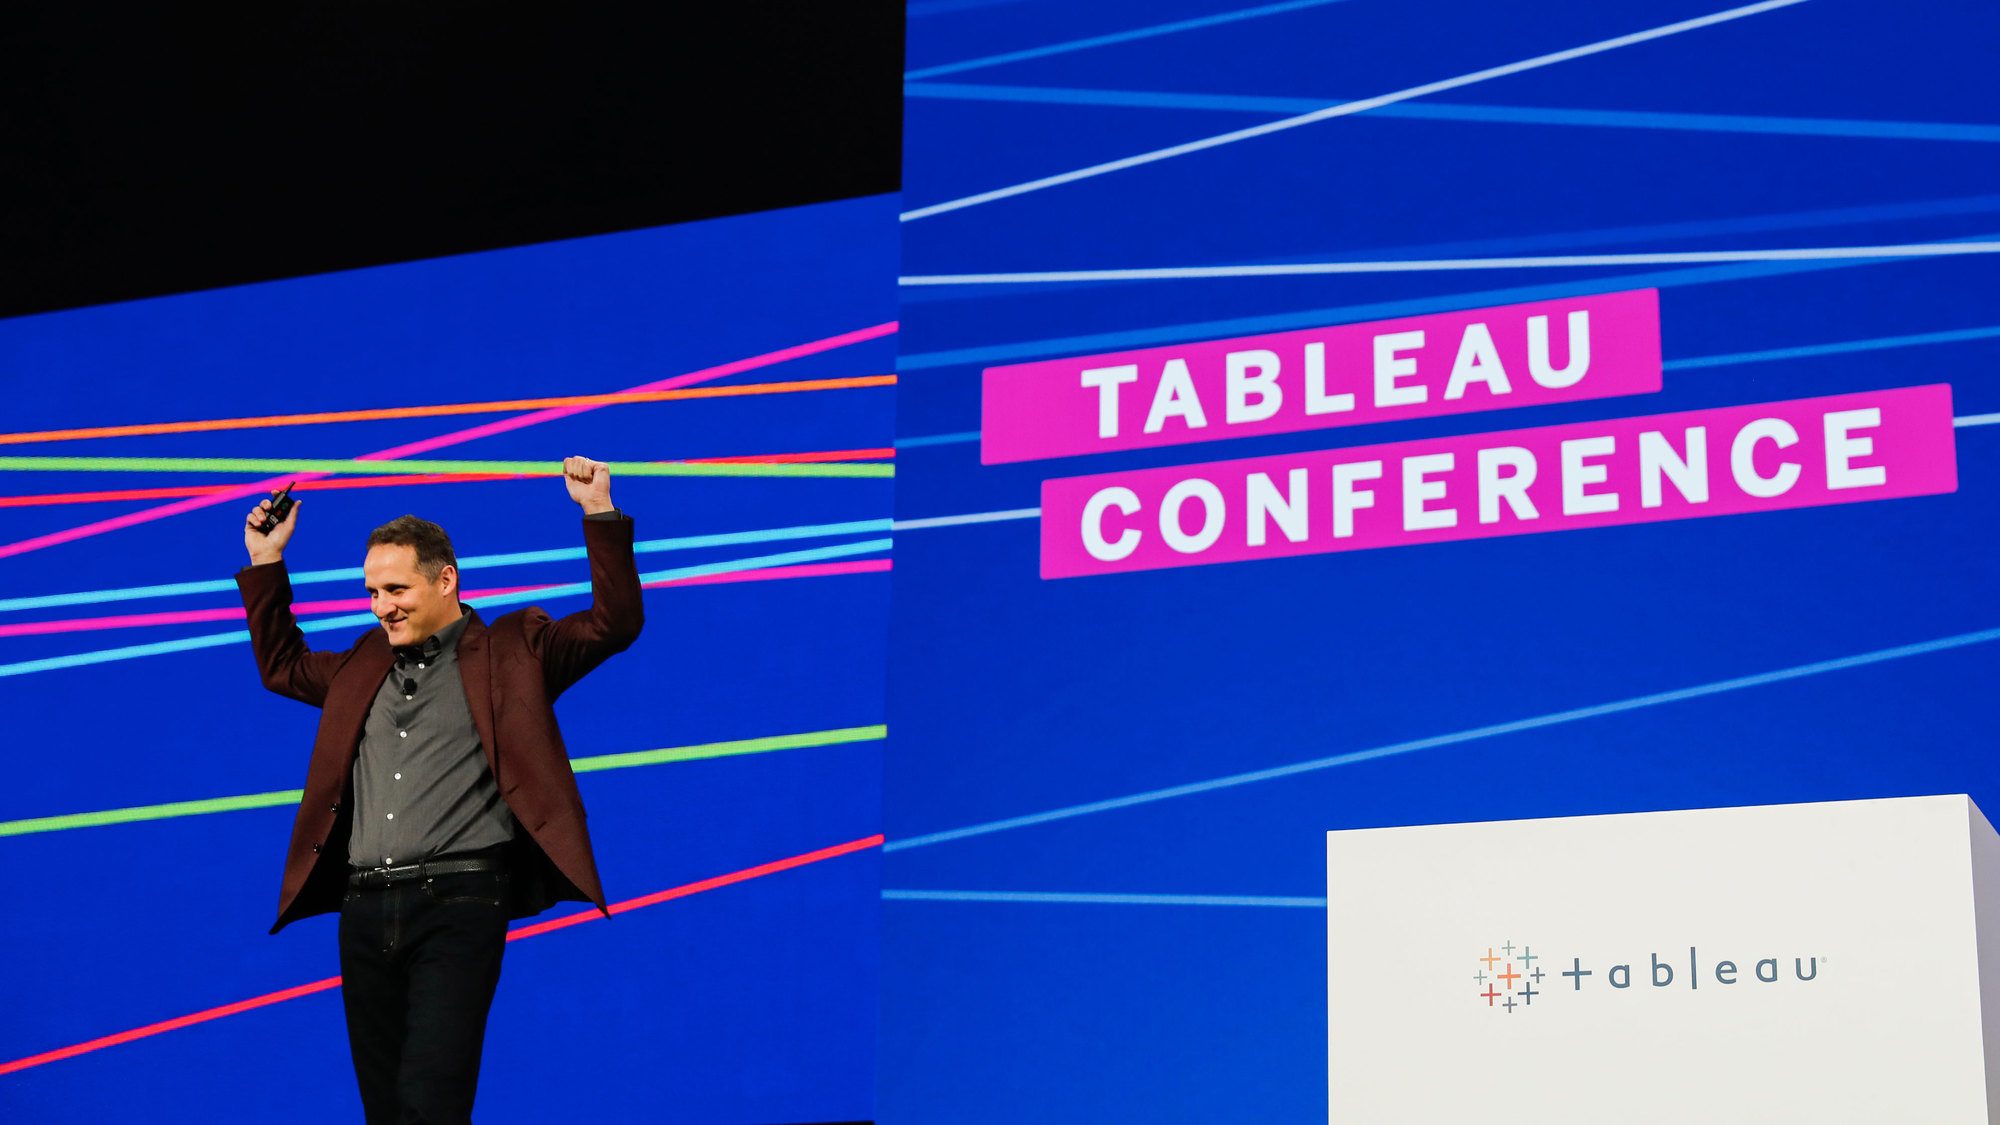
Kicking off our 11th Tableau Conference with 17,000 data rockstars


Today an incredible 17,000 data rockstars from the Tableau Community gathered in New Orleans for our biggest Tableau Conference yet—to talk data, sharpen skills, and experience firsthand the upcoming additions to the Tableau platform. This is all so we can put the power of data to work and create positive impact in the world—whether that’s to help you reduce reporting time, optimize equipment safety, or even save lives.
Innovation, impact, and analytics everywhere
The #TC18 opening keynote was all about the incredible impact that analytics can create when put into the hands of people making decisions. We heard from Debbie Reynolds, Vice President of Data and Analytic Innovation at Pfizer, about how collaborating with data means better patient identification and diagnosis, faster clinical trials and products to market, and improved health outcomes for society.
Another great example of analytics impact came to life through our partnership with PATH in the #VisualizeNoMalaria initiative, which has already helped drive a 90% reduction in malaria-related deaths in southern Zambia.
Our CEO, Adam Selipsky, doubled down on our commitment to help solve the biggest world challenges with data by pledging to grant $100 million in software, training, and financial support through Tableau Foundation between now and 2025. This includes an equity donation of $25 million early next year to fund the Foundation's work. Read more about the news in our press release.
Adam took us for a ride on the road to analytics ubiquity. He drew parallels from technology innovations like refrigeration—that went from ice cellars to electrical fridges in every home. This disruptive technology changed not only how we eat but where we live, and modernized entire industries. We experienced a similar transformation with the Internet—which most of the world completely misunderstood only 25 years ago. And now analytics is on the same path. With the broad use we are starting to see, worldwide impact becomes real.
"We, here in this room, we’re making it happen. This is the beginning of the era of analytics ubiquity, where we can create great impact."
Signs of impact are beginning to show all around us. Academia is growing its focus on data competencies while data-driven enterprises are disrupting entire industries. Data and analytics are driving national agendas in every corner of the globe. It’s possible now to see a future where everyone can access and analyze data to make decisions.
Rene Kim, Senior Vice President and Head of Global Data Office at Charles Schwab, shared her story of getting the right data to the right people at the right time, creating efficiency and transparency across the enterprise. Today, more than 30,000 employees at Schwab use Tableau to drive insights that improve their service to clients.
But ubiquity that drives huge impact doesn’t happen on its own. We need to fuel it with rapid innovation. And we here at Tableau are continuing to make Tableau the broadest, deepest, and easiest modern analytics platform to use, with the security, governance, and services you need to deploy and scale.
Next up, Chief Product Officer Francois Ajenstat and a handful of Tableau devs took to the stage to give a preview of upcoming innovations to make analytics accessible to everyone. Let’s take a look.
Conversational analytics with Ask Data
New technologies like natural language processing give us an opportunity to make it easier than ever to get answers from your data. This is why the crowd was so excited to see product manager Andrew Vigneault on stage showcasing the power of natural language processing coming to Tableau Server and Online in Tableau 2019.1 (now in beta) with Ask Data.
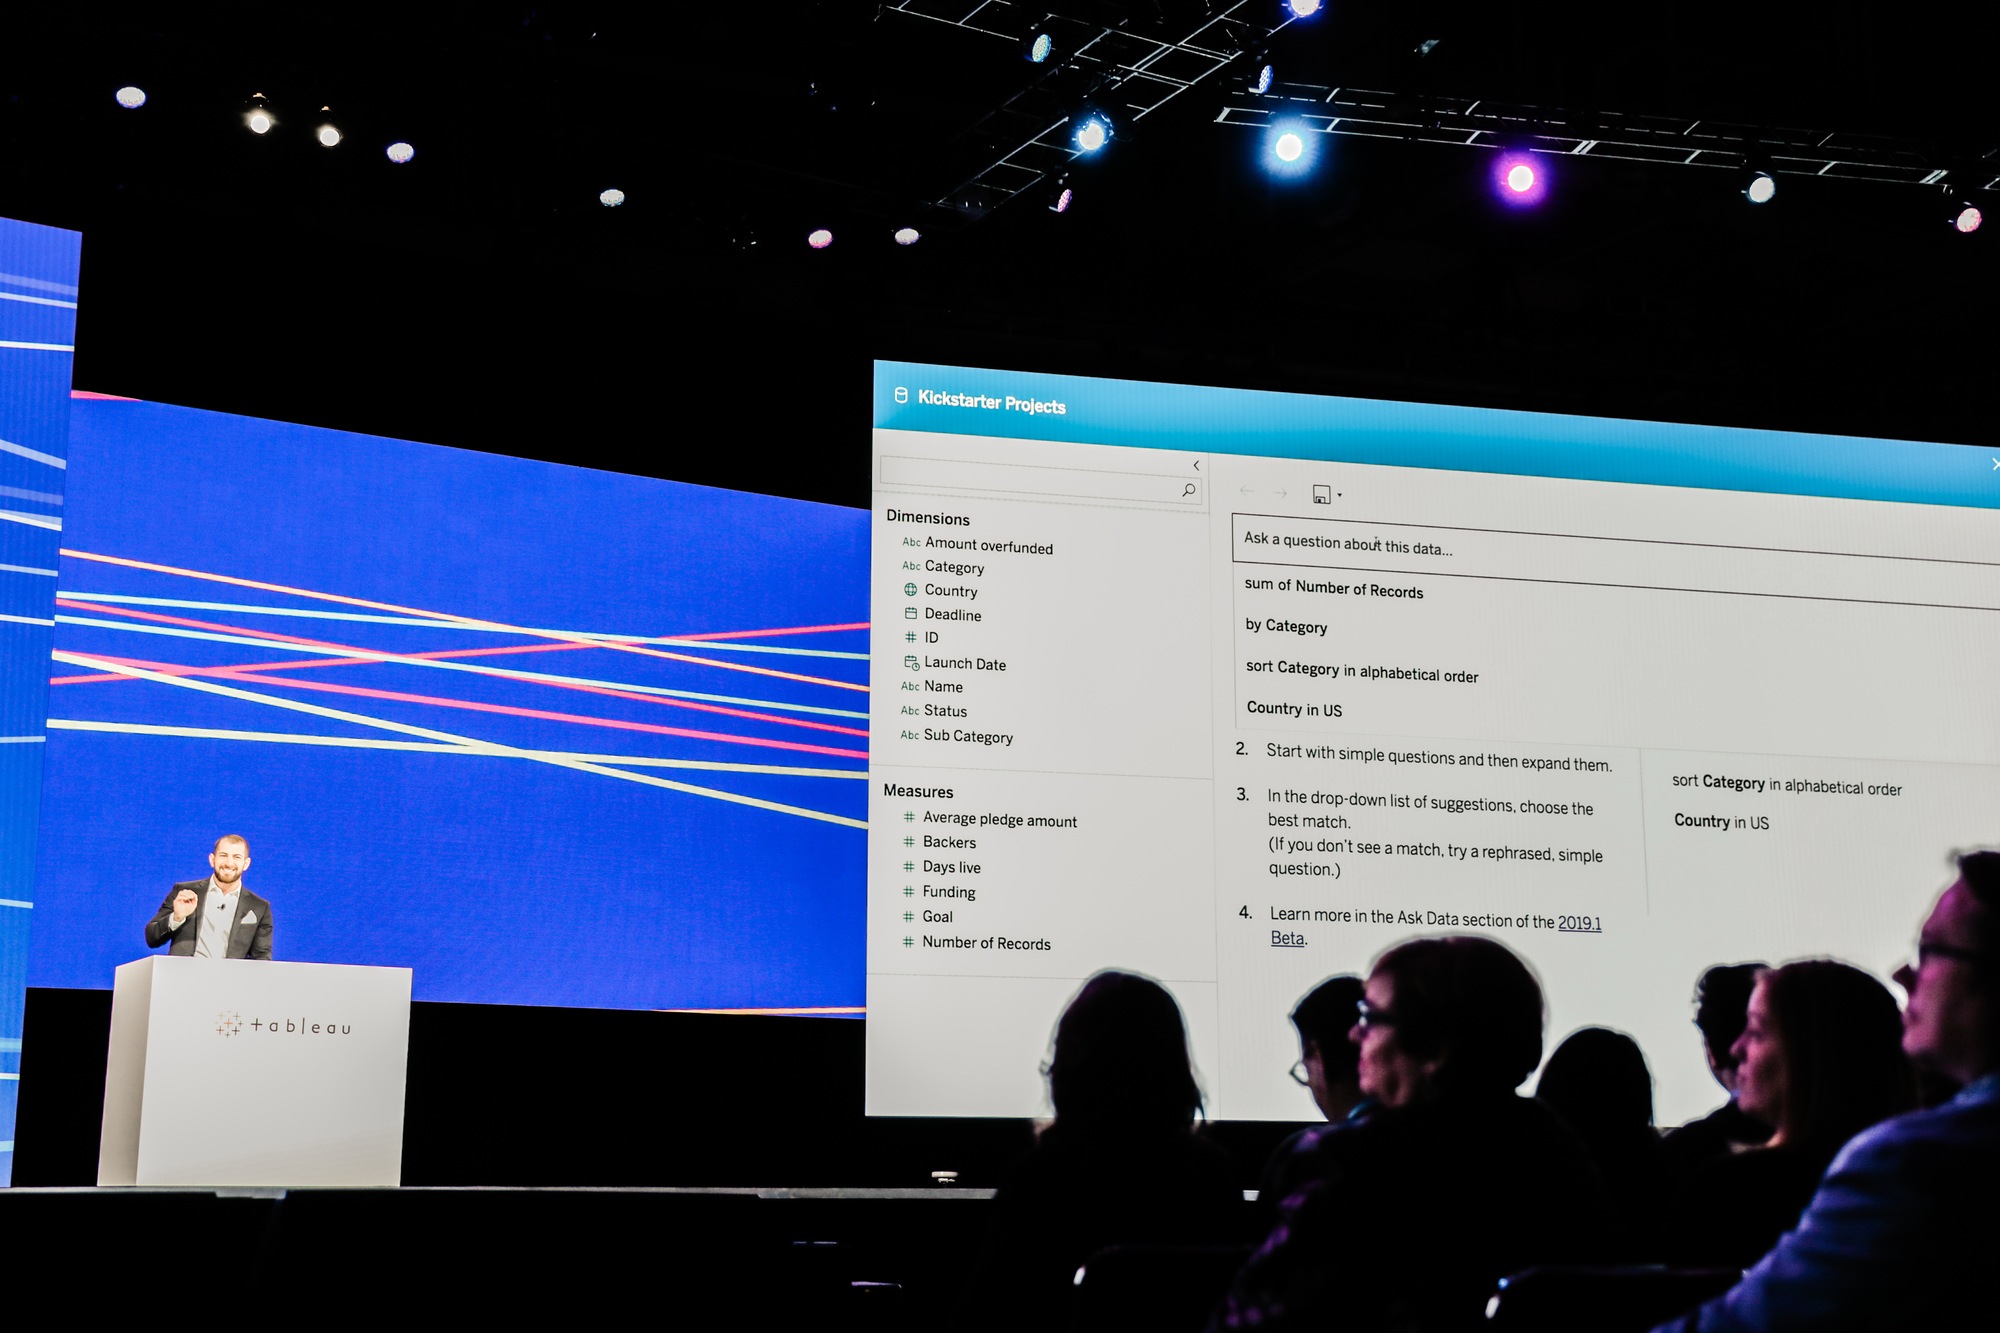
With Ask Tableau, you can simply type a question and Tableau creates a viz, automatically choosing the best chart type. You can easily refine your question and your viz will update—the context carries through. Andrew showed us how Ask Data handles complex calculations and correlations, and even applies intelligent sorting.
Best of all? No setup required—Ask Data is natively integrated and will work with all published data sources, live or extract. Ask Data will be available out of the box with our Tableau 2019.1 release for all Creators, Explorers, and customers with maintenance. Try it out today in the Tableau 2019.1 beta.
Centralize your Tableau Prep flows with Prep Conductor
Since we launched Tableau Prep last spring, we’ve had amazing feedback from the community driving our monthly updates, but one request always topped the wishlist: the ability to schedule and manage flows. So when Zaheera Valani, senior engineering manager, took the stage to announce our new product Tableau Prep Conductor, the room was almost as wild as Mardis Gras!
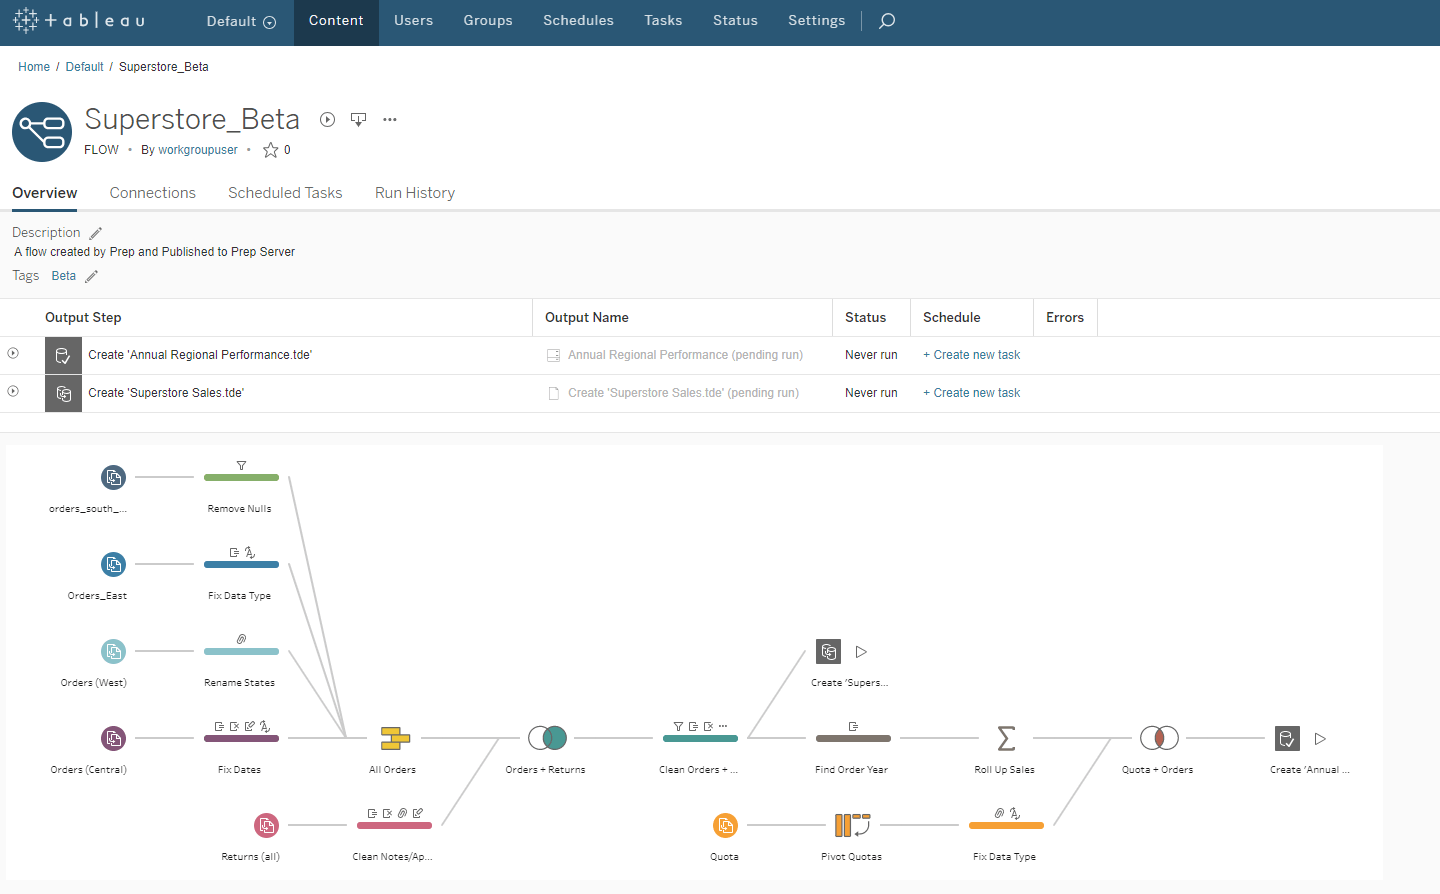
Tableau Prep Conductor brings scheduling, alerting, and management to your Tableau flows, so your organization always has fresh data. In the demo, Zaheera showed how you can publish a flow, set the refresh schedule, and see scheduling history. And because it’s fully integrated into Tableau Server and Online, you can leverage same authentications and permissions you’ve already put in place. Tableau Prep Conductor is part of our 2019.1 beta, available now.
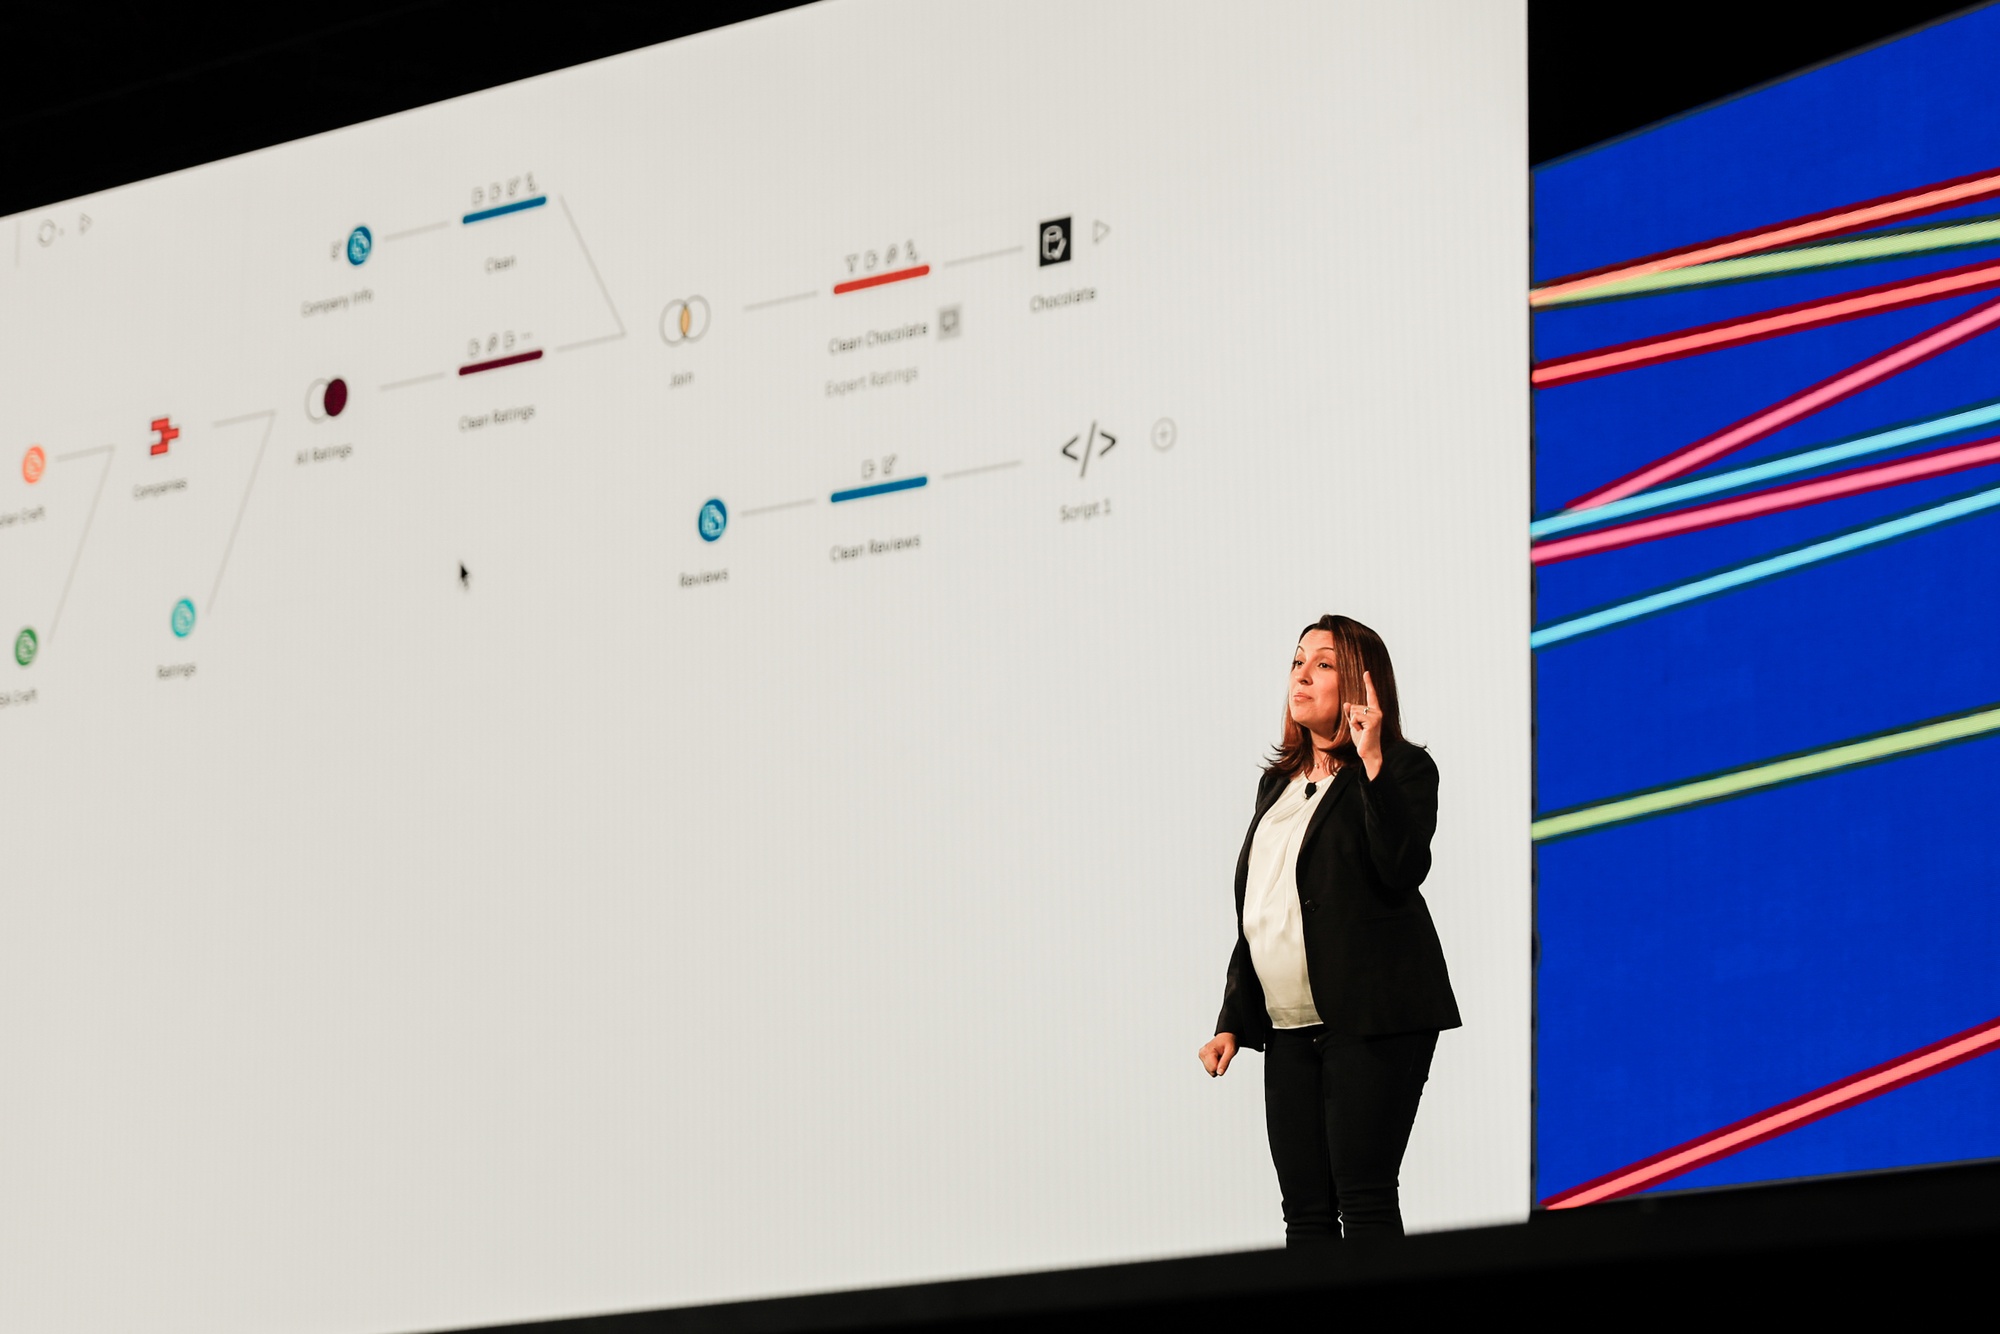
Tableau Prep Desktop is getting some powerful new capabilities too. Zaheera gave us a look at what else to expect in upcoming releases:
- R and Python — We’re adding support for R and Python scripts. Simply add a node that calls an external script, bringing you more transformation and enrichment capabilities to your flow—from statistical and sentiment analysis to predictive modeling.
- Data roles — Data roles help define the context of your data and automatically identify and fix errors. For example, in a column where the data role is “countries,” Tableau Prep knows to correct “Amsterdam” to “Netherlands.” And you can define your own custom data roles to represent your unique data, as Zaheera demonstrated with a field containing cocoa bean types. Tableau Prep uses machine learning to make smart recommendations for data roles and other ways to clean up your data, like grouping and replacing values.
- Highlighting the flow — Want to understand the lineage of your data through your prep flow? Tableau Prep will automatically highlight a column’s path from a table through the flow to help you understand exactly where and how the data has been transformed.
Making sophisticated analysis more intuitive with new data modeling capabilities
Tyler Doyle, a staff product manager from our data development team, gave us a preview of new data modeling capabilities coming to Tableau next year. Everyone—not just the data nerds—were excited to hear how enhanced data sources will help to more easily analyze complex data without having to learn advanced database concepts or write custom SQL code.

With new modeling capabilities, Tableau will automatically recognize data relationships stored in databases like Oracle and SQL Server, leveraging common data warehouse standards like star and snowflake schemas. This lets you automatically take advantage of the work your database administrators have done to build well structured data warehouses.
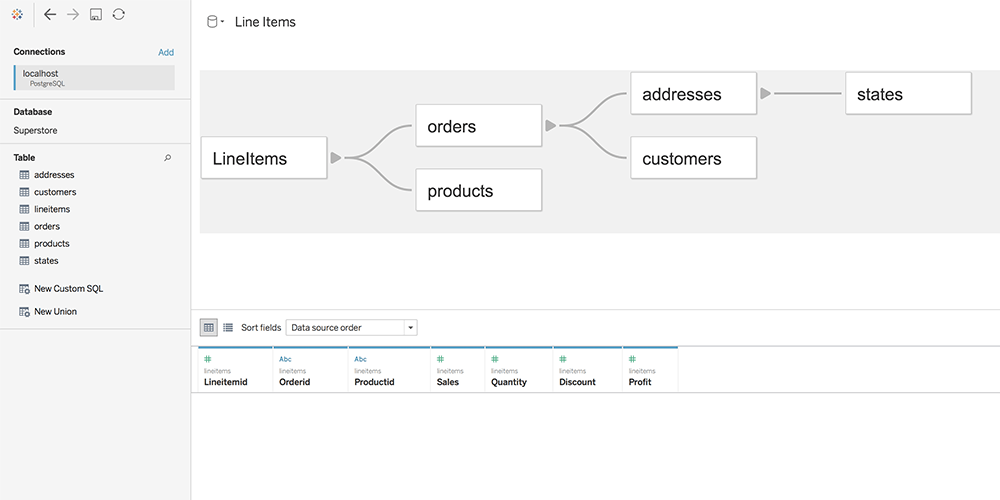
Tableau can handle multiple levels of detail in a single data source, making it easy for you to slice and dice complex data without writing specialized calcs to control aggregations like averages and totals. And since these enhanced data sources can answer a wider variety of questions, organizations will be able to consolidate the number of distinct data sources they create and maintain. You can learn more about the new data modeling capabilities here.
Introducing: Tableau Developers Program
We see more and more organizations using Tableau’s APIs to automate, integrate, and extend Tableau, enabling insights to become a seamless part of their organization’s workflows. To enable developers to be more successful, Francois announced the Tableau Developer Program—a free program open to anyone building on top of our Tableau platform.
Members will enjoy a free Tableau Online development sandbox, unique access to Tableau’s engineering team via sprint demo webinars, technical resources including documentation and sample code, and a community that can answer questions and provide support.
We can’t wait for you to join—sign up today!
Want more? Watch online!
There were so many more proud moments that got the TC18 crowd on their feet. And you don’t have to miss out on the action just because you couldn’t join us in New Orleans. Tune into Tableau Conference Live to catch the Devs on Stage keynote, Iron Viz competition, handpicked breakout sessions, plus live interviews and panels with Tableau experts and superstar guests. (You’ll just have to BYOB—bring your own beignets.)
And don’t forget to read up about all that’s new in the 2019.1 beta and join the pre-release program to give it a try!
相關文章

The Tableau+ Bundle with Premium AI, Enterprise Capabilities, and Premier Success
 2026/06/24

What is Tableau Prep?
 2026/04/30
Insights Wherever You Work: Meet the Tableau App for Microsoft 365
 2026/03/16