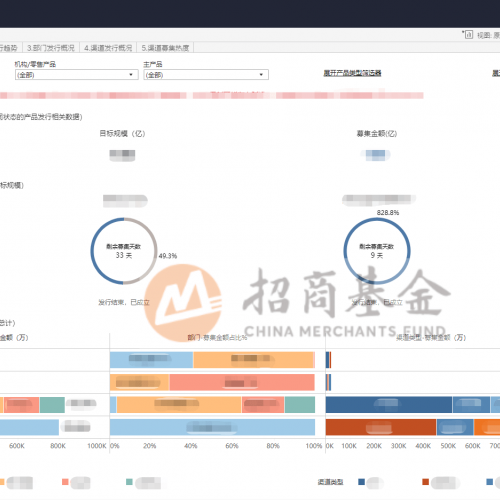
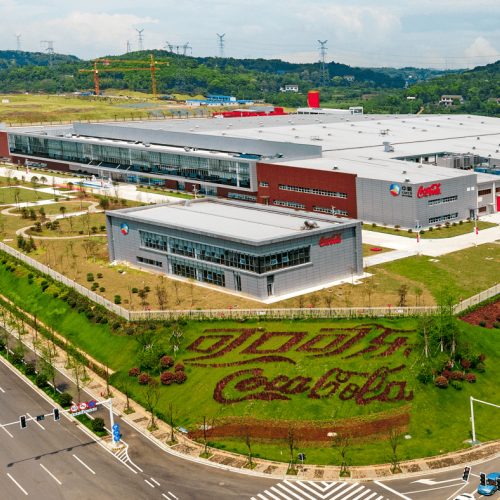
ModCloth: Retro fashions meet state-of-the-art data analysis


Online retailer ModCloth has built its retro home décor and clothing site into a thriving business, reporting more than $100 million in revenue in 2012. In this video, data analyst Krystal St. Julien discusses how “you can connect Tableau to almost anything”—turning data into insight that drives this rapidly-growing business. In video 2, Krystal talks about blending diverse data in Tableau.

Tableau: What led ModCloth to choose Tableau?

We really brought Tableau on because of the obvious ease of use and the quickness to which you can get to your answer. I don't think there are any limits on the data we've been able to deliver to our stakeholders.

Krystal St. Julien, Data Analyst: We really brought Tableau on because of the obvious ease of use and the quickness to which you can get to your answer.

I don't think there are any limits on the data we've been able to deliver to our stakeholders. It used to be every time you needed one bit of data, I'm going to submit a ticket to the analytics team, I'm going to wait however long it takes for the analysts to get to my request, and then if I need to iterate, I have to do the same thing over and over again.

And now you know, if it's a simple data pool, immediate results. If it's an ad-hoc question, again, immediate results.

Tableau: Where do you use Tableau?
Krystal: We use it everywhere. In our warehouse, we have questions around what's going on with our product, what's going on with shipments, who is ordering our product, are the people who are ordering actually people who say they are those people, or are they somebody fraudulent, how can we catch those things?

And recently, we've been getting a lot of project managers on the product team really interested in using Tableau as a reporting mechanism as well.

Tableau: How has Tableau changed your job?
Krystal: I now spend a lot of my time on predictive analytics doing more of the fun deep dive types of projects that I've always wanted to do rather than just reporting or dashboarding, because stakeholders can do that themselves.

Blending diverse data

Tableau: What kind of data do you have?
Krystal: The majority of the data we serve is from the analytics team data warehouse. We actually take data from across the company and source it into our own data warehouse, so it's a good, solid repository of information.

But we do also connect directly to other warehouses around the org. Our data warehouse is a Redshift data warehouse, but we also connect to PostgreSQL warehouses, MySQL warehouses, obviously sometimes people want to use their own spreadsheets, so Excel is a definite.

I also use direct connection to Google Analytics. So all over the place. And blending is definitely something that happens all the time.

Tableau: What does Tableau allow you to do with all that data?
Krystal: Since our data warehouse on our team is a central repository that takes in data from across the company, one of the things that's been really great is we can demo how we want to use certain pieces of data, how we might deploy certain pieces of data via Tableau before it's been sent to our data warehouse.

And this is great because we can send a full spec sheet of use cases, what we want our columns to look like. Basically, (what we want) our dimensions and measures to look like, what aggregations we're going to need, how our stakeholders use that information. Because we have been beta'ing it, basically, since you can connect Tableau to almost anything.

So that has helped a lot in efficiency of making sure that as the data comes into our central warehouse, it's done in the way that is most helpful to the analytics team, and then the company at large.

Tableau: Do you use Tableau on different devices and operating systems?
Krystal: We have a ton of super users on finance, and they are a Windows-mostly shop, and we are a Mac-mostly shop on the analytics team. We share workbooks all the time, no problem.

Tableau: Who are you mostly working with when it comes to Tableau?
Krystal: Our home tech office is San Francisco. And I would say those stakeholders probably get the most help from us just because of locale. People can run down to my desk and ask me questions at any moment.

In our LA office, it's all of our buyers, assortment planners, you know, how are people purchasing product? What are the historicals on that? How do we take that into account as far as planning for future purchases?

Yeah, and then in the San Francisco office, we have HR uses it to look at retention. We have, obviously, my team uses it for projects serving algorithms, experimentation and exploration, marketing uses it for a lot of reporting. There's a ton of year over year, week over week, month over month kind of trending and reporting we have to do.

Tableau: Was it easy to get started with Tableau?
Krystal: Basically, I came into my company and within a month was training people on Tableau. And I kept getting the question, "How long have you been here?" Oh, a month, you know, two months. It was just that easy to pick it up.

Tableau: How does Tableau save you work?
Krystal: I think in the last quarter, it was something like 200 requests that we would have had to fulfill got fulfilled direct by stakeholder by us serving Tableau to them.