Anyone Can Perform Exploratory Analysis with Tableau
Greatly reduce time spent on data extraction and hypothesis testing
Speed up the improvement cycle
Background to Implementation
Previously, Queries Were Entered Manually
Empowered by the mission to “make small businesses the focus of global business,” freee offers SaaS services like “Accounting freee” to enable anyone to be free to run their business however they like. They actively support the trend of improving small businesses by stimulating large enterprises, making society more interesting, and improving the world as a whole. To that end, they aim to provide service at a world-class level of quality, continually making improvements to the products themselves as well as their responses to customer inquiries. Tableau is used as the analytical platform that underlies all of this.
“At freee, we have been data-driven since our founding and also got into analytics at a very early stage,” said freee CIO Teppei Tosa. He says that many personnel are capable of actually writing lines of SQL. “However, the organization has grown so rapidly that I can no longer say that everyone can write SQL. In order to sustain a data-driven company culture, it was necessary to create an environment in which people who can write SQL and those who can’t are able to talk to each other on the same playing field.”
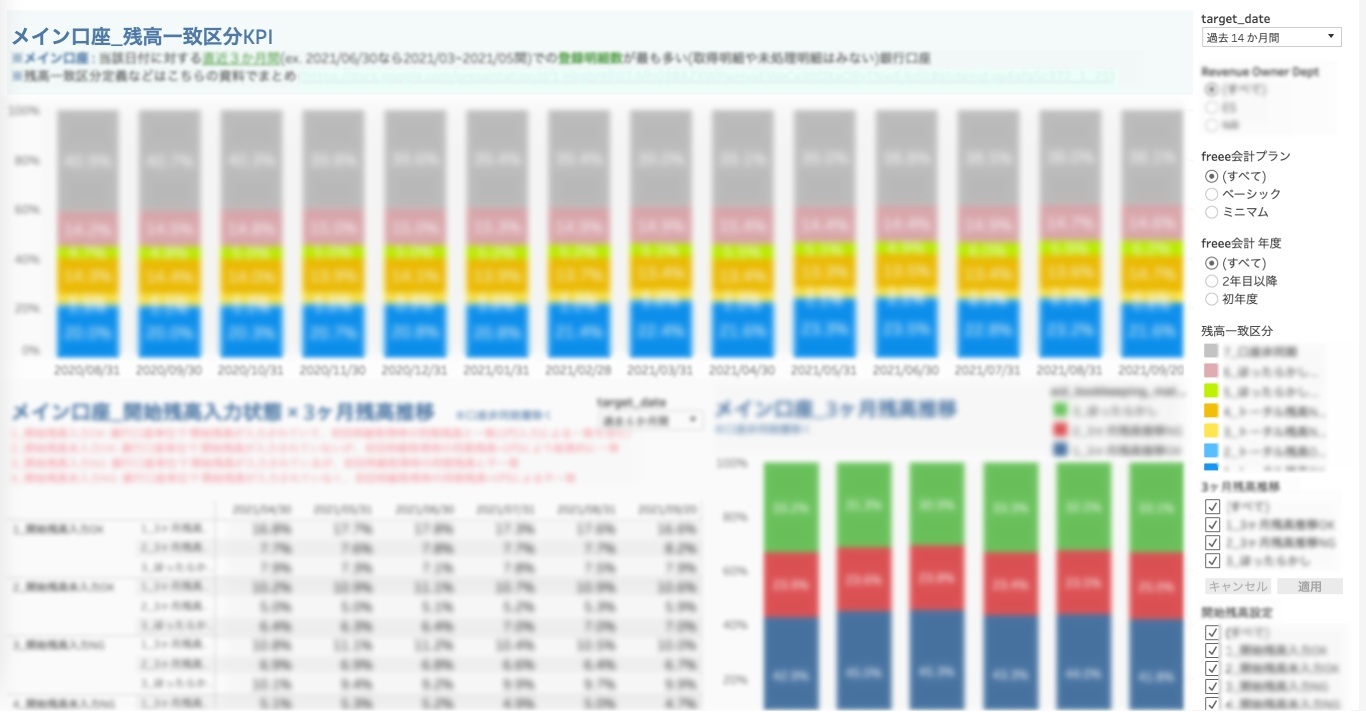
Regarding the time before Tableau was implemented, “We built a data warehouse with Amazon Redshift and extracted data using Redash,” said Analytics manager Yosuke Sekikawa. He explained that to produce data, people would write their own queries and visualize the results in Redash or in a spreadsheet. “However, this approach had limitations. Since visualization was labor-intensive, only one pattern of visualization was possible, and this made exploratory analysis difficult.”
Tableau Implementation and Operation
Tableau Implemented to Visualize ROI
To resolve these problems, freee began considering how to create a new analytical infrastructure. They would select an analytical tool that can be used with Google BigQuery, to which they would be extracting data.
“Since we knew we would be using Google, our first candidates were the BI products that Google had acquired,” said Sekikawa. However, they ultimately selected Tableau and submitted the proposal to adopt Tableau to the CIO (Tosa). Tosa approved of Tableau implementation immediately. He explained the reasons as follows: “I already knew of Tableau. I thought it was a good idea to implement something that would be easy to use on the front lines, and I felt that it sufficiently guaranteed security as well.”
The big prerequisite to approving of Tableau was ROI visualization. After using it for six months, they compiled a performance report to see what impact had been made.
The first team to use Tableau was the Support Team. This team was proactive about using Tableau from the very beginning, said Sekikawa. Next, they began performing analysis for the purpose of improving products. They also started visualizing product usage rates and churn rates. They implemented Objectives and Key Results (OKR) as a method of objective management. Further, they worked to quantify performance.
freee has a different design philosophy than conventional accounting systems, and I feel that Tableau takes a similar approach. We plan to continue actively utilizing Tableau moving forward, growing the company through data-driven decision-making.

Why Tableau?
Starting Small and Easy to Find Personnel
There are three major reasons why Tableau was selected over competing BI products.
First, as stated, Tableau is easy to use for users on the front lines. Since Tableau enables even those who can’t write SQL to conduct exploratory analysis, it eliminates disparities in technical skill. freee is a growth company, and it is expected to have much more analysis to do in the years ahead. It needs an analysis platform that is guaranteed to be able to handle that work. Since Tableau is easy to use, the quality of the analysis dashboard can be standardized to improve the precision of analysis performed.
Second, Tableau enables you to start small. “Before deploying throughout the company, we needed to measure our ROI. This required us to start small,” said Sekikawa. However, it was surprisingly difficult to start small with competing BI products. “By contrast, Tableau offered a price structure that makes it easy to start small.”
Third, many personnel can use Tableau effectively. “We had several people join the company even outside of Analytics who had experience using Tableau, so we felt we could expect to be able to promote its use even outside of specific teams. Moreover, there are lots of people throughout the world in general who can use Tableau, so we determined that we would be able to avoid situations such as data analysis becoming a job that only one person knows how to carry out.”
It’s no longer necessary for everything to hinge on the end user’s analytical tasks. It used to be necessary to provide support until the Analytics output was ready, but now users can move ahead themselves as long as they have Viz.

Benefits of Tableau Implementation
Efficient Exploratory Analysis
“Implementing Tableau benefited the Support Team in two major ways,” said Hiroaki Suzuki, who assists the Support Team as an Analytics Data Scientist.
Greatly reduce time spent on data extraction and hypothesis testing
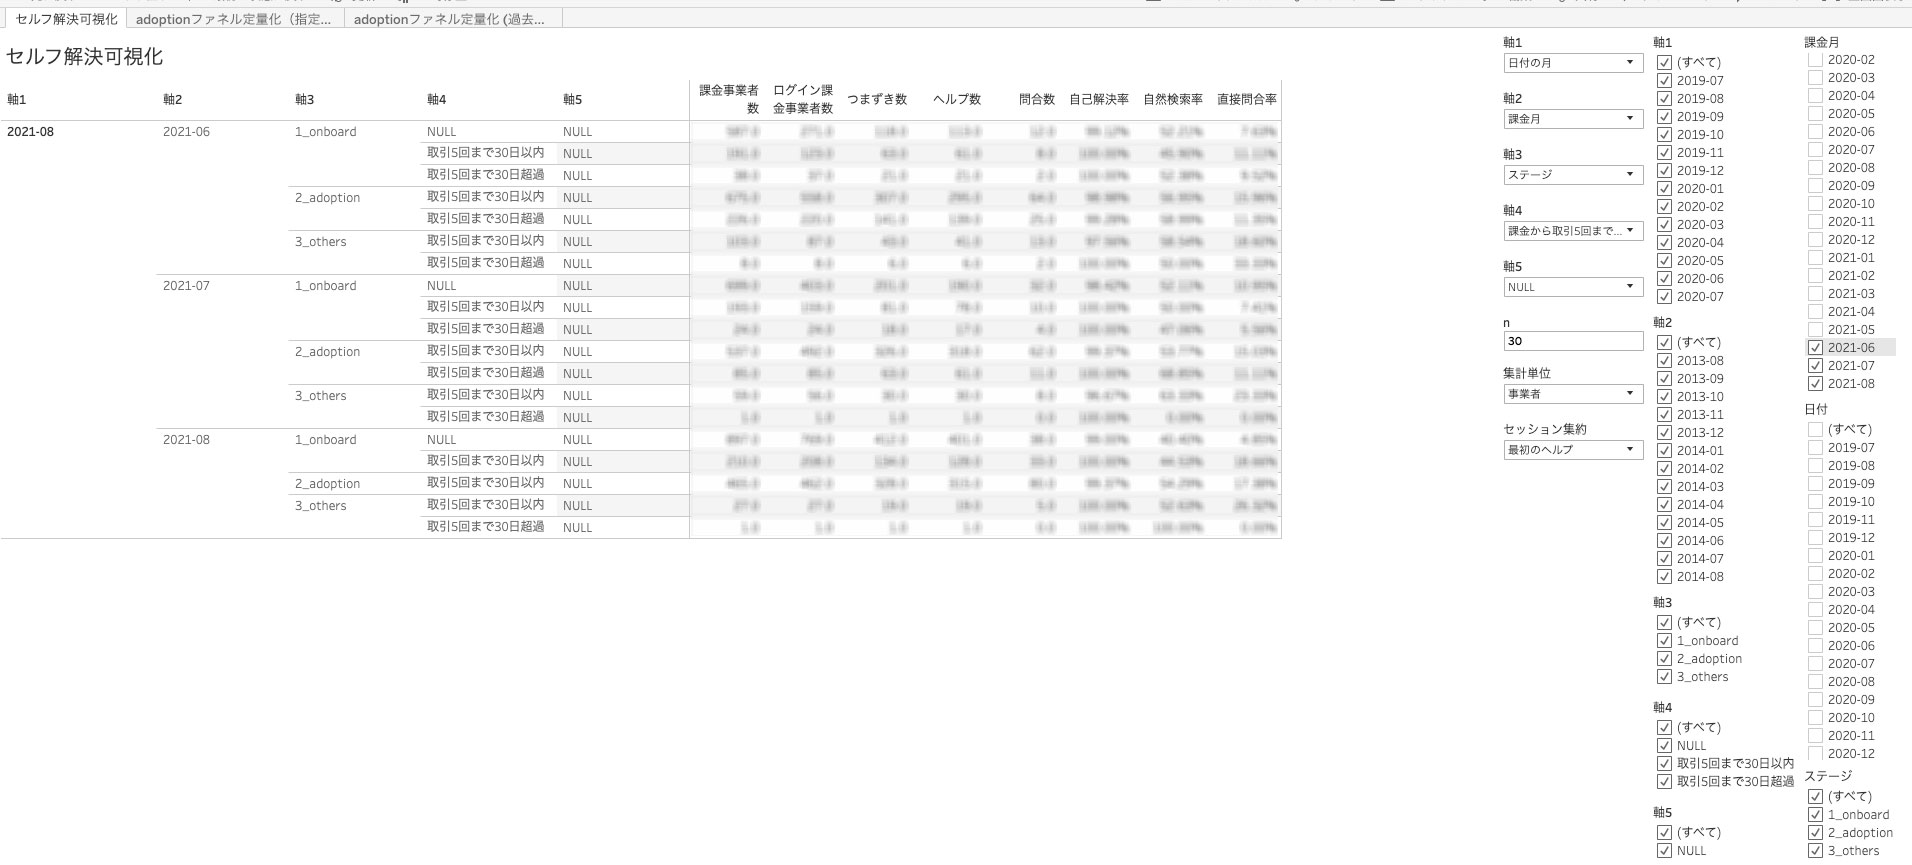
First, the data extraction process was made much simpler. “Previously, we created ten to twenty spreadsheets through Redash every time we wanted to visualize KPI. Now we can just use Tableau to conduct multifaceted analysis with one Viz.”
Simple Exploratory Analysis
Second, Tableau has made exploratory analysis much simpler. “Since analytical parameters can now be changed without using SQL, it’s easier to derive hypotheses from the data. Teams who used to take around 32 hours from data extraction to hypothesis formation now take two hours. It is also easier to visualize the full query funnel and simpler to drill down, so it’s easier to see what needs to be bolstered.”
Speed up the improvement cycle
This sort of streamlining has also sped up the improvement cycle. “In the past, each project would complete two improvement cycles at most per quarter. Since we implemented Tableau, this has been boosted to three cycles,” said Sekikawa.
With results like these, Tosa predicts that “even based just on what we see now, we should be able to recover our initial investment in one year.”
Since our business platform is Salesforce, we would like to embed Tableau’s Viz into Salesforce in the future. Through this, we expect to be able to visualize contract status and product usage status data within Salesforce, which will make our operations easier from a data perspective.

Future Developments
Linking with Salesforce to Promote the Use of Data in Daily Operations
“Moving forward, we are interested in linking Tableau with our operational platform, Salesforce,” said Sekikawa. He explained that, ultimately, they would like to embed Tableau’s Viz into Salesforce. If this were possible, the Customer Success Team and others could conduct data-backed decision-making as a part of their daily work. Additionally, enabling performance management visualizations in Salesforce would likely streamline the process by which accounting and operational departments compare results.
“freee has a different design philosophy than conventional accounting systems, and I feel that Tableau takes a similar approach,” said Tosa. It shows great power to open up tasks to everyone that were once restricted to specialists. “We plan to continue actively utilizing Tableau moving forward, growing the company through data-driven decision-making.”