DataFam Roundup: January 29–February 2, 2024


Welcome! Dig into this week's DataFam Roundup—a weekly blog that brings together community content all in one post. As always, we invite you to send us your content—and the DataFam content from your peers that have inspired you! Find the content submission form here.
Community Highlight
To recognize new and consistent Tableau contributors—we’re excited to have a section within the weekly DataFam Roundup called the Tableau Community Highlight. Find out how to get involved.

Penny Privett, Data Visualisation Lead, Australian Football League
Melbourne, Australia
Penny Privett is a Data Visualization Lead at the Australian Football League (AFL). She stays involved in the Tableau Community as co-lead of the Melbourne Tableau User Group, speaking at events such as Tableau DataFest and VizIt Sydney, being active on the Tableau Forums, and publishing content on Tableau Public.
Earlier last year, Penny joined the Melbourne Tableau User Group. She was drawn to the more laid back environment TUG’s provided as compared to formal conferences and events. After eventually taking on the role of co-lead, Penny now appreciates the invaluable connections she has made, insights she has exchanged, and supportive network she has built.
Over the past year, Penny has presented at many Australian conferences including Tableau DataFest in Melbourne and Sydney, VizIt Sydney, and Salesforce World Tour Essentials in Melbourne. Penny enjoys the chance to share the practical side of the work she does at the AFL and the journey of moving from their older static reporting systems to automated and interactive reporting using Tableau.
Connect with Penny on Linkedin and Tableau Public.
DataFam content
Dive into content created by the Tableau Community:
-
Frederic Fery: How Tableau Changed My Life
-
Dawn Harrington: Tiny Tableau Tips
-
Luke Stanke, The Data Leadership Collaborative: The Essential Link between Data Literacy and Data Ethics
-
Todd Bishop, GeekWire: An inside look at Tableau: What’s the future of the ‘DataFam’ at Salesforce?
-
Megha Narang: Journey to becoming a Tableau Ambassador - Steps, skills & Insights!
-
Steffen, Tableau Adventurer: How to put a ratio above a side by side bar chart built from two different measures
-
Jim Dehner: Filter 101
-
Jacqui Moore and Jeff Skoldberg: Ask Us Anything Analytics!
-
Andy Cheung: I made my own Spotify Wrapped 2023 using Python and Tableau
-
Maya Mikhailov, The Data Leadership Collaborative: A 5-Step Framework to Do Machine Learning Right
-
Sean Miller: #B2VB Tableau Live Stream - Scatterplots
-
Neil Richards, Sarah Nell-Rodriquez, Be Data Lit: Honest Careers: Navigating the Tech Evolution from the 90s to Now with Neil Richards
-
Alex Waleczek: Think Like a Hacker
-
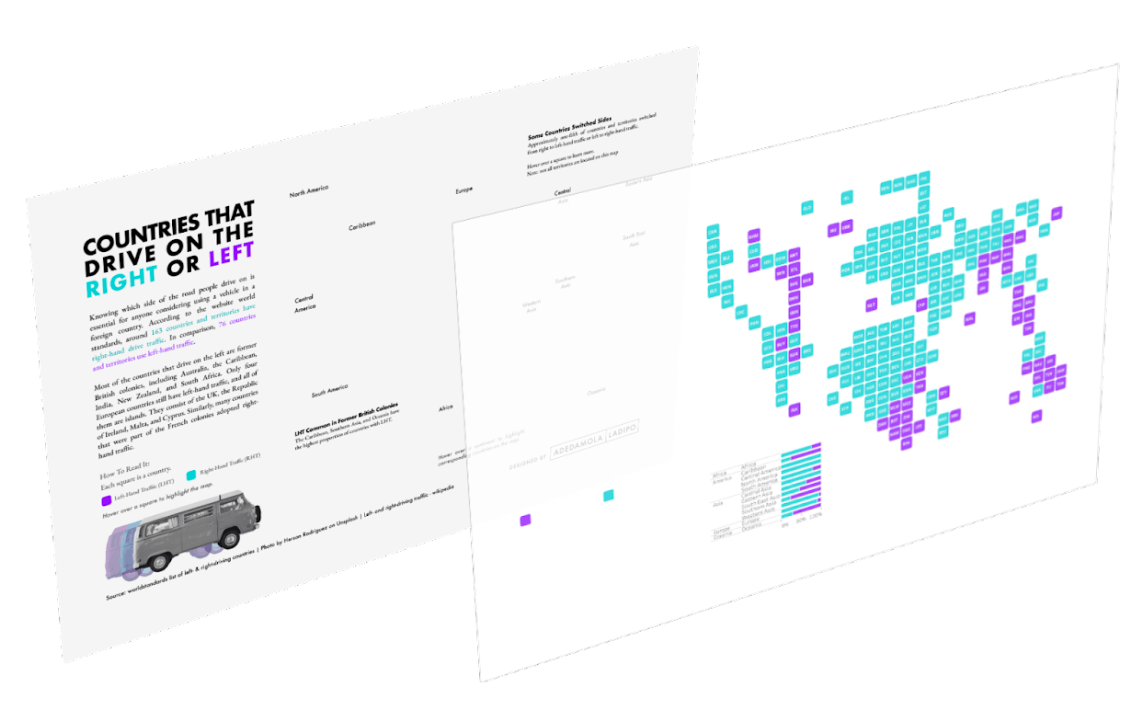
Damola Ladipo, The Flerlage Twins: A Journey Through The Design Process
-
Autumn Battani: Dynamic Font Color Hack in Tableau
Team Tableau
-
Practice and Grow Your Data Skills with Tableau Community Projects
- Transforming Ideas into Features: Tableau's Commitment to Community-Driven Innovation
- How Victor Muñoz Landed a Data Visualization Gig Using Hire Me
Upcoming events and community participation
-
Lights, Camera, Action: Tableau and IMDb Launch Data Visualization Campaign for Movie Lovers
-
READY TO SUPERCHARGE YOUR DATA SKILLS? The Information Lab has free, on demand training courses will help you to make sense of your data and take you from zero to data hero. Developed by our industry leading trainers, our expansive courses cover the basics to intermediate levels of Tableau, Alteryx and Tableau Prep! You can take advantage of the whole course or simply choose the modules you need to brush up on your skills. Start your data journey today by simply selecting your training course below.
-
Demystifying the way to learn Data Visualization! Are you looking for a way to learn Data Visualization and feeling lost? We all have been there and I am going to help you understand the fundamentals and look for a way to learn data visualization.
-
Viz Collab: Hello everyone! I’m excited to be opening #VizCollab back up for another round of matches! In the last year I matched around 40 people for some amazing vizzes, including Viz of the Days and a viz that was featured in a local publication. So if you want to find a collaboration partner sign up.
Vizzes
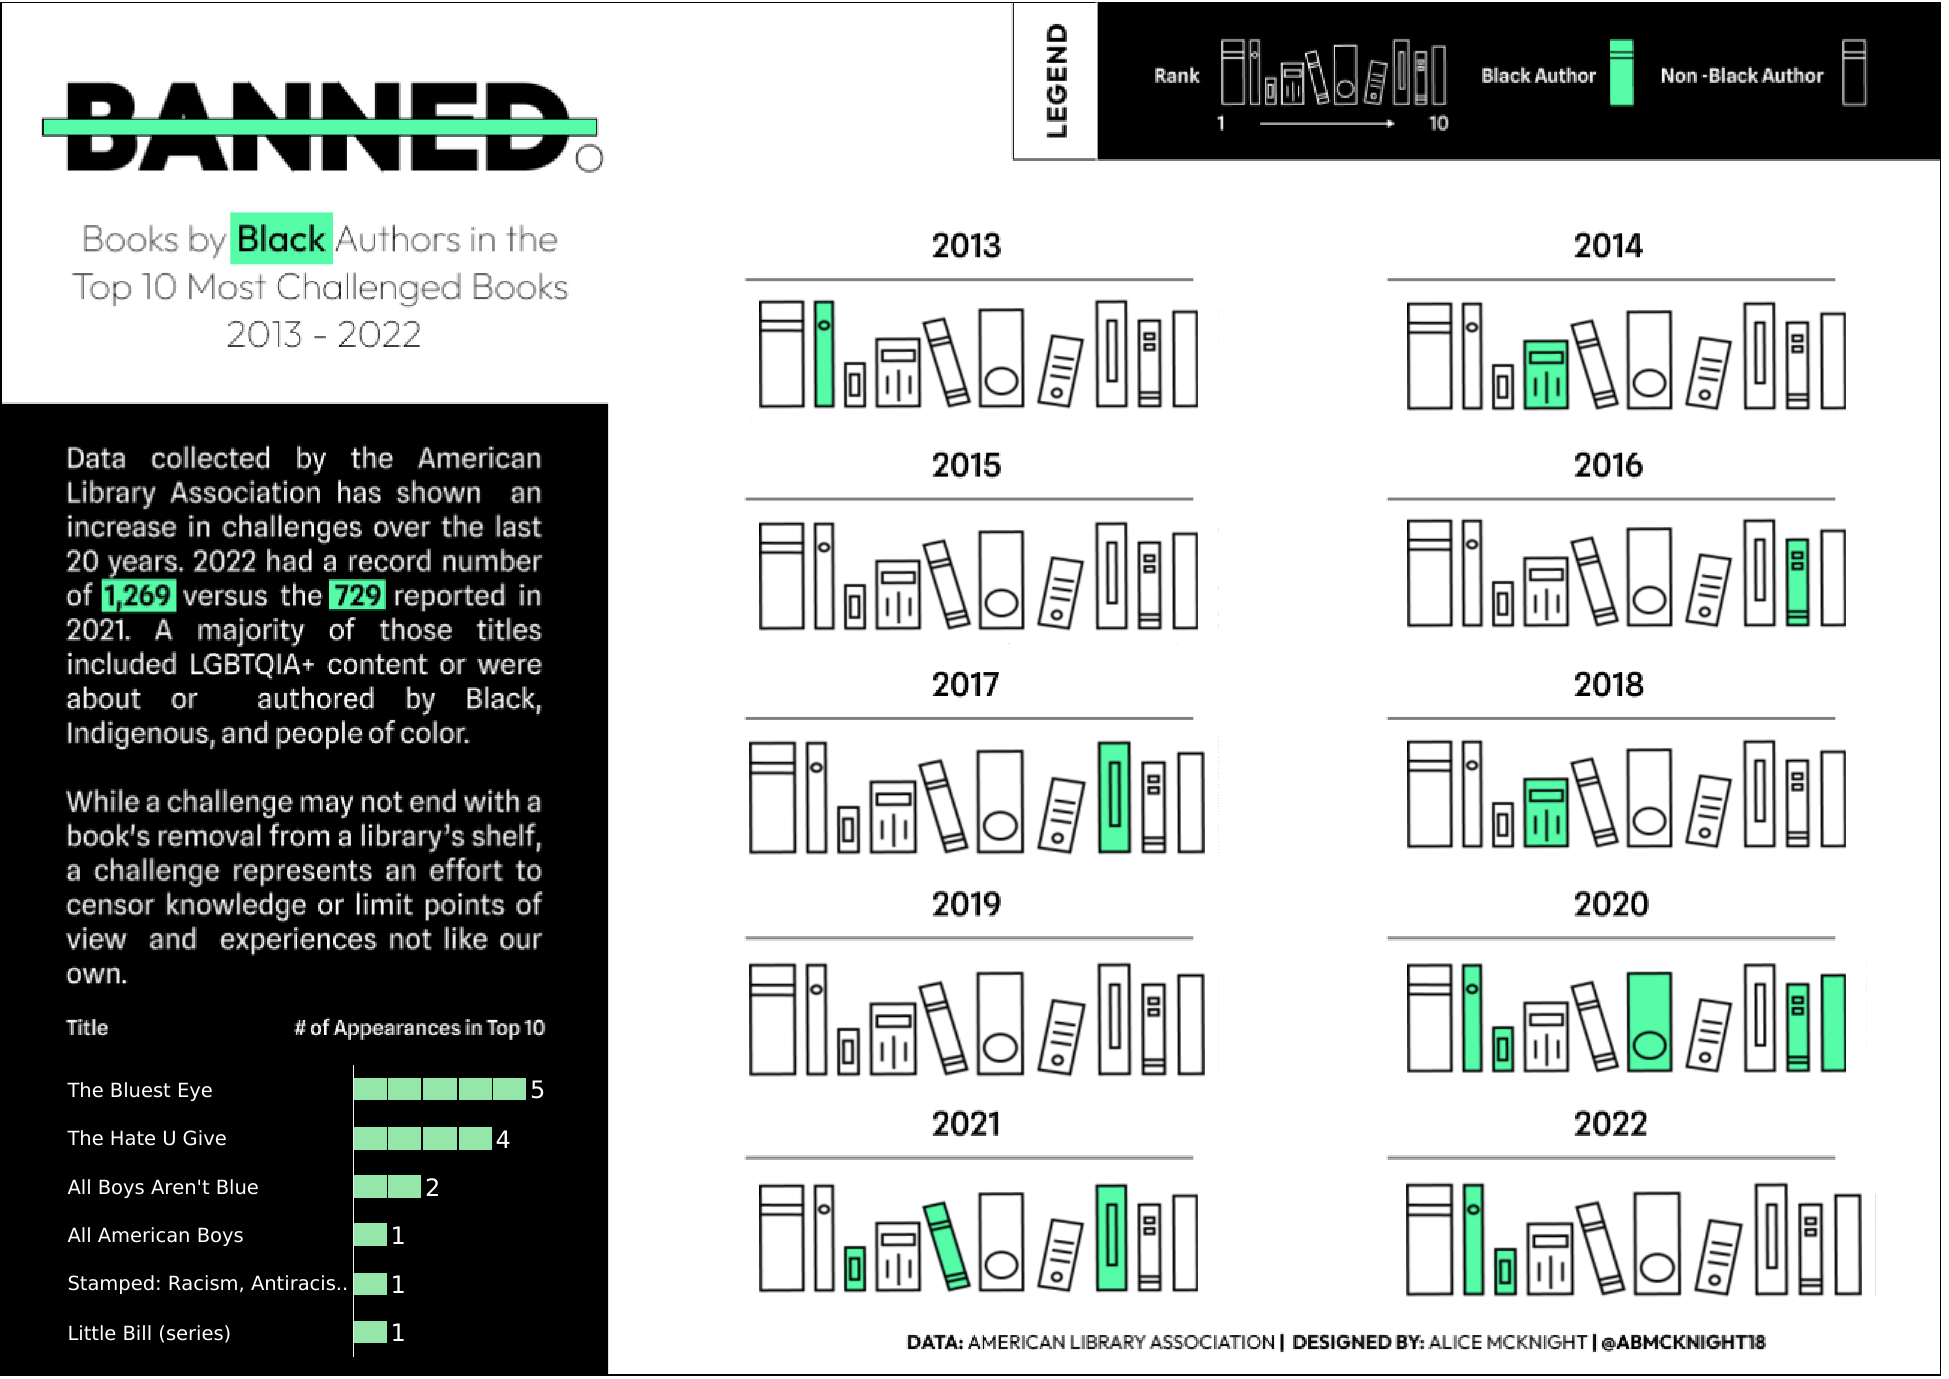
Alice McKnight: Banned: Books by Black Authors 2013 - 2022
See the latest Viz of the Day, trending vizzes, featured authors, and more on Tableau Public.
Check out some inspirational vizzes created by the community:
-
Tamás Varga: The cheapest countries to study in Europe 2023
-
Alice McKnight: Banned: Books by Black Authors 2013 - 2022
-
Ian Cedric Io: tripleS: Korean Pop Music and Blockchain
-
Diana Kung'u: Cost of Higher Education in EU #MoM2024|W5
-
Aakarsh R: The Cheapest Countries to Study in Europe | #MakeOverMonday
-
Chimdi Nwosu: #MakeoverMonday2024 Wk 5 - The Cost to Study in Europe
Community Projects
Recreations of W.E.B Dubois's Data Portraits
Recreations of W.E.B Dubois's Data Portraits
Web: W.E.B. Dubois's Data Portraits
Twitter: #DubiosChallenge
Back 2 Viz Basics
A bi-weekly project helping those who are newer in the community and just starting out with Tableau. Not limited just to newbies!
Web: Back 2 Viz Basics
Twitter: #B2VB
Week 2: Build a Scatter Plot
Workout Wednesday
Build your skills with a weekly challenge to re-create an interactive data visualization.
Web: Workout Wednesday
Twitter: #WOW2022
Week 5: Excel at Tableau Interactivity with Dynamic Zone Visibility
Preppin' Data
A weekly challenge to help you learn to prepare data and use Tableau Prep.
Web: Preppin’ Data
Twitter: #PreppinData
Week 5: Getting the right data
DataFam Con
A monthly challenge covering pop culture and fandoms.
Web: DataFam Con
Twitter: #DataFamCon
February 2024 Challenge: Unveiling Romance
EduVizzers
A monthly project connecting real education data with real people.
Web: Eduvizzers
February 2024: SPP compared to SPS Kindergarteners | City of Seattle Open Data Portal
Games Night Viz
A monthly project focusing on using data from your favorite games.
Web: Games Nights Viz
Twitter: #GamesNightViz
Season 2: With great power comes great vizzes
Iron Quest
Practice data sourcing, preparation, and visualization skills in a themed monthly challenge.
Web: Iron Quest
Twitter: #IronQuest
White Space
Storytelling with Data
Practice data visualization and storytelling skills by participating in monthly challenges and exercises.
Web: Storytelling with Data
Twitter: #SWDChallenge
January 2024: upskill with UpSets
Project Health Viz
Uncover new stories by visualizing healthcare data sets provided each month.
Web: Project Health Viz
Twitter: #ProjectHealthViz
October 2023: Customizing Shapes with Opacity in Tableau
Diversity in Data
An initiative centered around diversity, equity & awareness by visualizing provided datasets each month.
Web: Diversity in Data
Twitter: #DiversityinData
November 2023: Disney Demographics
Sports Viz Sunday
Create and share data visualizations using rich, sports-themed data sets in a monthly challenge.
Web: Sports Viz Sunday
Twitter: #SportsVizSunday
Viz for Social Good
Volunteer to design data visualizations that help nonprofits harness the power of data for social change.
Web: Viz for Social Good
Twitter: #VizforSocialGood
Real World Fake Data
Create business dashboards using provided data sets for various industries and departments.
Web: Real World Fake Data
Twitter: #RWFD
Session 6: HR Cross-Function Mobility
Makeover Monday
Create business dashboards using provided data sets for various industries and departments.
Web: Makeover Monday
Twitter: #MakeoverMonday
Data Plus Music
A monthly project visualizing the data behind the music we love!
Web: Data Plus Music
Twitter: #DataPlusMusic
Related stories

DataFam Roundup June 2026

DataFam Roundup May 2026

Iron Viz 2026: Read Between the Data
 28 May, 2026