Creating Richer Tables Using Blocks


For over fifteen years, the VizQL visual query algebra and Tableau’s Rows/Columns/Marks Card user interface for it have been the fastest, most flexible way to see and understand your data in the way you want to see it without writing a line of code.
Still, there are always some tasks that take a bit more — or in some cases, much more — effort. The Tableau Community Forums and the wider community are filled with recipes to build visualizations that do not come easily to a casual user.
In Tableau Research, a team of us combed through these recipes and interviewed users, looking for commonalities that might form the basis for a more expressive algebra than VizQL. We settled on the distinction between “headers” and “marks” in Tableau visualizations. In the examples below, everything shaded in blue is a header, formed by the blue discrete pills on the Rows and Columns shelves; everything shared in yellow is a mark, formed by the encodings selected on the Marks Card.
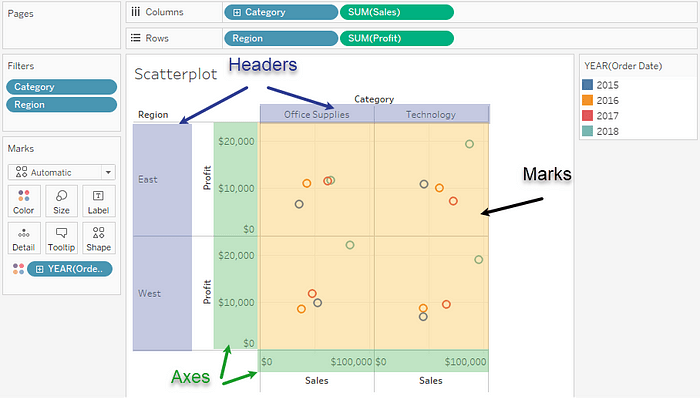
In a scatter plot, the distinction between headers and marks is obvious.
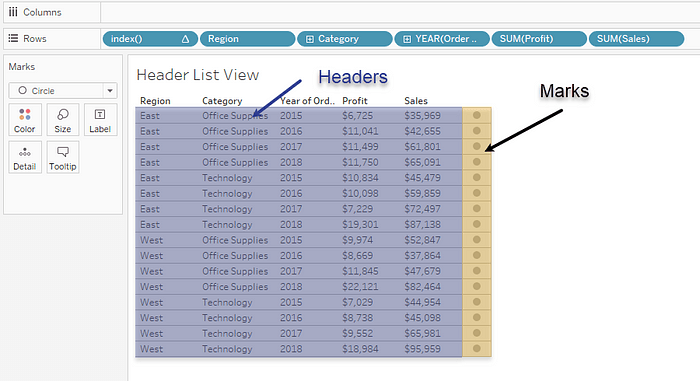
In this table, the user has made the measures discrete and added them to the headers; usually, they would hide the circle marks, which I have left visible here for illustrative purposes. By making the measures headers, the user could re-arrange the order of the columns if desired, but they lose the ability to apply visual encodings.
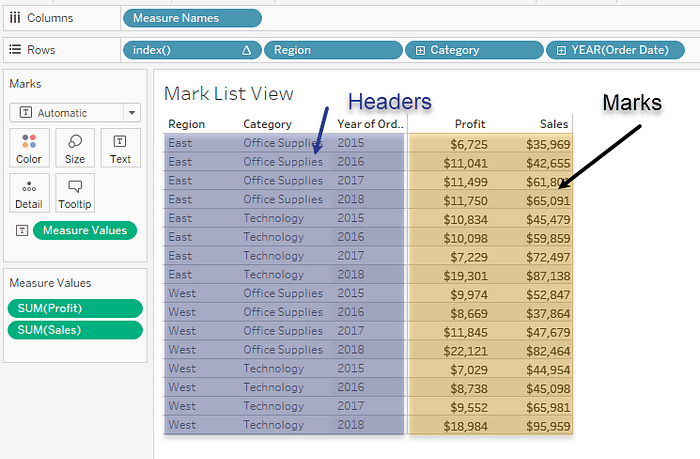
This table, almost visually identical to the one above, uses Measure Names/Values rather than headers to display the measures. This would allow the measures to be visually encoded, but prevents reordering the columns of measures to the left of Category or Order Date.
Headers and marks have distinct properties in Tableau; headers define the structure of the viz, but only marks can have rich visual encodings such as color, shape, size, or even customized tooltips. Users often wish they could have both. They resort to workarounds such as putting discrete measures on Rows and Columns, the “MIN(1)” trick, assembling multiple visualizations onto a dashboard to appear as one, and other techniques. All of these have their own limitations.
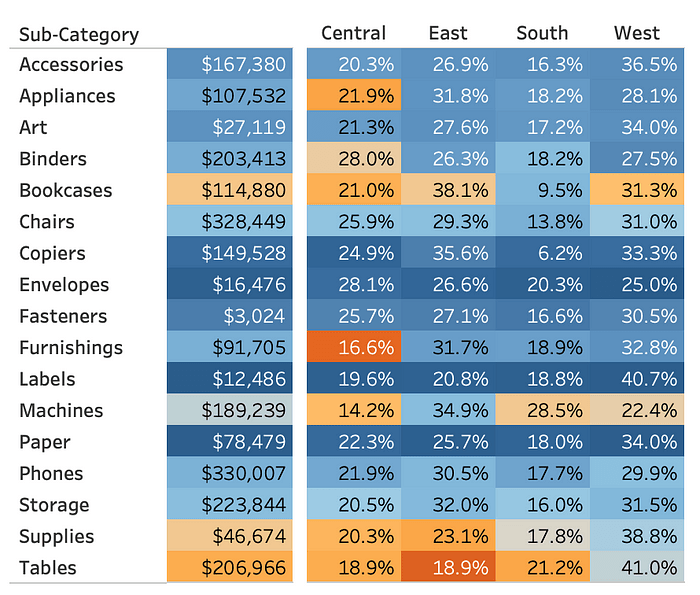
A visualization built as a dashboard, aligning two Tableau worksheets both with Sub-Category on Rows. This allows display of Sales at the Sub-Category LOD and percent of total at the Region, Sub-Category LOD, both with a color encoding, which would not be possible on a single sheet. Using two sheets makes maintenance more difficult; if the number of sub-categories increases, the two sheets will not scroll together.
We asked ourselves — what if there were a new, single type of thing that could both define the structure of your visualization and carry all of Tableau’s rich visual encodings? Many whiteboard conversations and false starts later, we came up with the idea of Blocks and created a prototype implementation. Our paper, Blocks: Creating Rich Tables With Drag and Drop Interaction, won an honorable mention at EuroVis 2022, June 13th-17th.
What is a Block?
A Block, roughly, is a single Tableau Marks card — plus the ability to define structure and to have parent/child relationships with other Blocks. Each Block supports the familiar Tableau encodings, plus a structure type of Rows, Columns, or Inline, plus optional X and Y axes. Moving the X and Y axes to individual Blocks, rather than having them on global Rows and Columns shelves, supports sparklines and other complex visualizations.
An Inline Block is essentially a Tableau visualization with no discrete fields on Rows or Columns. Here we build the same scatter plot in Tableau on the left and the Blocks prototype on the right.
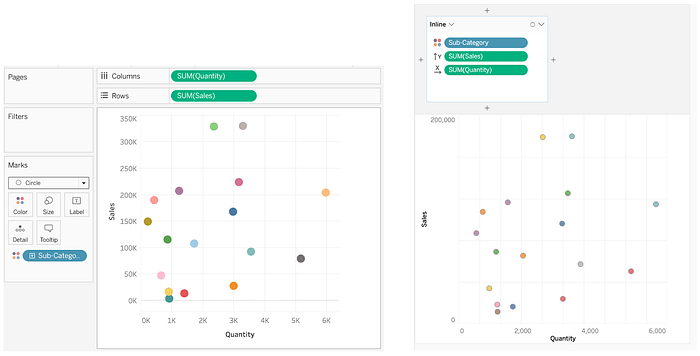
A simple scatter plot built in Tableau (left) and Blocks (right).
A Rows Block creates one row for each set of dimension values from its encoding; the simplest version of this looks just like a single field on Rows in Tableau, but unlike Tableau headers, Rows Blocks can also have visual encodings; if these encodings are also dimensions, they will result in more Rows; a Columns Block is similar.
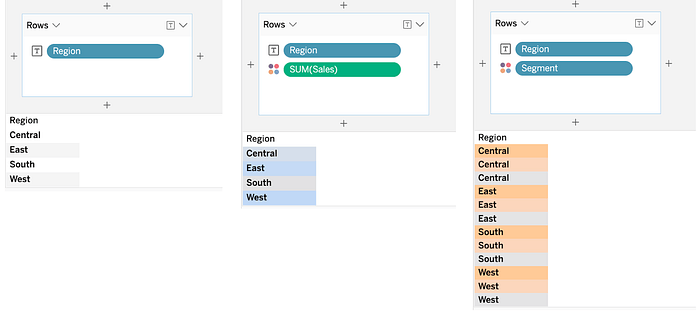
Single Rows blocks, with just one dimension, one dimension and a measure, and two dimensions.
The real power of Blocks comes from relationships between Blocks. Each Block inherits its Rows or Columns structure from its parents, if it has any. For example, below is the dashboard from earlier, rebuilt using a group of Blocks, and with line graphs added. We wanted to build actual sparklines, but the prototype doesn’t yet have the options to turn off the axis labels and reduce the height.
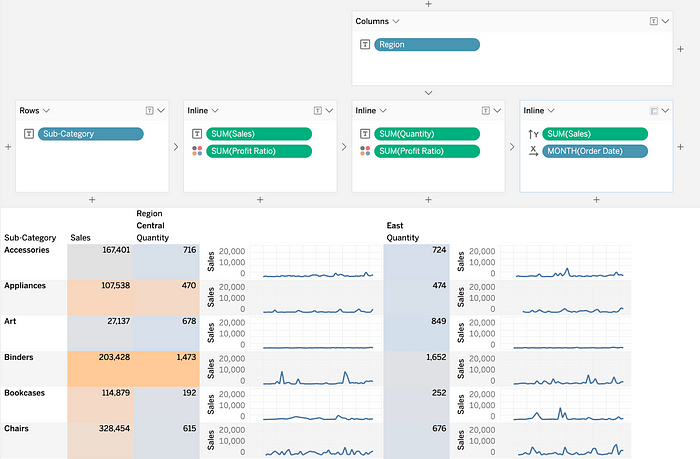
The arrows indicate parent-child relationships; the rightmost two inline Blocks have both Rows and Columns parents, inheriting Sub-Category from one and Region from the other. The next block to the left is only a child of Sub-Category, so the measures are computed at that level instead, no Level of Detail calculations needed. The prototype doesn’t support table calculations currently, so we show Quantity here rather than the percent-of-total from the Tableau version.
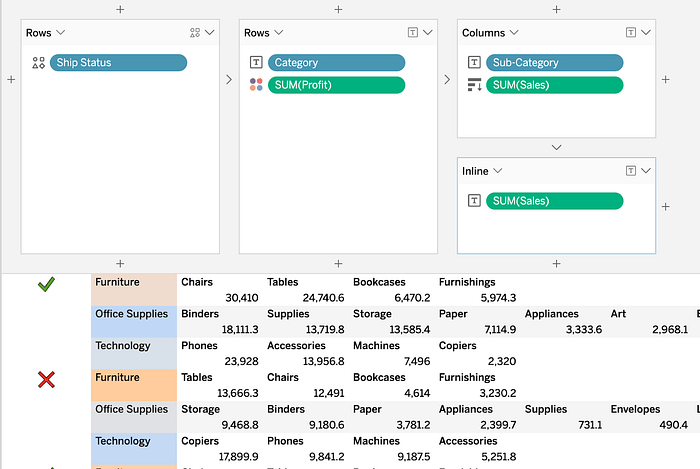
The next example shows shape marks used to define rows and nested columns with the sub-categories ordered by highest sales for each category and ship status.
We conducted a user study on the usability of the Blocks prototype. All of the participants were Tableau employees of varying roles and expertise. Reactions ranged from confusion at the different interface to “this is ridiculously awesome!”. You can see a video summary of the user study here.
In this article, we show how Blocks can be a promising UI paradigm for supporting the creation of rich tables. We plan to further build on this paradigm to explore additional analytical and interaction capabilities along with useful visual scaffolds to guide users during visual analysis. We hope that insights from our work inspire interesting research directions to balance expressivity, ease of use, and analytical richness in visual analysis tools. For more details on Blocks, please refer to our paper.
Related stories

Tableau Agent: Building the Future of AI-Driven Analytics
 10 May, 2024

How we translate millions of words to localize Tableau into over 10 languages
