
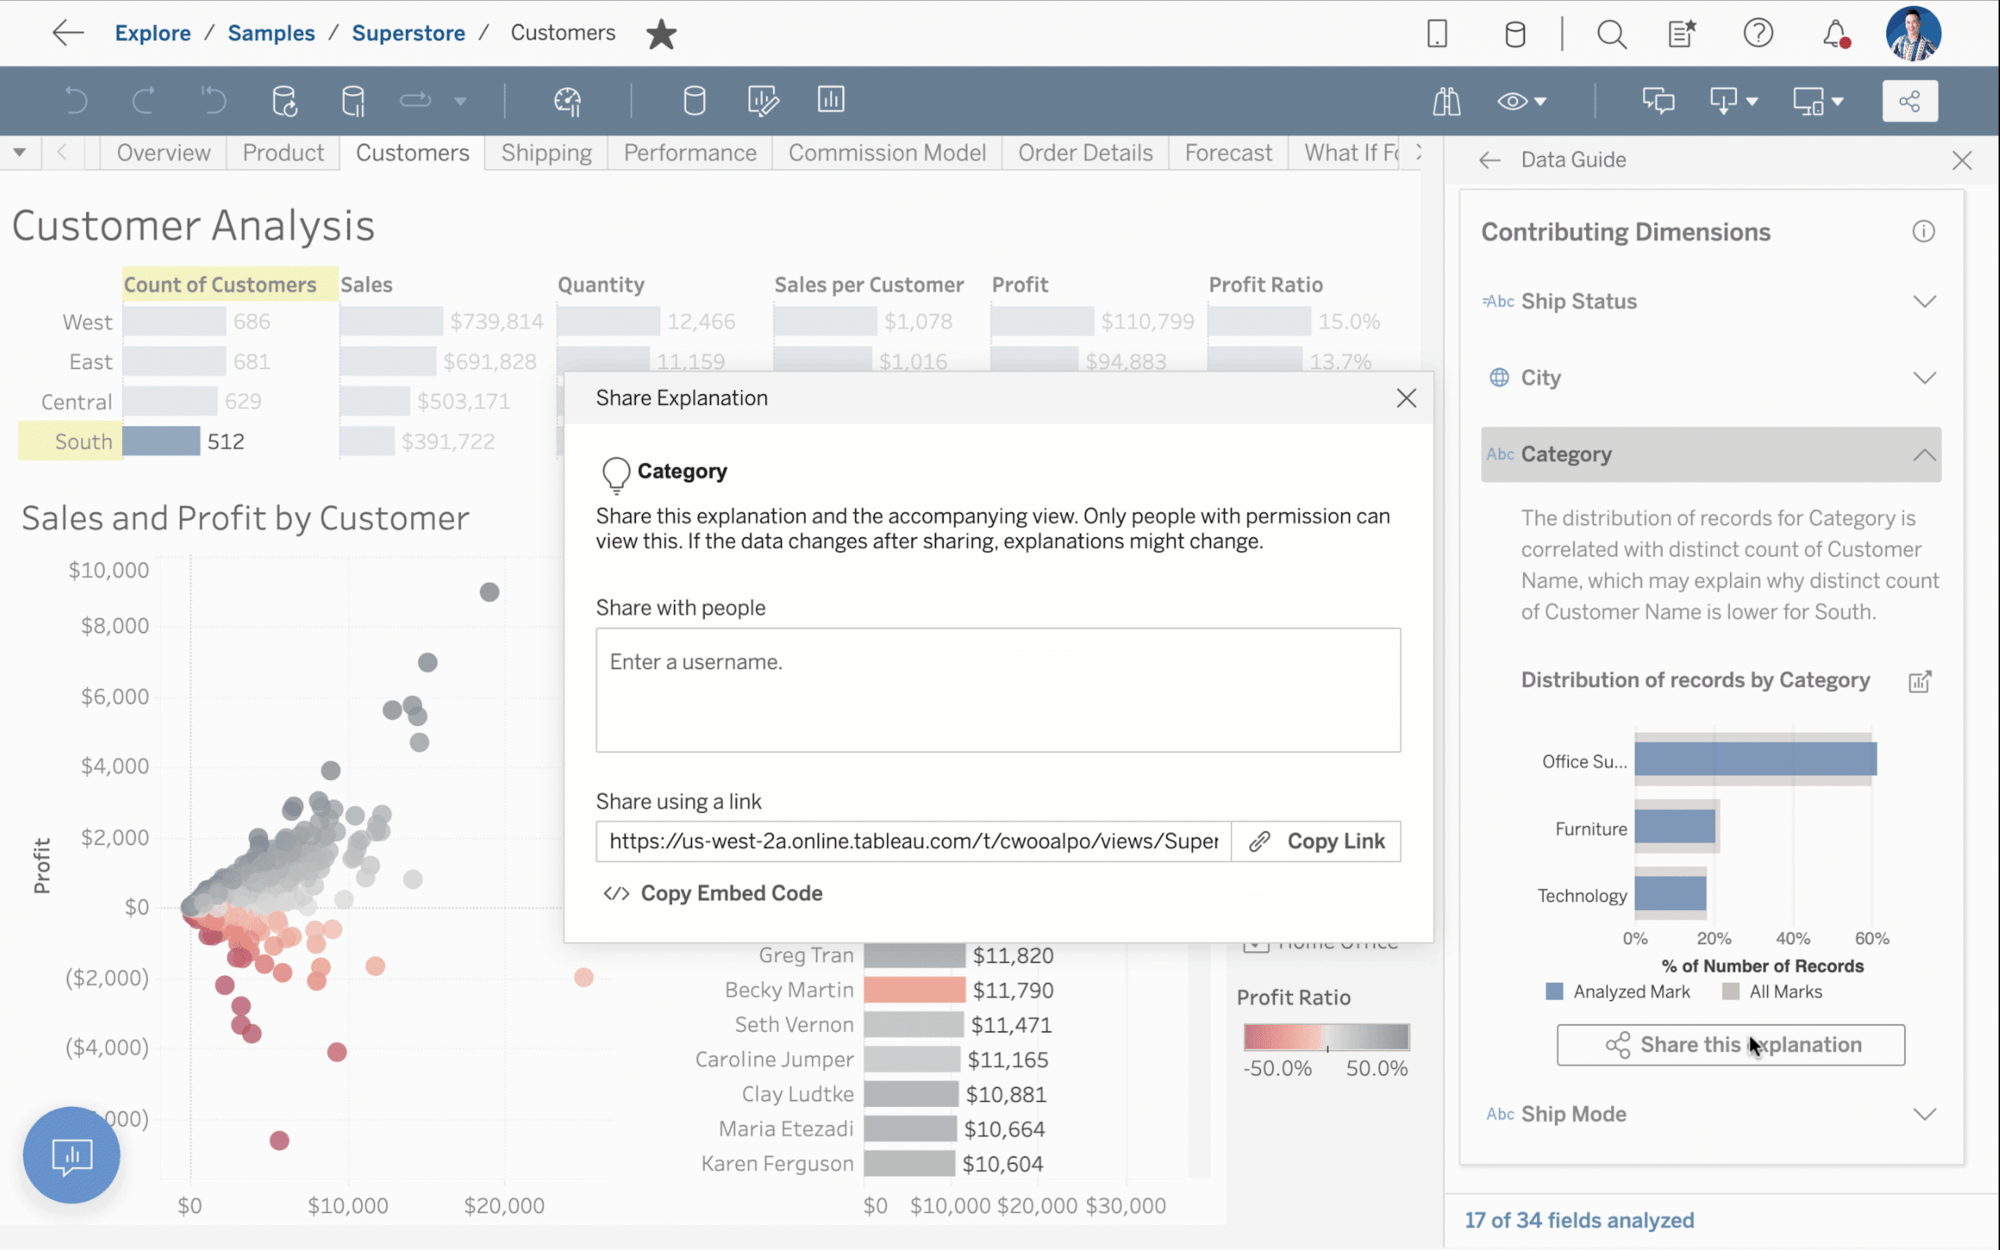
Data Guide
Data Guide is a new pane that provides helpful information about a dashboard and the data behind it. With Data Guide, you can understand if the data can answer your questions, build trust that the data is accurate, and establish confidence in your understanding of the viz. This feature makes it even easier to find data related to the selected viz, dashboard and marks, and important information like outliers and trends in your data. This pane is available on Tableau Server, Tableau Cloud and Tableau Desktop.
Data Guide also introduces two new tools to help you decide which parts of the dashboard to focus on so you can get to insights faster: Explain The Viz and Data Change Radar. Explain the Viz scans your dashboards for outlier measures and potential key drivers behind them. Data Change Radar (Tableau Cloud only) tracks measure values in your dashboard over time and automatically flags unexpected values outside of normal business patterns as data refreshes.
Table Extensions
Table Extensions add new depth to seeing and understanding data by bringing deep analytics and data shaping with code and APIs to the core of Tableau. Dynamically bring entire data tables from analytics tools like Python, R, Einstein Discovery and more into Tableau's data model. Live query tables of data using Tableau's Data Model and pass it to analytics extensions for analysis, re-shaping or enrichment, and return results tables to Tableau just like any other data source. With Table Extensions, you can inject advanced analytics and predictions at different levels of detail, bring more data for better business decisions, and get real-time results because values are re-computed dynamically.
Dynamic zone visibility
With dynamic zone visibility, you can tailor experiences for your end users so they only see the dashboard elements relevant to them. Create sophisticated and interactive dashboards that dynamically reveal dashboard elements. In the layout pane, you configure when dashboard elements are shown or hidden based on the values of parameters and fields.
Tableau 2022.3 feature overview
Tune in for an overview to hear about the latest features from 2022 Tableau Visionary, Ann Jackson. She will walk you through the new features included in this release.
Watch nowAll features
2022.3
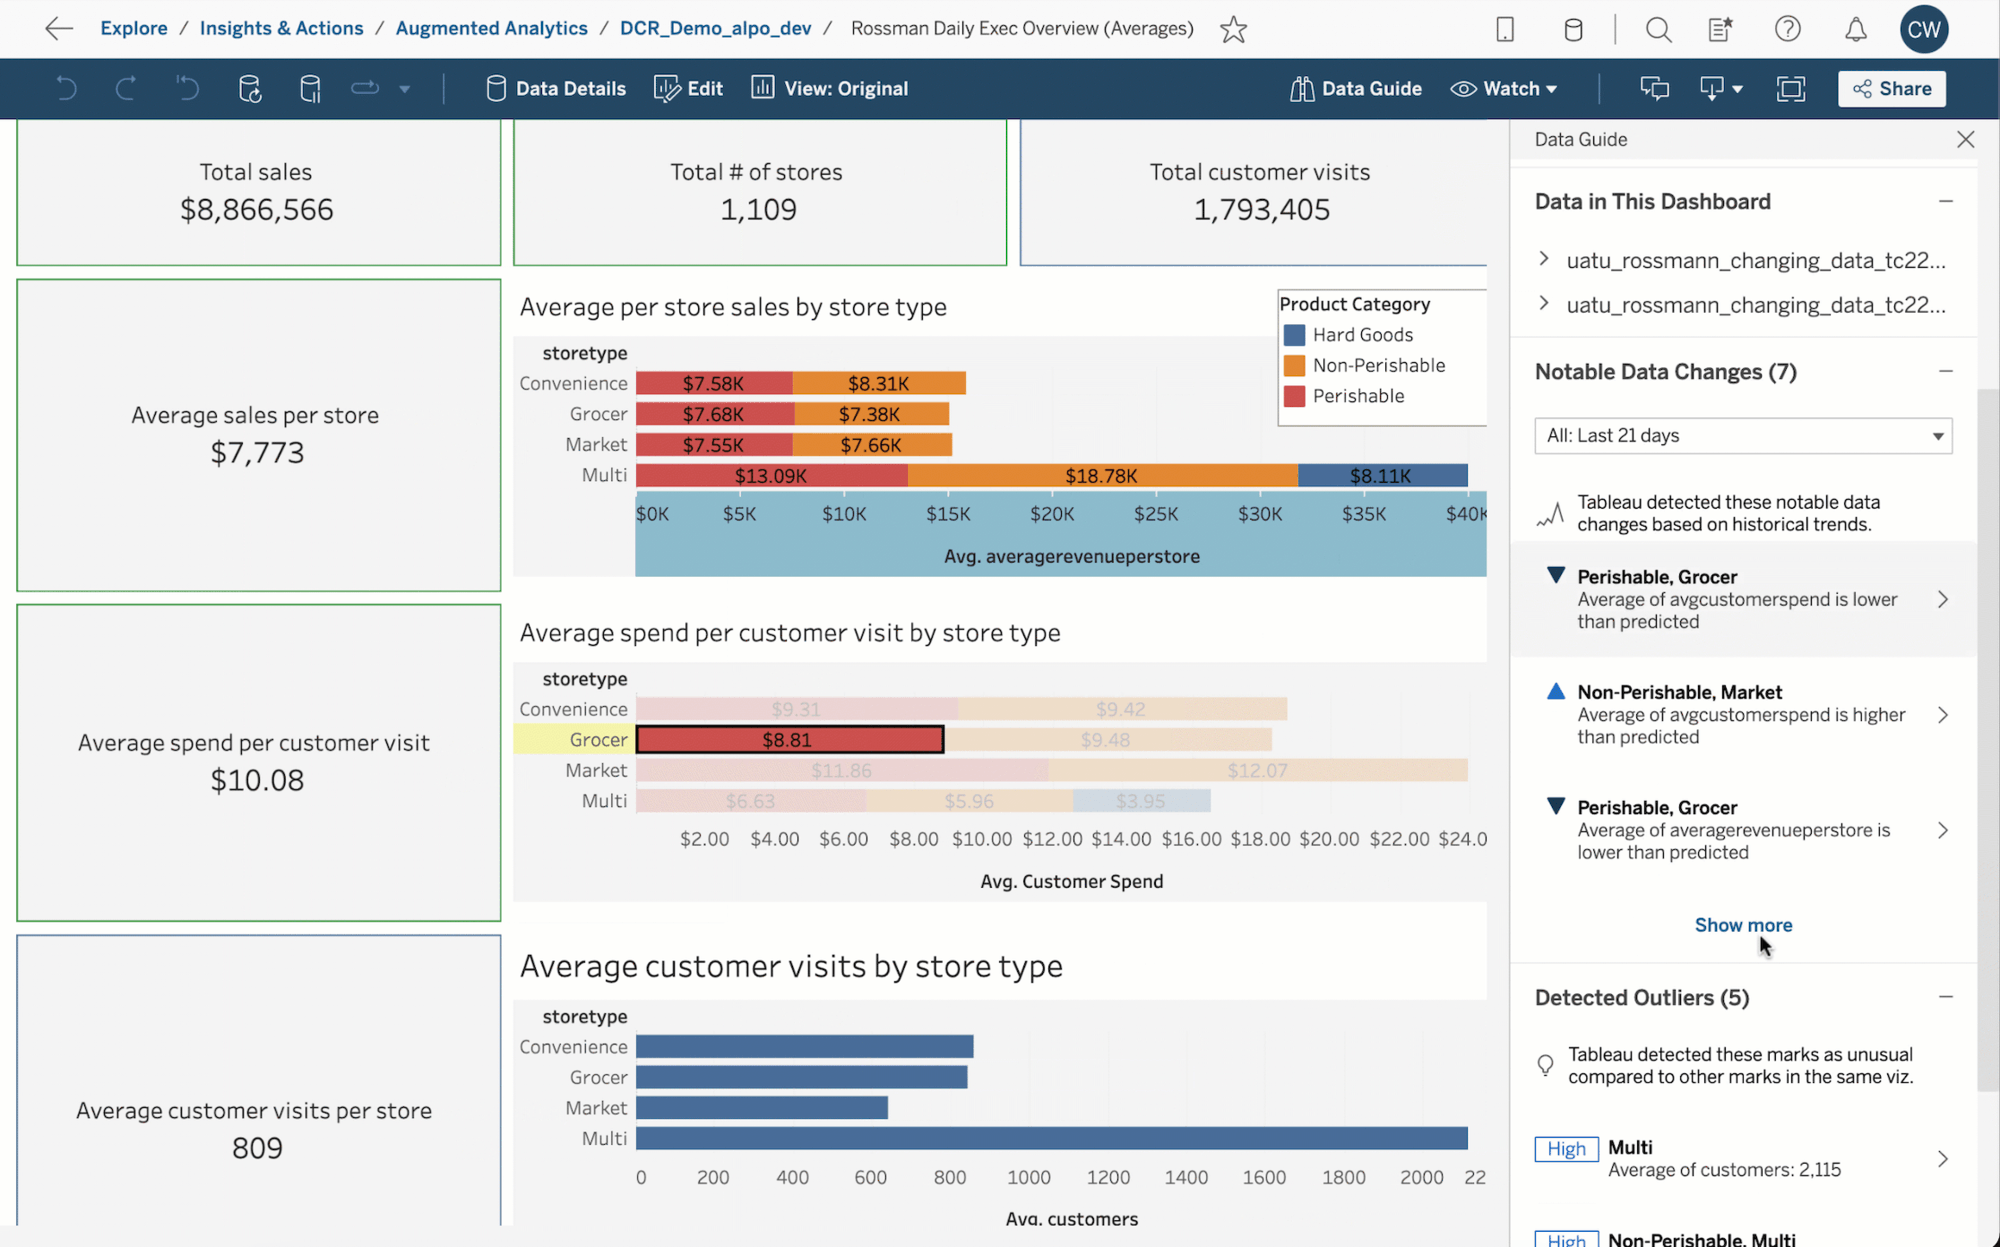
Data Guide
Data Guide is a new pane that provides helpful information about a dashboard and the data behind it. With Data Guide, you can understand if the data can answer your questions, build trust that the data is accurate, and establish confidence in your understanding of the viz. This feature makes it even easier to find data related to the selected viz, dashboard and marks, and important information like outliers and trends in your data. This pane is available on Tableau Server, Tableau Cloud and Tableau Desktop. More information here.
Data Guide also introduces two new tools to help you decide which parts of the dashboard to focus on so you can get to insights faster: Explain The Viz and Data Change Radar. Explain the Viz scans your dashboards for outlier measures and potential key drivers behind them. More information here. Data Change Radar (Tableau Cloud only) tracks measure values in your dashboard over time and automatically flags unexpected values outside of normal business patterns as data refreshes. More information here.
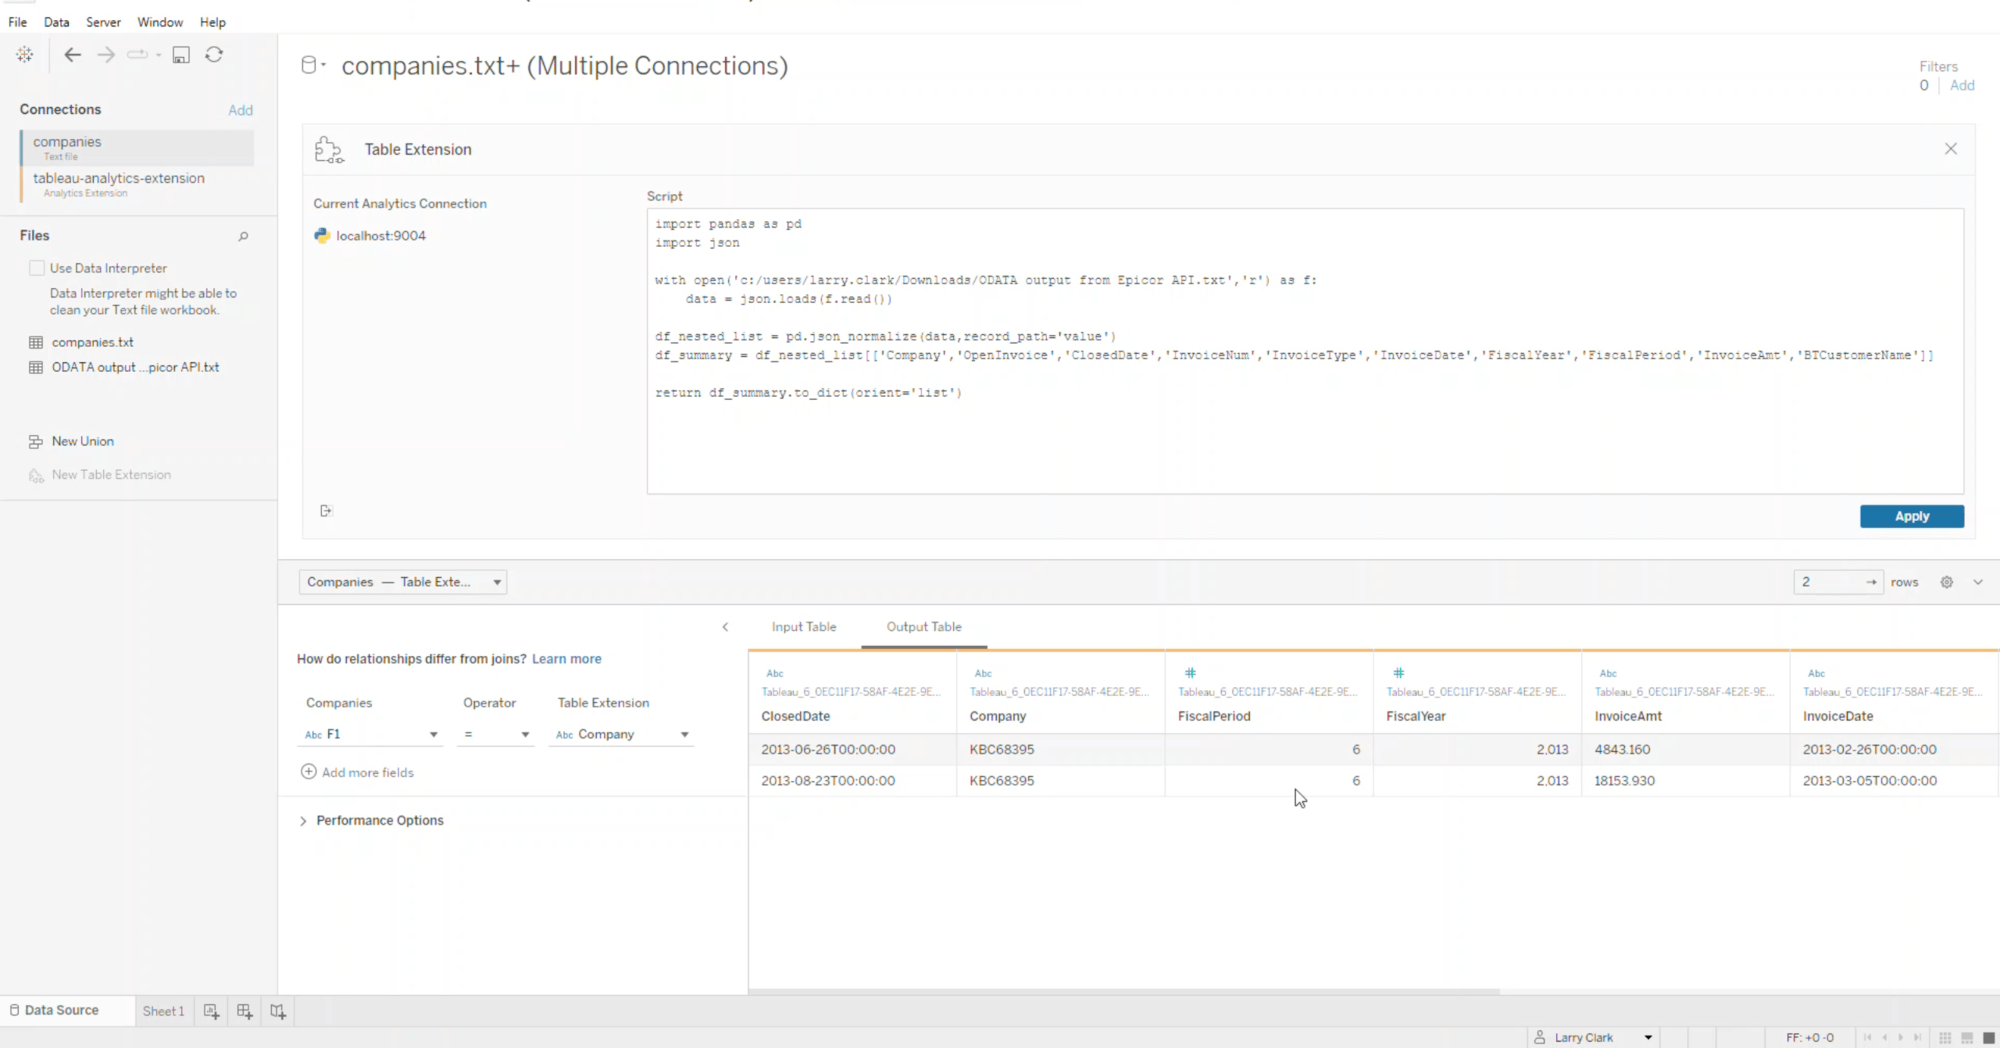
Table Extensions
Table Extensions add new depth to seeing and understanding data by bringing deep analytics and data shaping with code and APIs to the core of Tableau. Dynamically bring entire data tables from analytics tools like Python, R, Einstein Discovery and more into Tableau's data model. Live query tables of data using Tableau's Data Model and pass it to analytics extensions for analysis, re-shaping or enrichment, and return results tables to Tableau just like any other data source. With Table Extensions, you can inject advanced analytics and predictions at different levels of detail, bring more data for better business decisions, and get real-time results because values are re-computed dynamically.
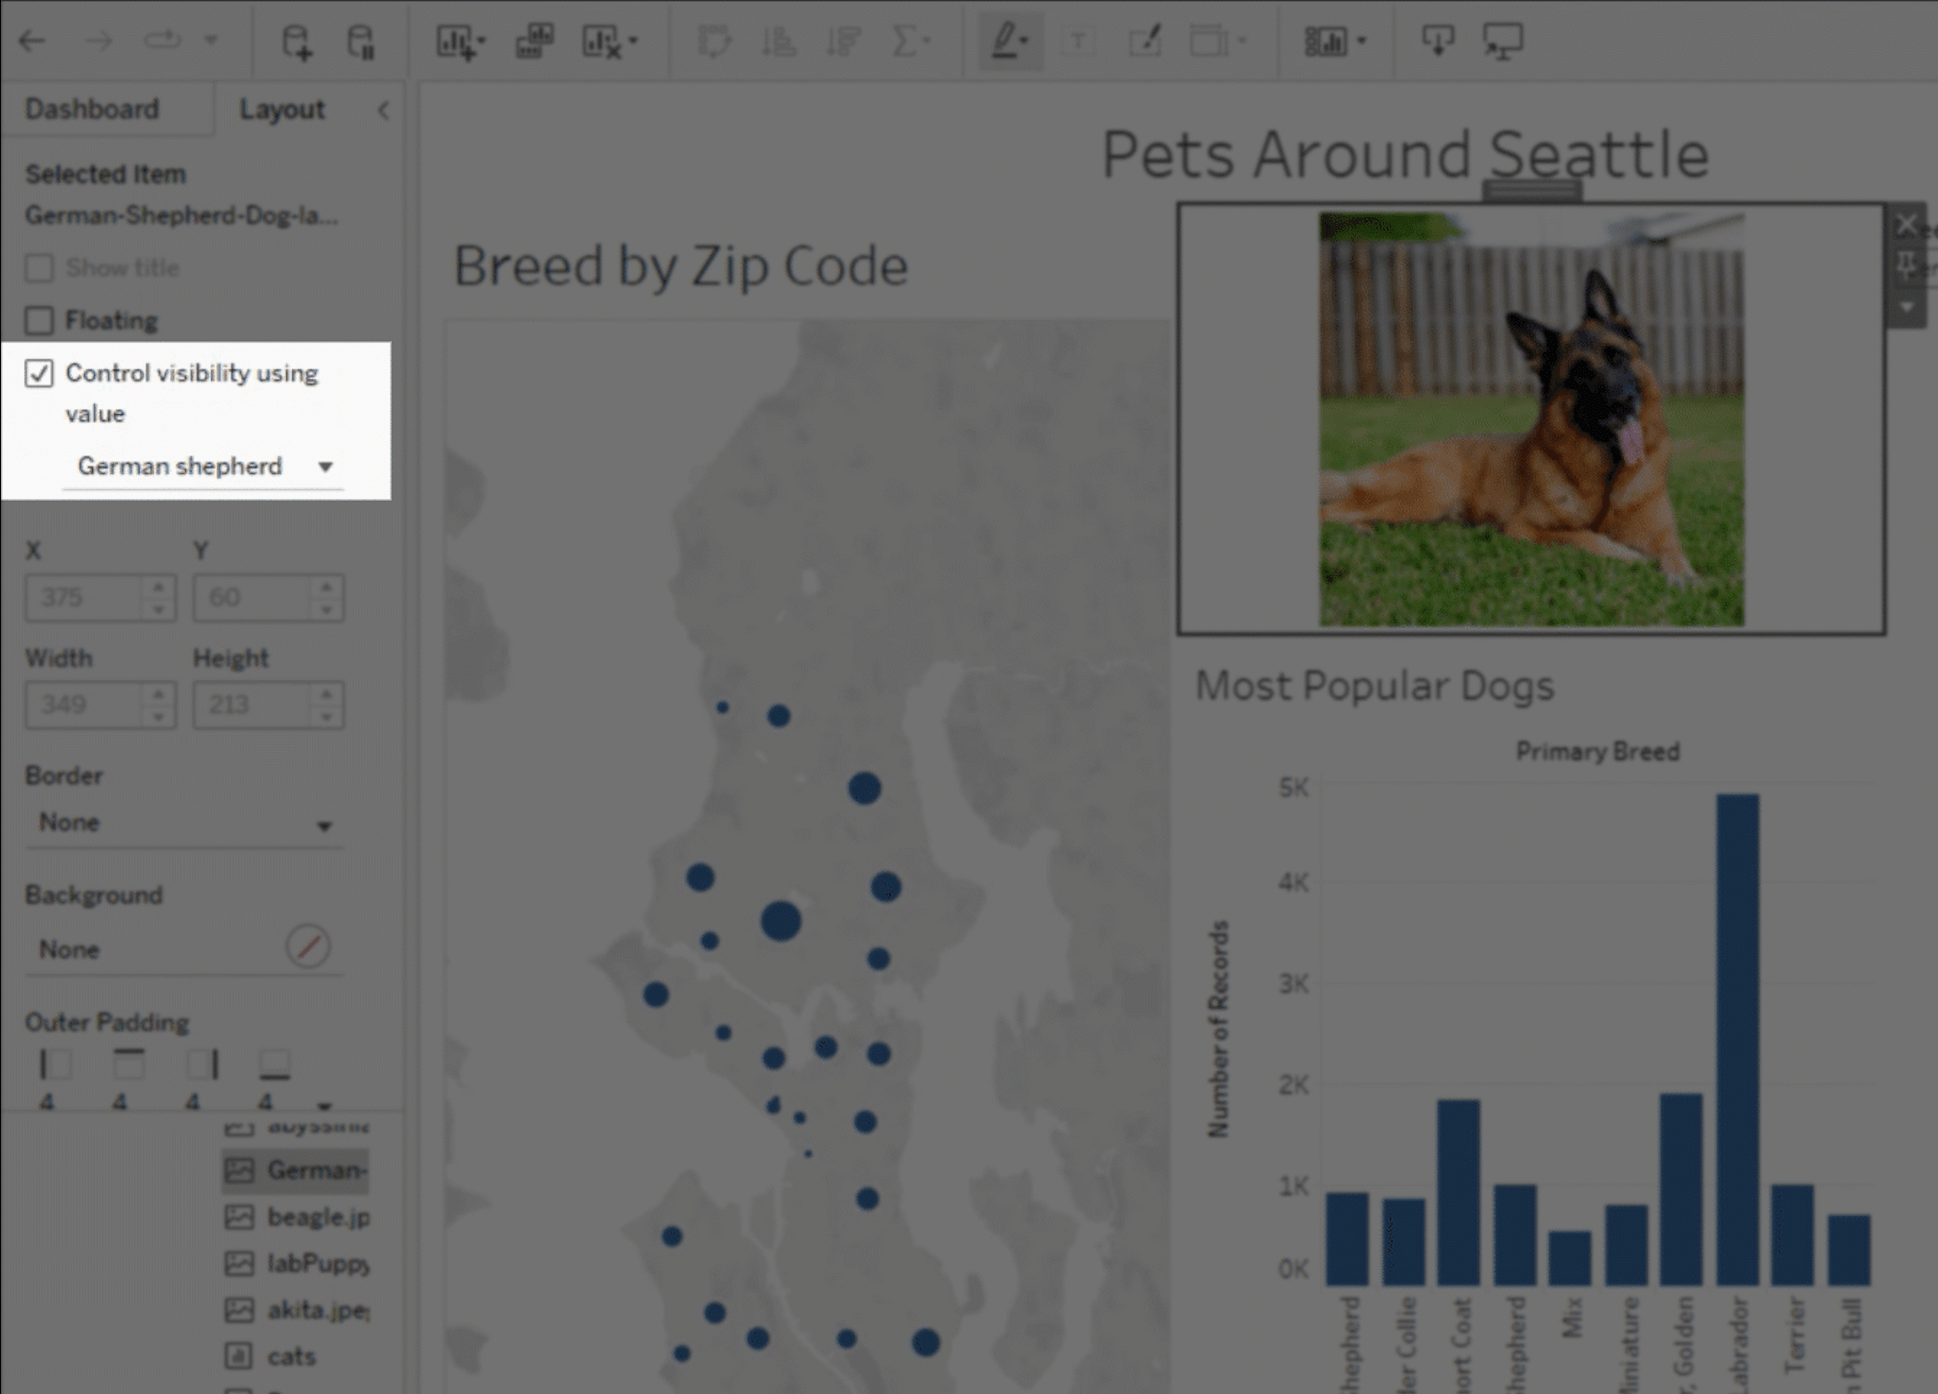
Dynamic zone visibility
With dynamic zone visibility, you can tailor experiences for your end users so they only see the dashboard elements relevant to them. Create sophisticated and interactive dashboards that dynamically reveal dashboard elements. In the layout pane, you configure when dashboard elements are shown or hidden based on the values of parameters and fields. More information here.
Dynamic scaling in a container
Advanced Management for Tableau Server customers can now scale Backgrounders, and their supporting processes, in Docker containers via Kubernetes on a set schedule. In the past, Tableau Server admins faced a predicament: pay to size the deployment for peak load times, or save money but face longer delays before Backgrounder processes finish. Now, you can add additional Backgrounder resources when needed and spin them down after peak times, giving you control over the cost-vs-performance tradeoff.
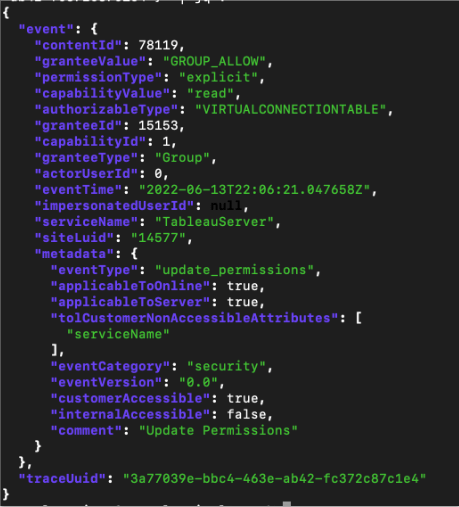
Activity Log in Tableau Server
The Activity Log goes above and beyond existing event data by exposing more events within your Tableau environment. These events will be structured and documented. For Advanced Management for Tableau Server customers, this comes to life through a new log file in your Tableau Server logs folder. The Activity Log will make permissions auditing possible which is essential for implementing a robust book of controls on your Tableau environment.
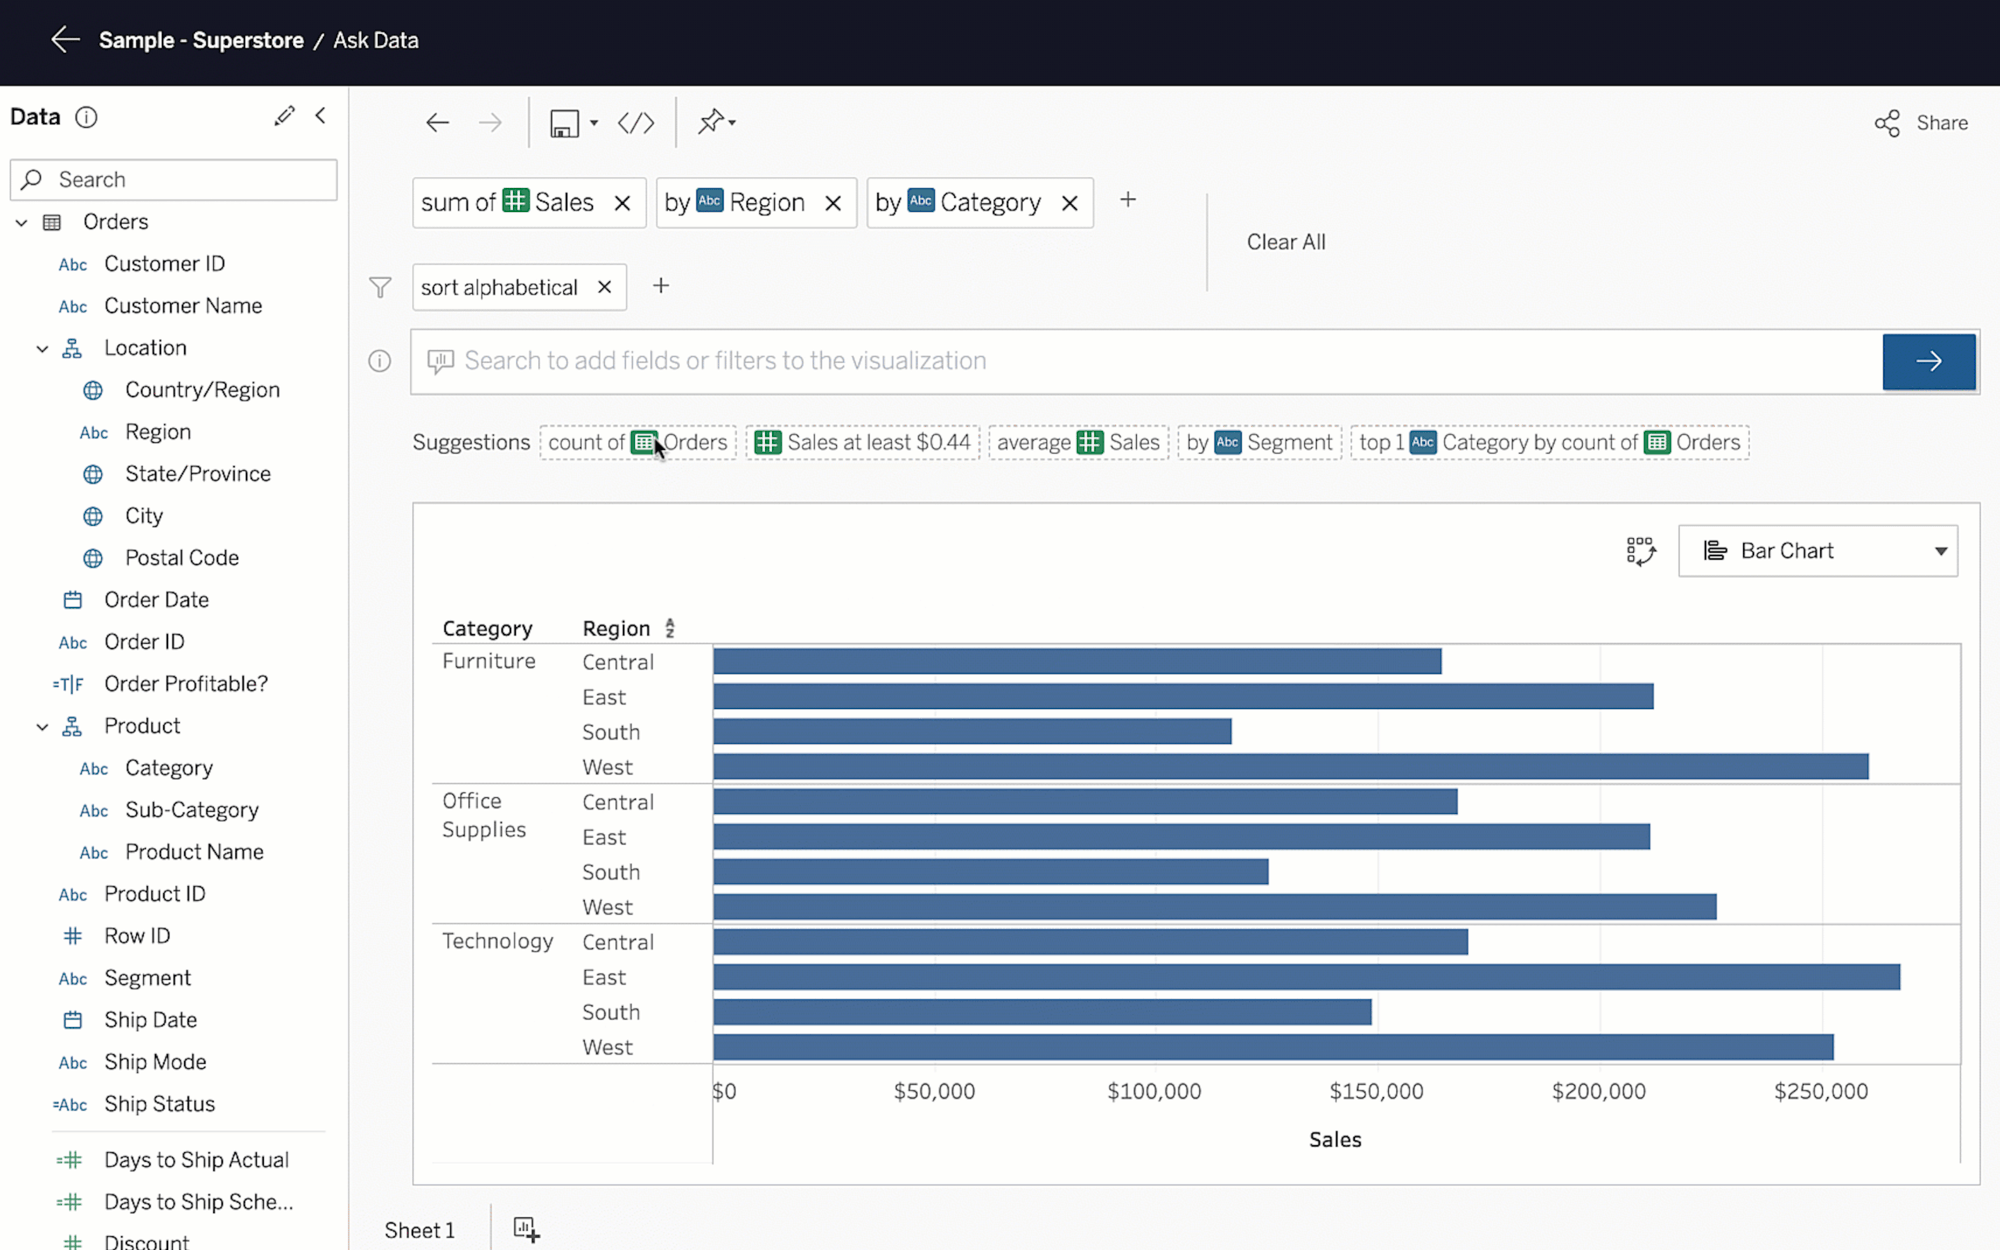
Ask Data phrase recommendations
Ask Data phrase recommendations make it even easier for business users to ask questions of their data using natural language. Powered by machine learning models, Ask Data intelligently recommends next steps to uncover insights in your data by suggesting new measures to add to your question or dimensions to group by or filter on. Selected recommendations automatically update the query sent to Ask Data and the visualised answer that is returned. More information here.
Modern sharing experience
Ensure members in your organisation are aware of and can access relevant content more quickly. Tableau checks if the people you shared content with have the proper permissions to view it. If you share with someone who does not have access, you will now be prompted to manage permissions and grant access immediately after sharing. More information here.
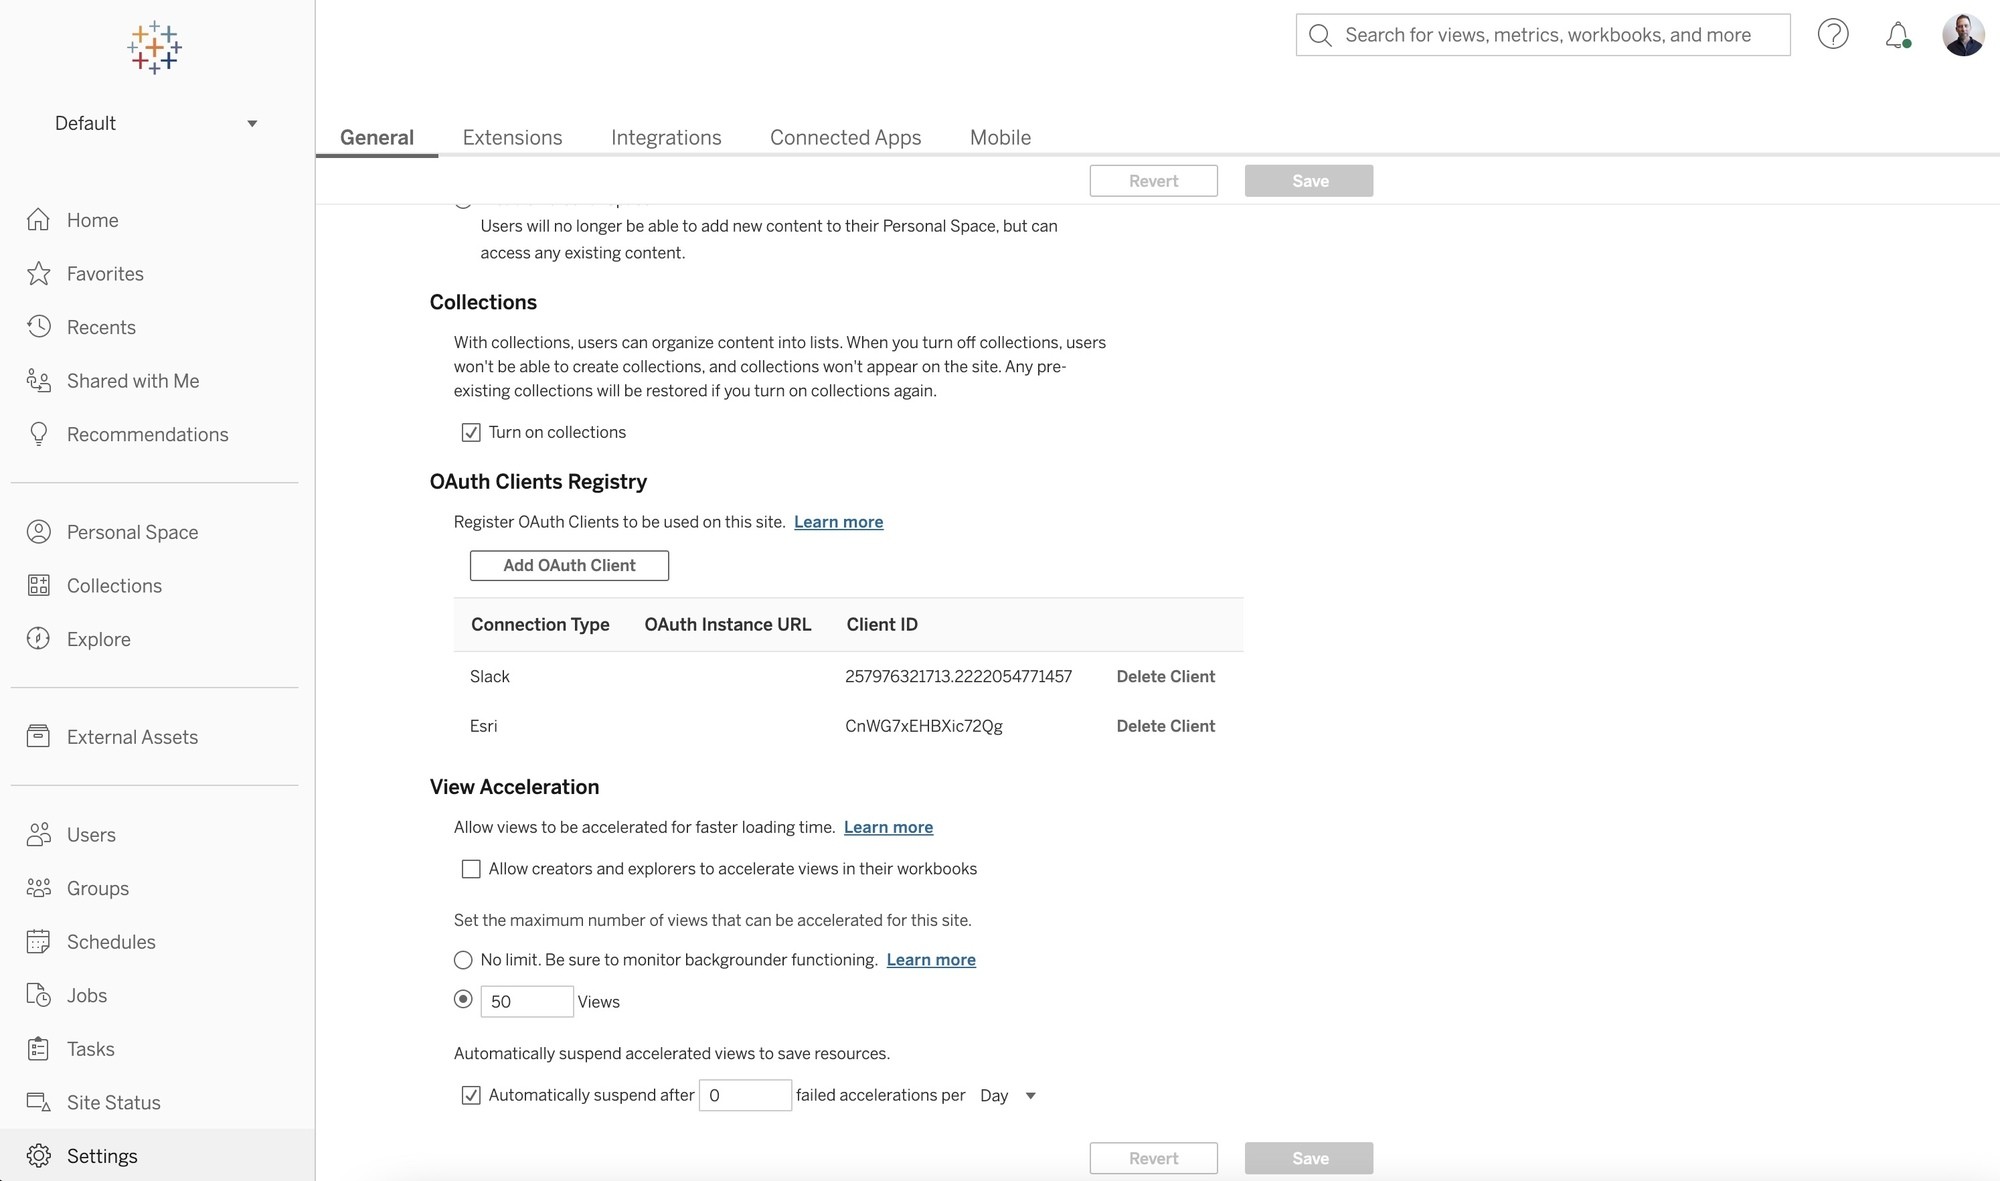
Collections site setting
Collections allow members across your organisation to gather and organise content from across your site on Tableau Cloud or Tableau Server. Admins can now enable or disable Collections for an entire site with a single click. Pre-existing Collections will be restored if you re-enable Collections. More information here.
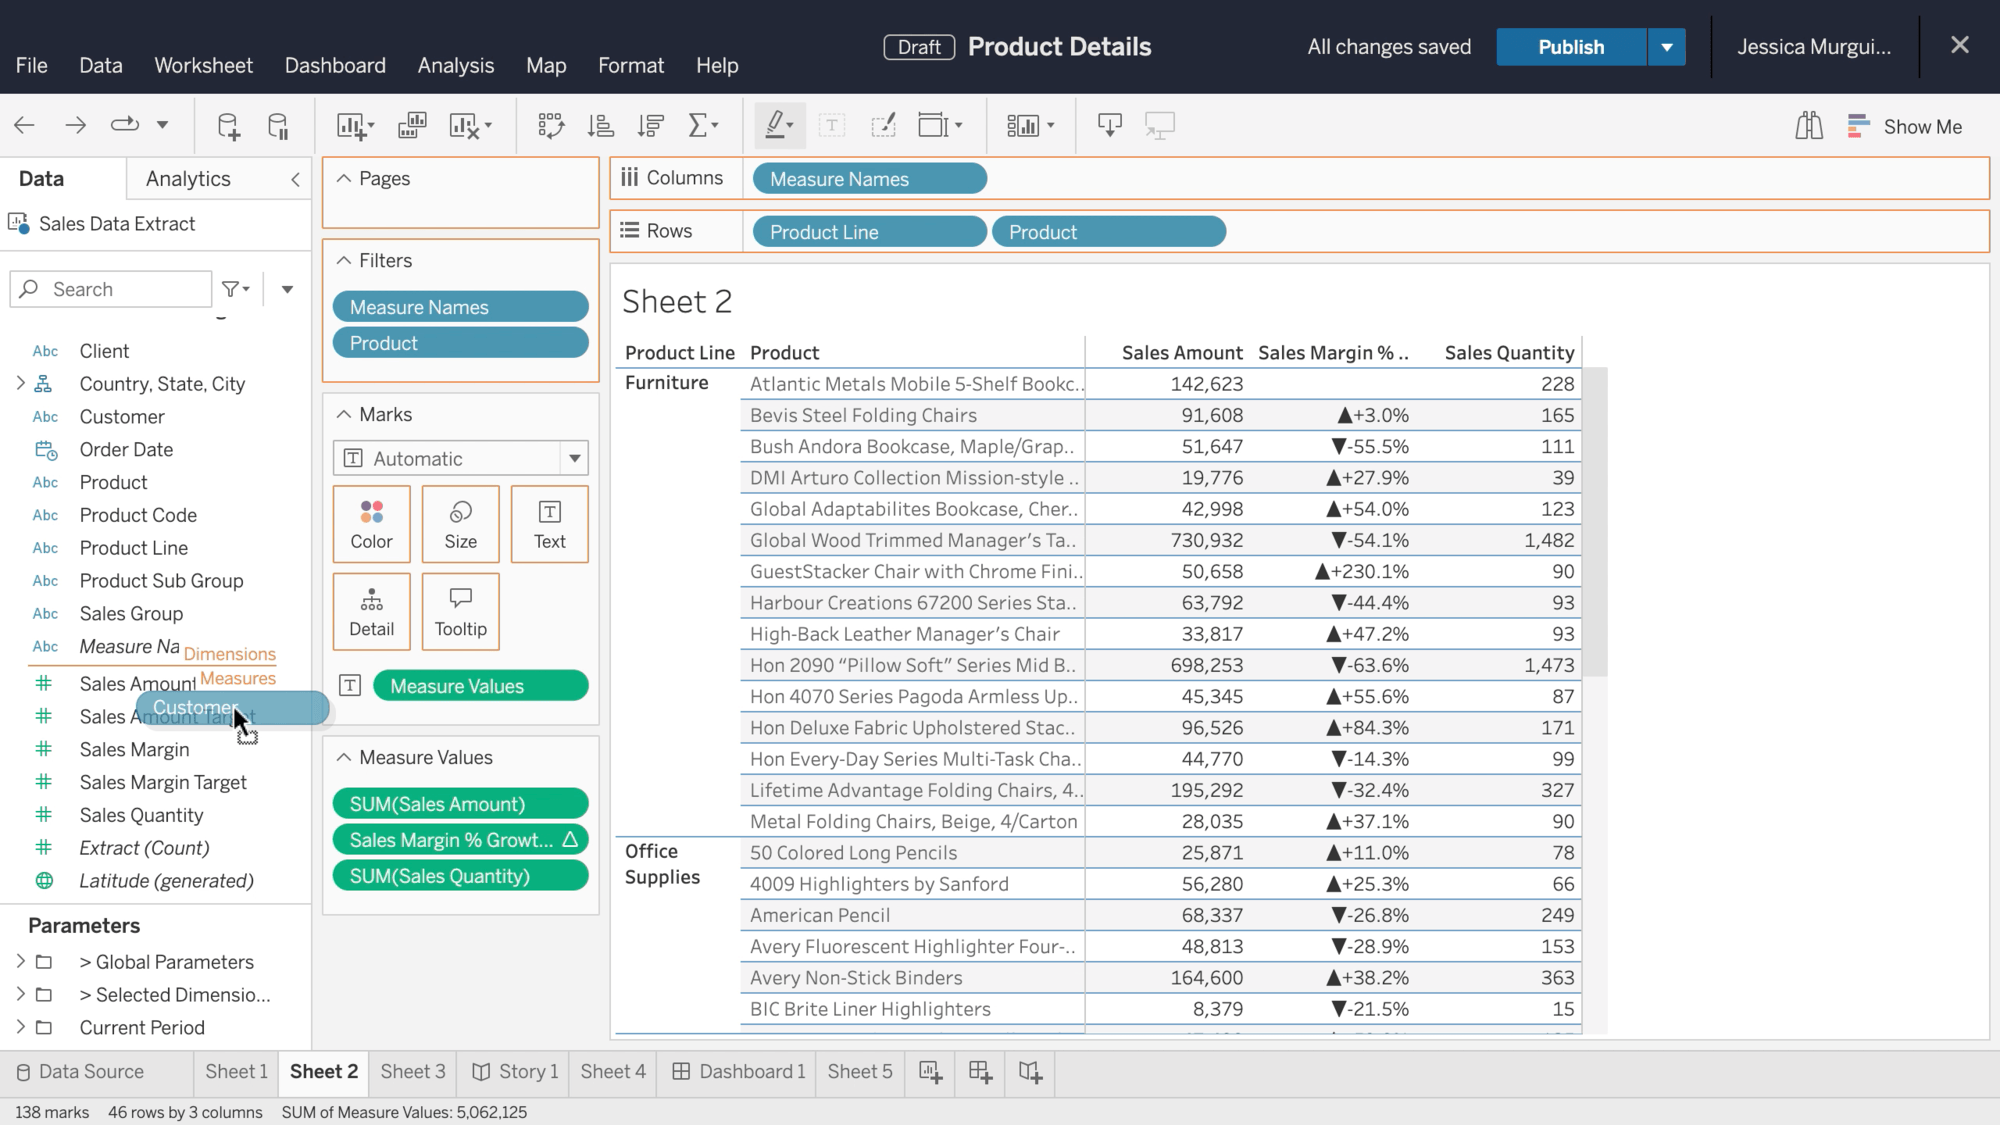
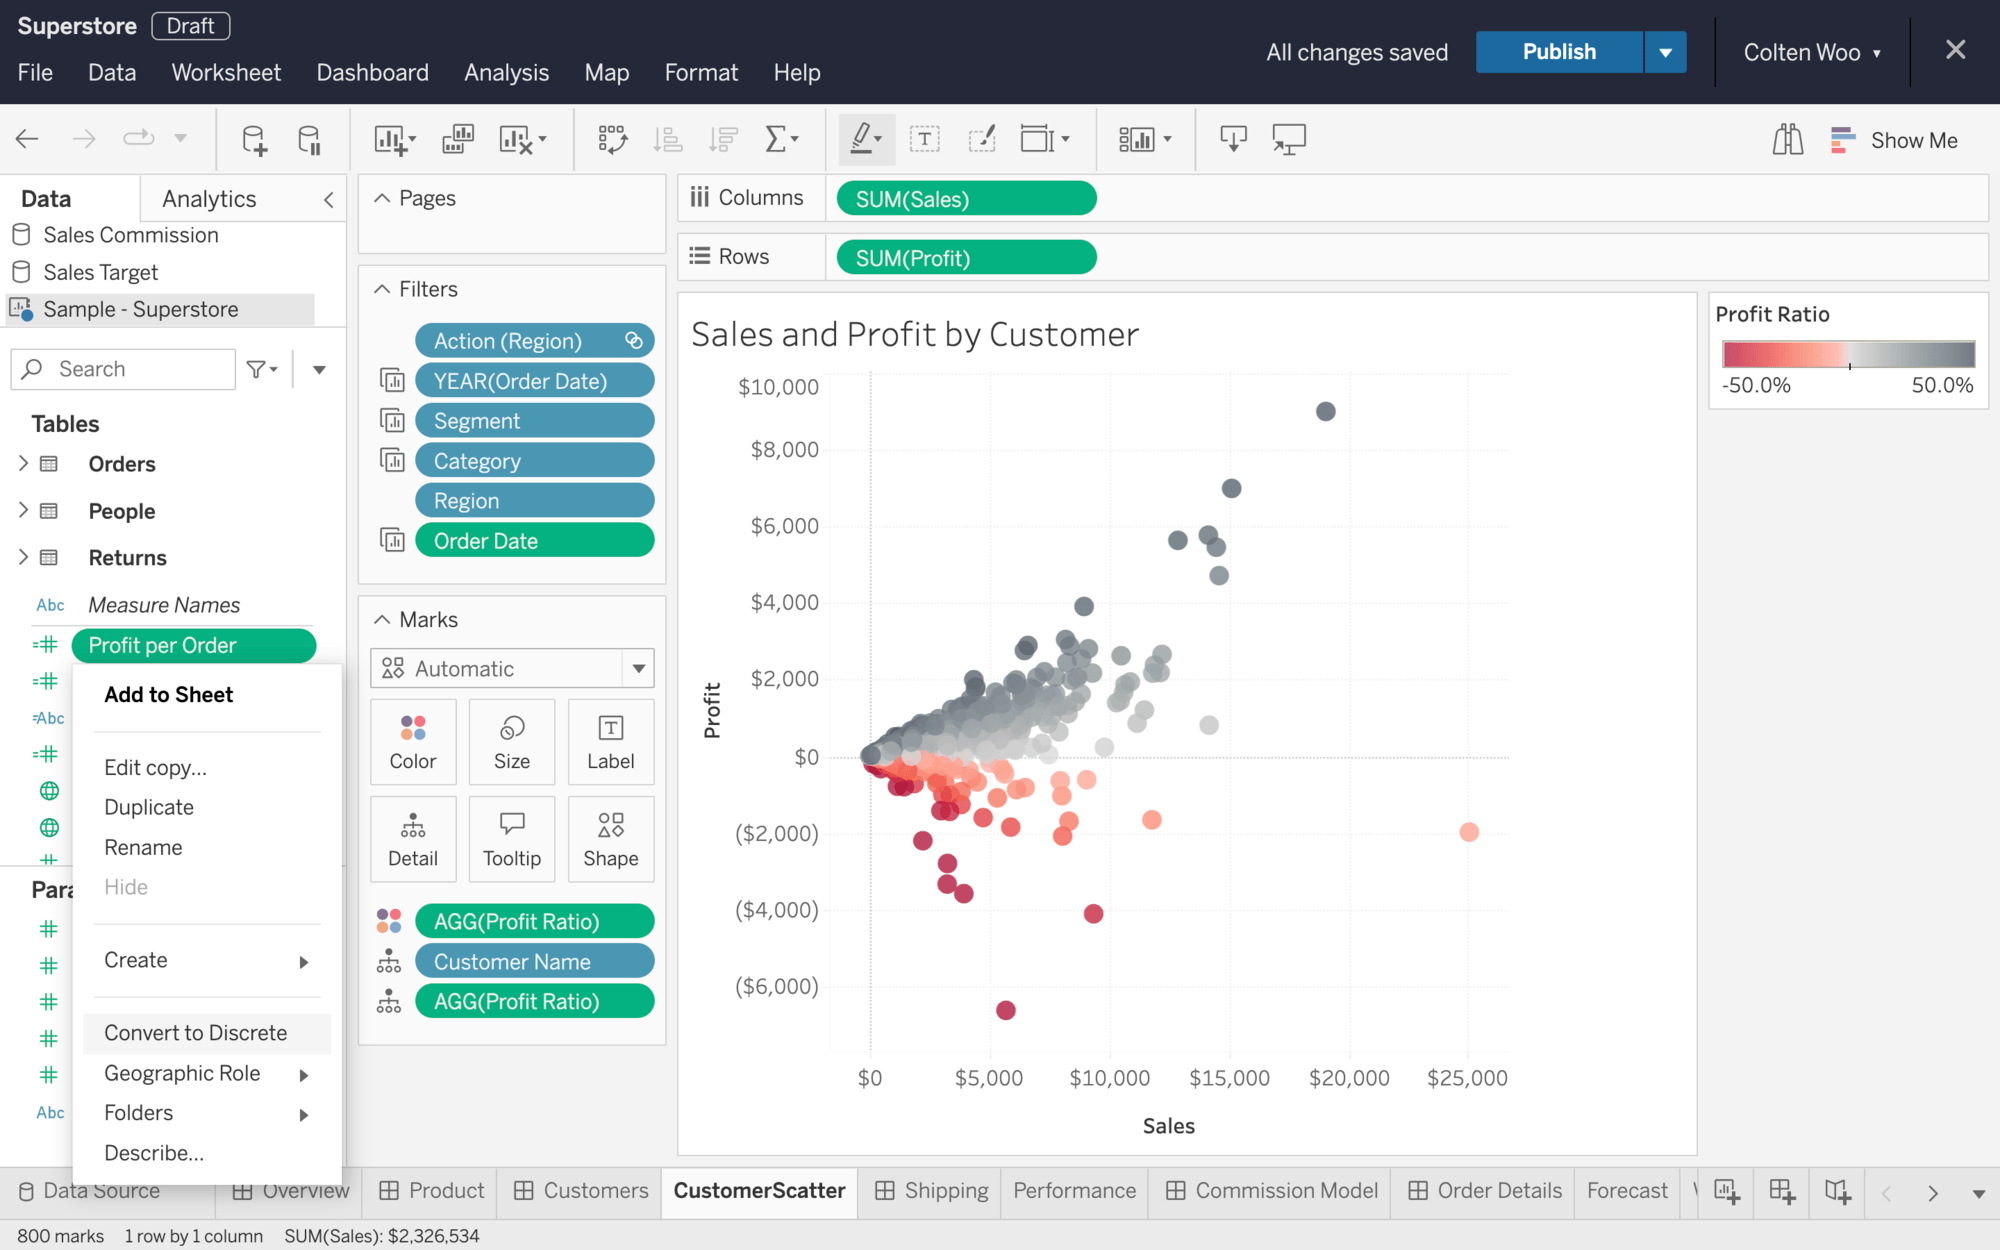
Copy dimensions as a measure
Get more flexibility when using a dimension as a measure within the same or different worksheet now with a quicker gesture. Simply drag a dimension over the dimension-measure separator using the modifier key (Windows: Ctrl, OSX: Cmd), and the dimension will be copied as a measure.
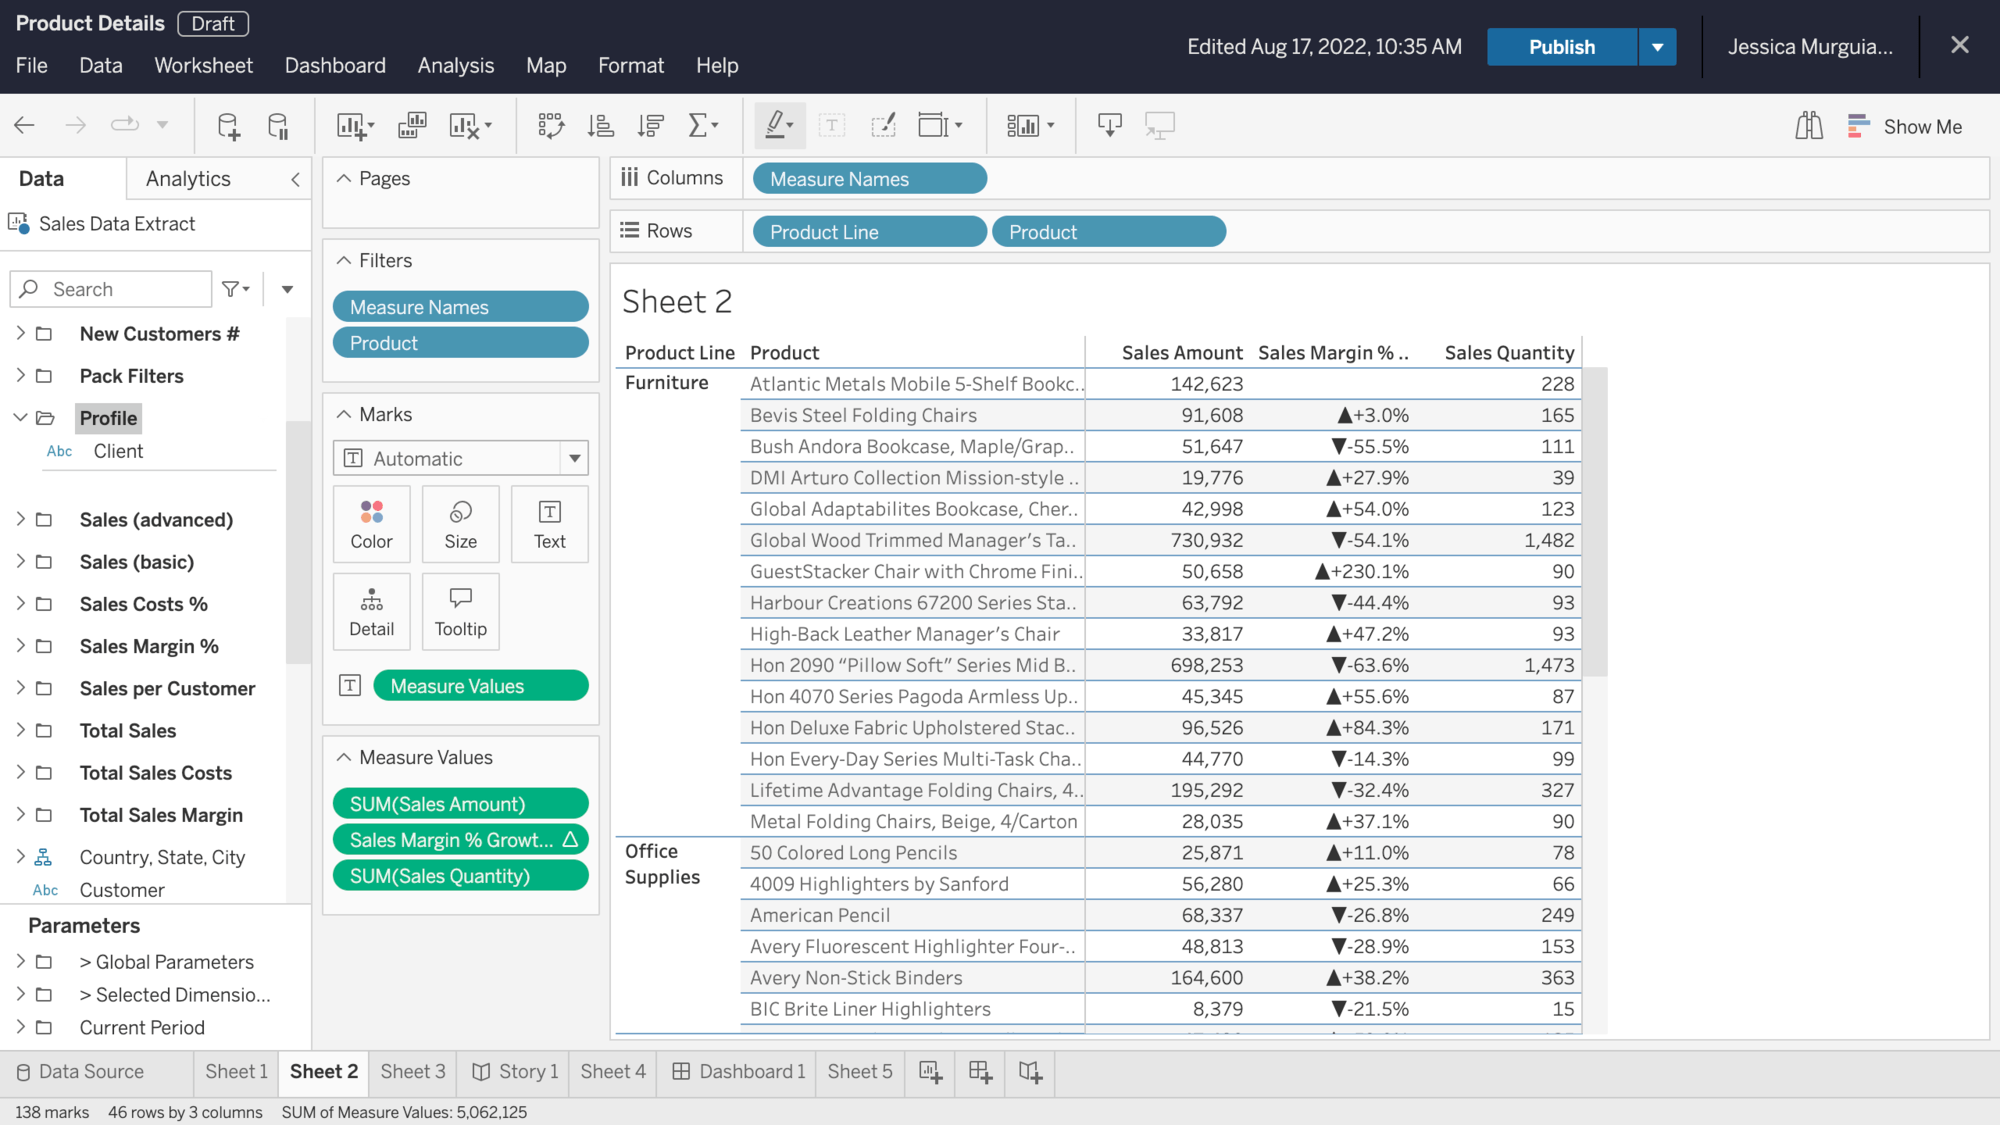
Data pane follows you
We’ve streamlined the experience for organising your data into hierarchies and folders. When you create a hierarchy or folder, the data pane automatically scrolls to the newly created hierarchy or folder position and selects it for you, so you can continue interacting with it without having to stop.
Change data type
You can now change the field data type through the data pane while authoring on the web. This ensures your data is analysed correctly. The experience is the same as it is with Tableau Desktop: click the icon to the left of the field name and choose a new data type from the drop-down list. More information here.
Formatting enhancements
Web authors now can format the borders and dividers of total and subtotal cells within a table to select their preferred style. To improve the user experience, a dynamic display shows users the curated formatting settings that only apply to the visualisation type and selected cells – giving a clear path of which formatting options you can change.
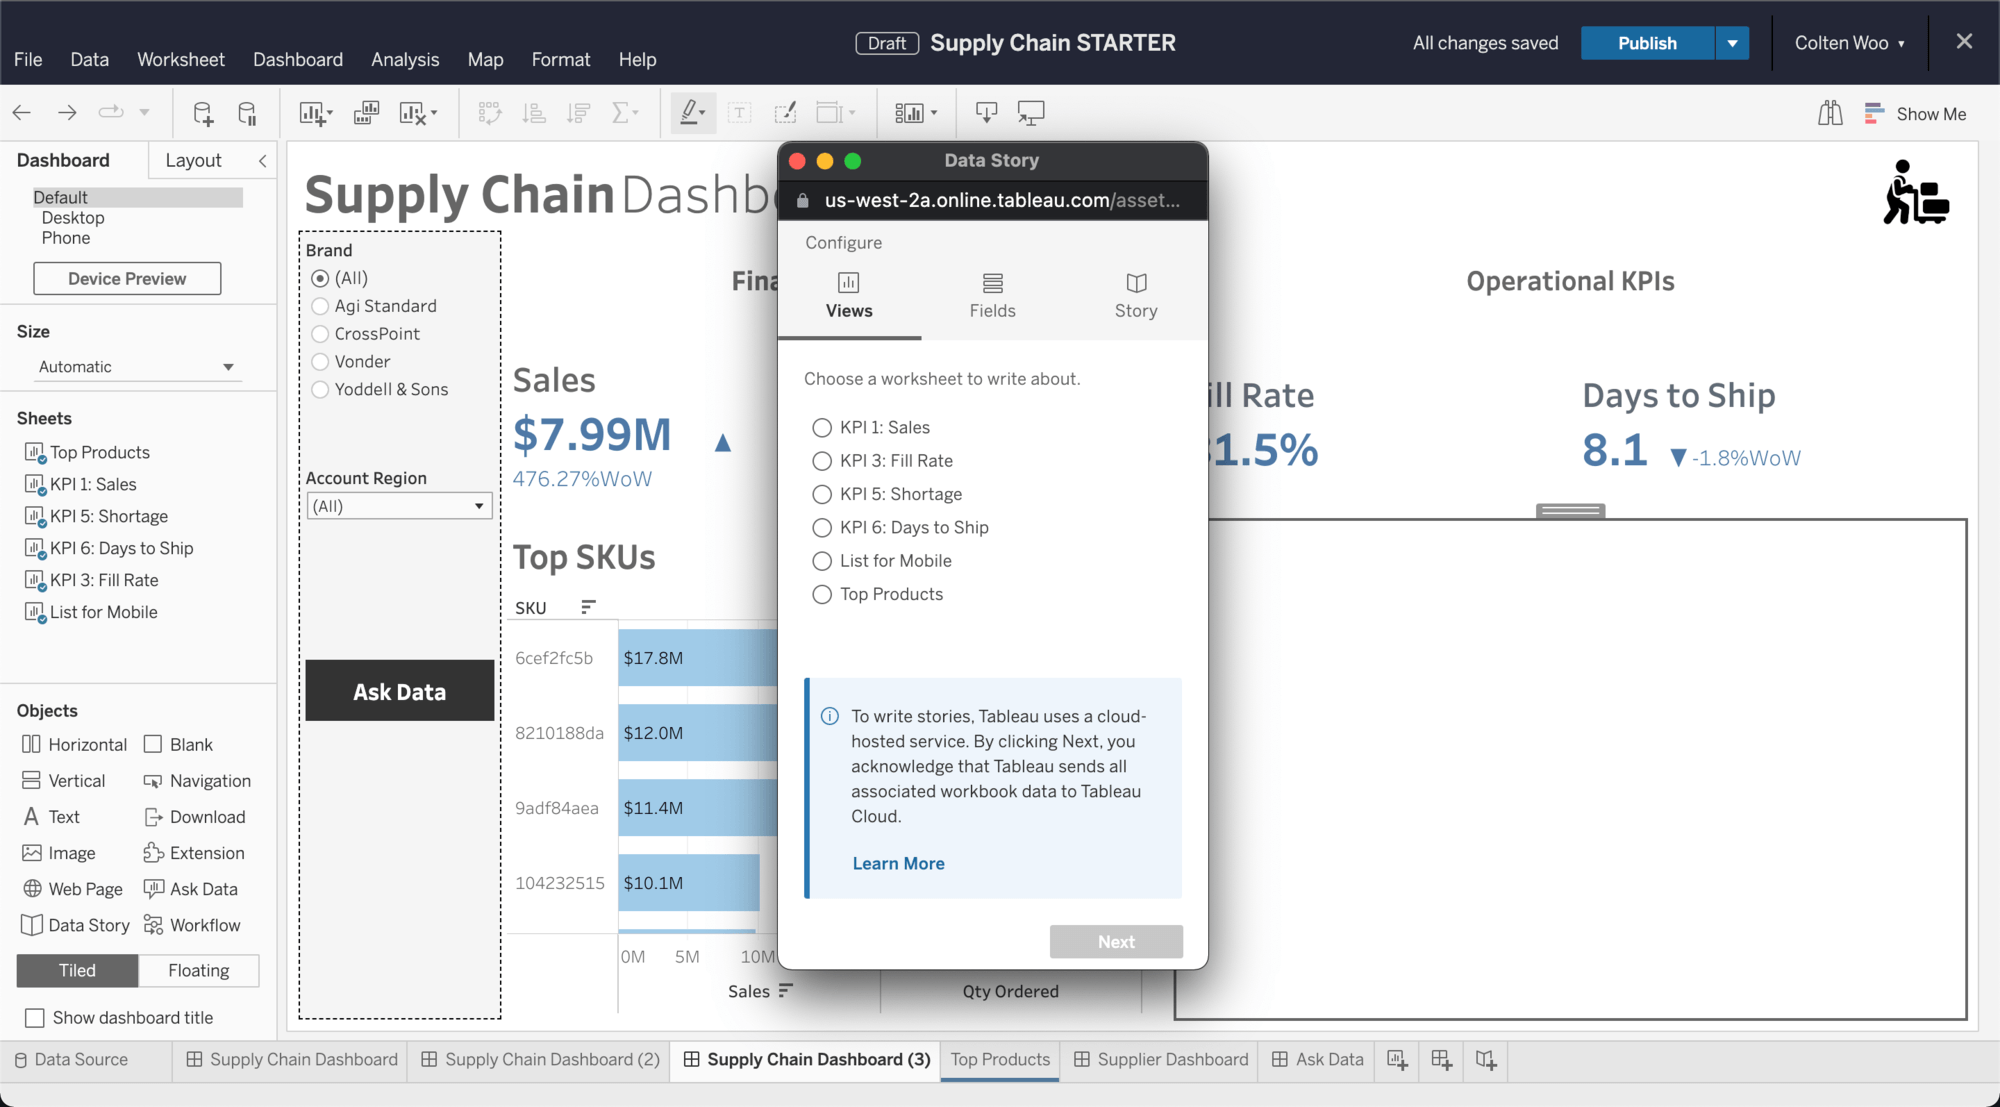
Data Stories on all data sources
You can now add automated plain-language summaries to dashboards using Data Stories on any data source. When setting up Data Stories, you will be notified that your data is sent to a cloud-hosted service. If you’d instead like to restrict use of Data Stories, administrators can disable this feature for all users through site settings. More information here.
Email and Slack notifications for Explain Data
Now you can quickly share insights from Explain Data through Slack and email. Recipients are notified on Slack with an image and description of the explanation and can click a link to open the explanation in Tableau.
Embedding API v3.3
Embedding API v3.3 delivers the full power of embedding analytics with support for custom views, viz resizing, story points and much more. Check out our developer preview for a complete list of features.
Personalised search results
The Tableau search experience continues to improve! Search now incorporates signals about your content preferences and personal viewing habits. These signals include the content that you have viewed in the past*, content that you have favourited and views that are recommended to you. Trust that the content relevant to you is at the top of your search results with the all-new personalised search.
*in 2022.3, this is only supported for views, workbooks, metrics and flows
Resource Monitoring Tool SMTP TLS improvement
Configuring an SMTP server connection with the Resource Monitoring Tool (RMT) is now easier with additional flexibility to disable, prefer or require encryption. These options align more closely with those of Tableau Server, are easy to understand and provide support for different SMTP configurations. More information here.
Resource Monitoring Tool external services support
Advanced Management for Tableau Server customers leveraging the Resource Monitoring Tool can now choose to run the PostgreSQL and RabbitMQ services that support the Resource Monitoring Tool Server externally in AWS utilising PostgreSQL via AWS RDS and RabbitMQ via AWS AMQ. Running these two services in an external configuration frees up local resources needed for data processing and improves the Resource Monitoring Tool’s ability to scale for your environment. More information here.
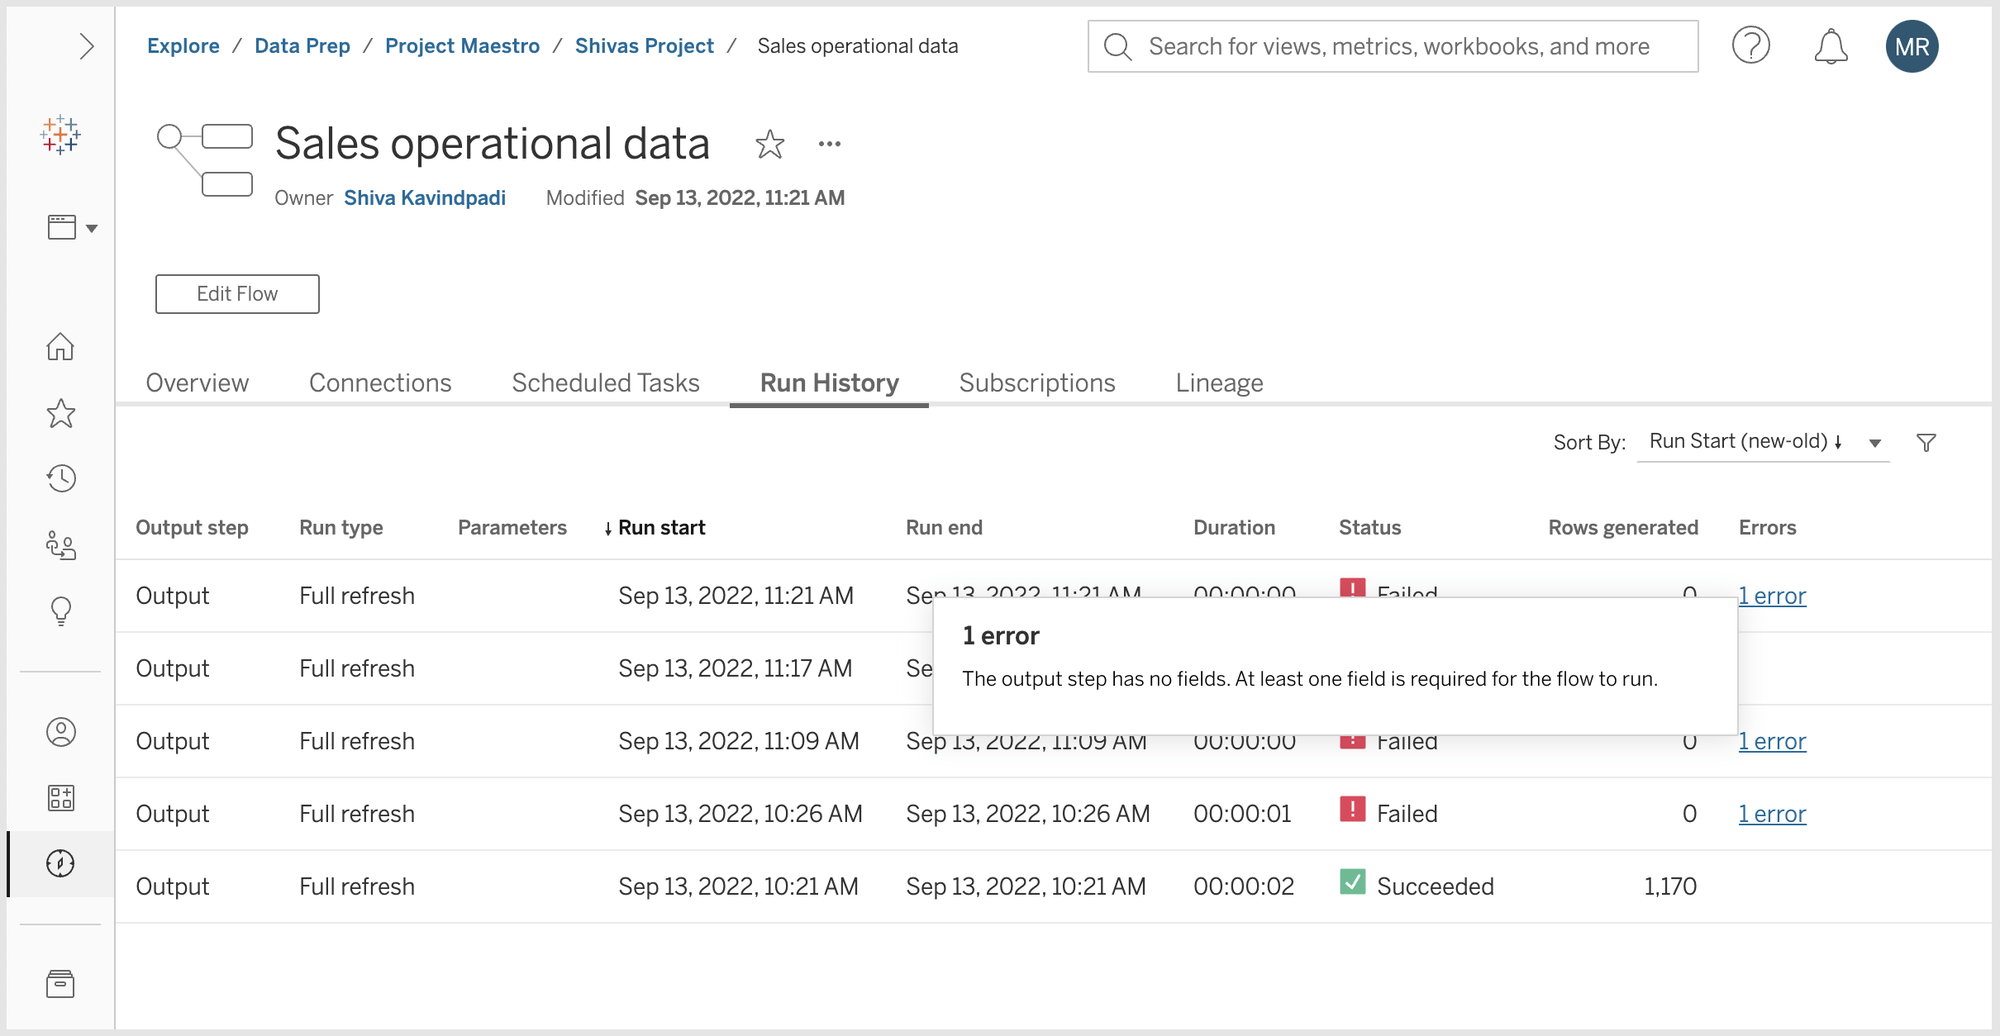
Improved Tableau Prep Conductor error messages
To help you troubleshoot flow run failures with Tableau Prep Conductor, we’ve added over 400 error codes and improved error messaging to provide clarity on root causes and troubleshooting steps.
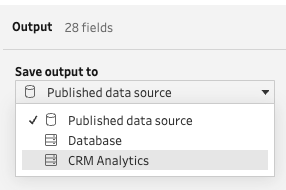
Write to CRM Analytics with Tableau Prep
After using Tableau Prep to clean, shape, and combine data, you can now write your flow output to CRM Analytics. This new capability, available in both Tableau Prep Builder and Tableau Prep on the web, lets you combine the ease of cleaning and shaping data in Tableau Prep with CRM Analytics to enable your Salesforce CRM users with actionable insights and AI-driven analytics right in their workflow. More information here.
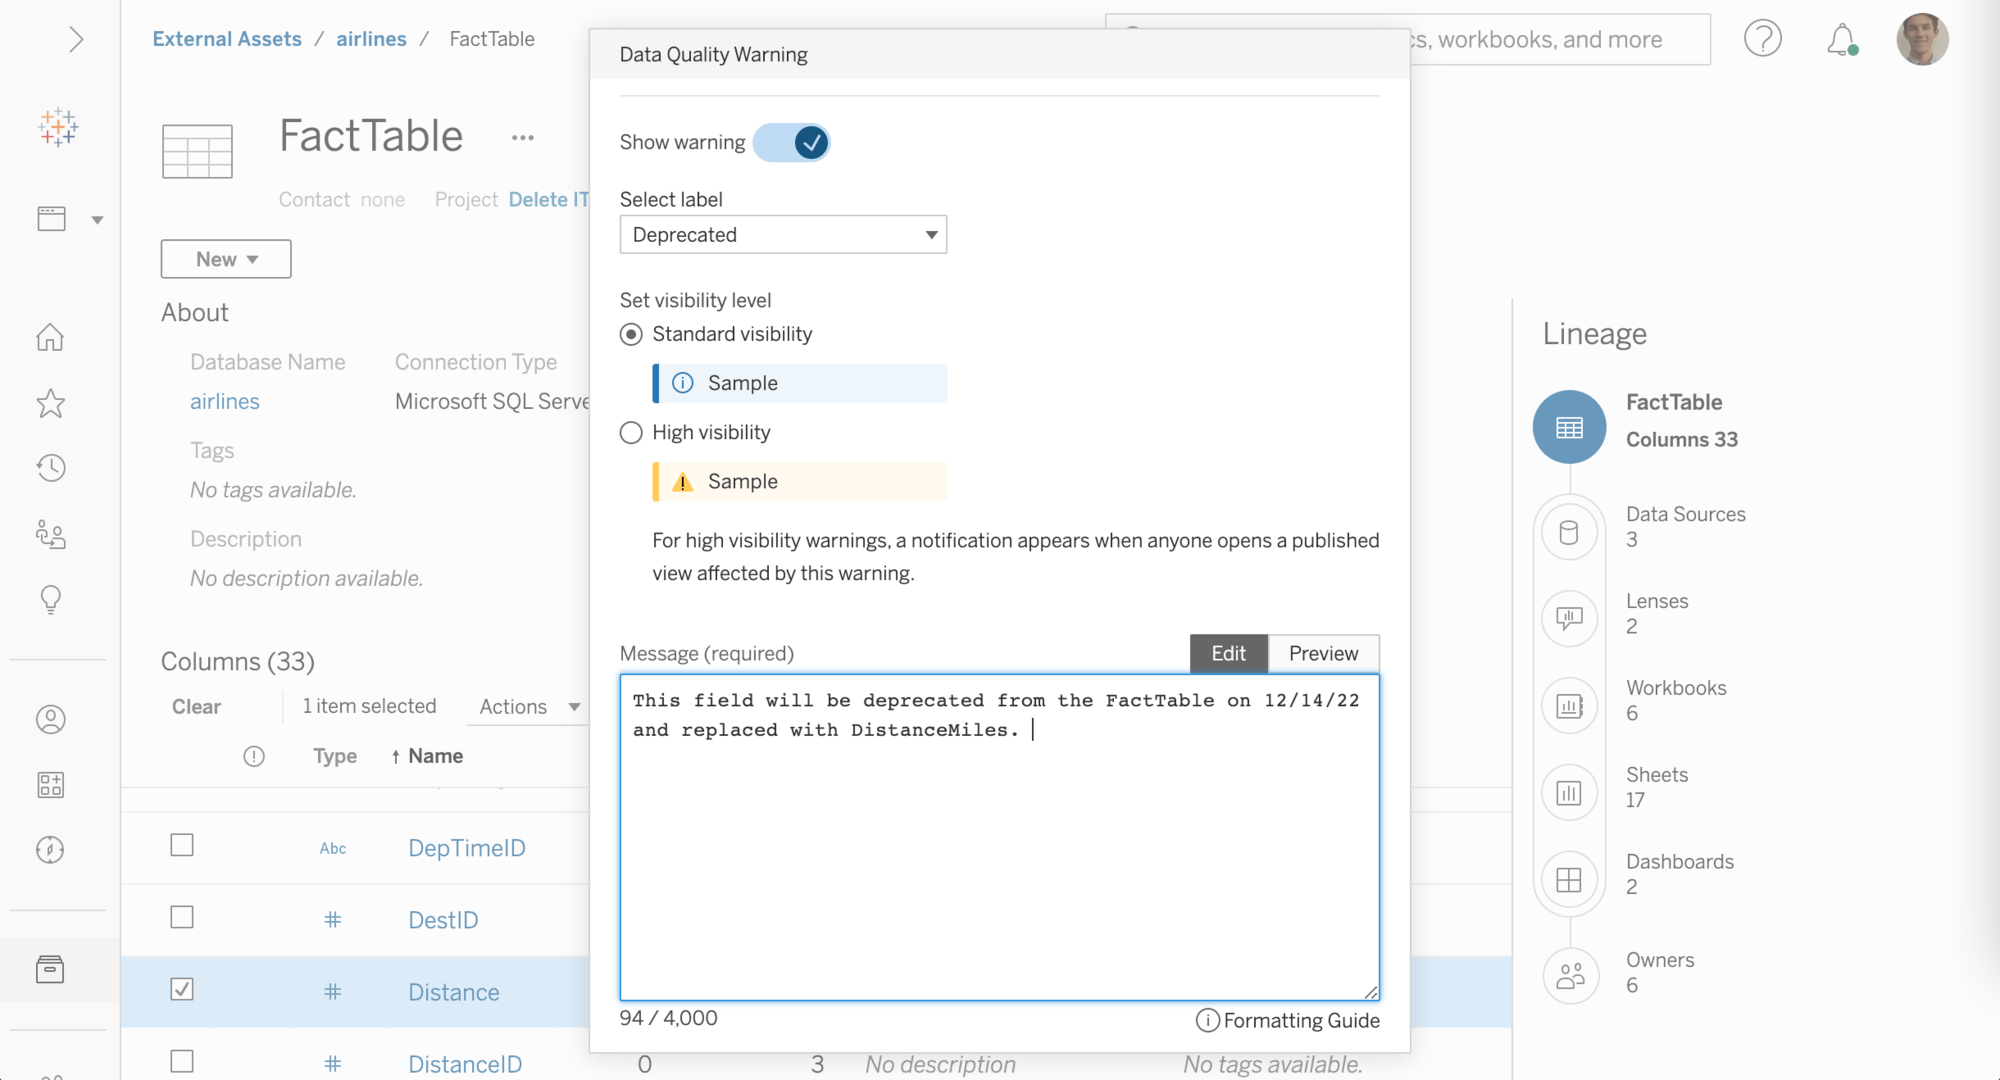
Column-level data quality warnings
Data quality warnings can now be applied at the column level. Data quality warnings allow you to mark columns that are deprecated or stale, and those that may be displaying incorrect values. When a data quality warning is configured, you can enable a high-visibility warning across downstream assets to inform users of potential issues with the underlying data. More information here.
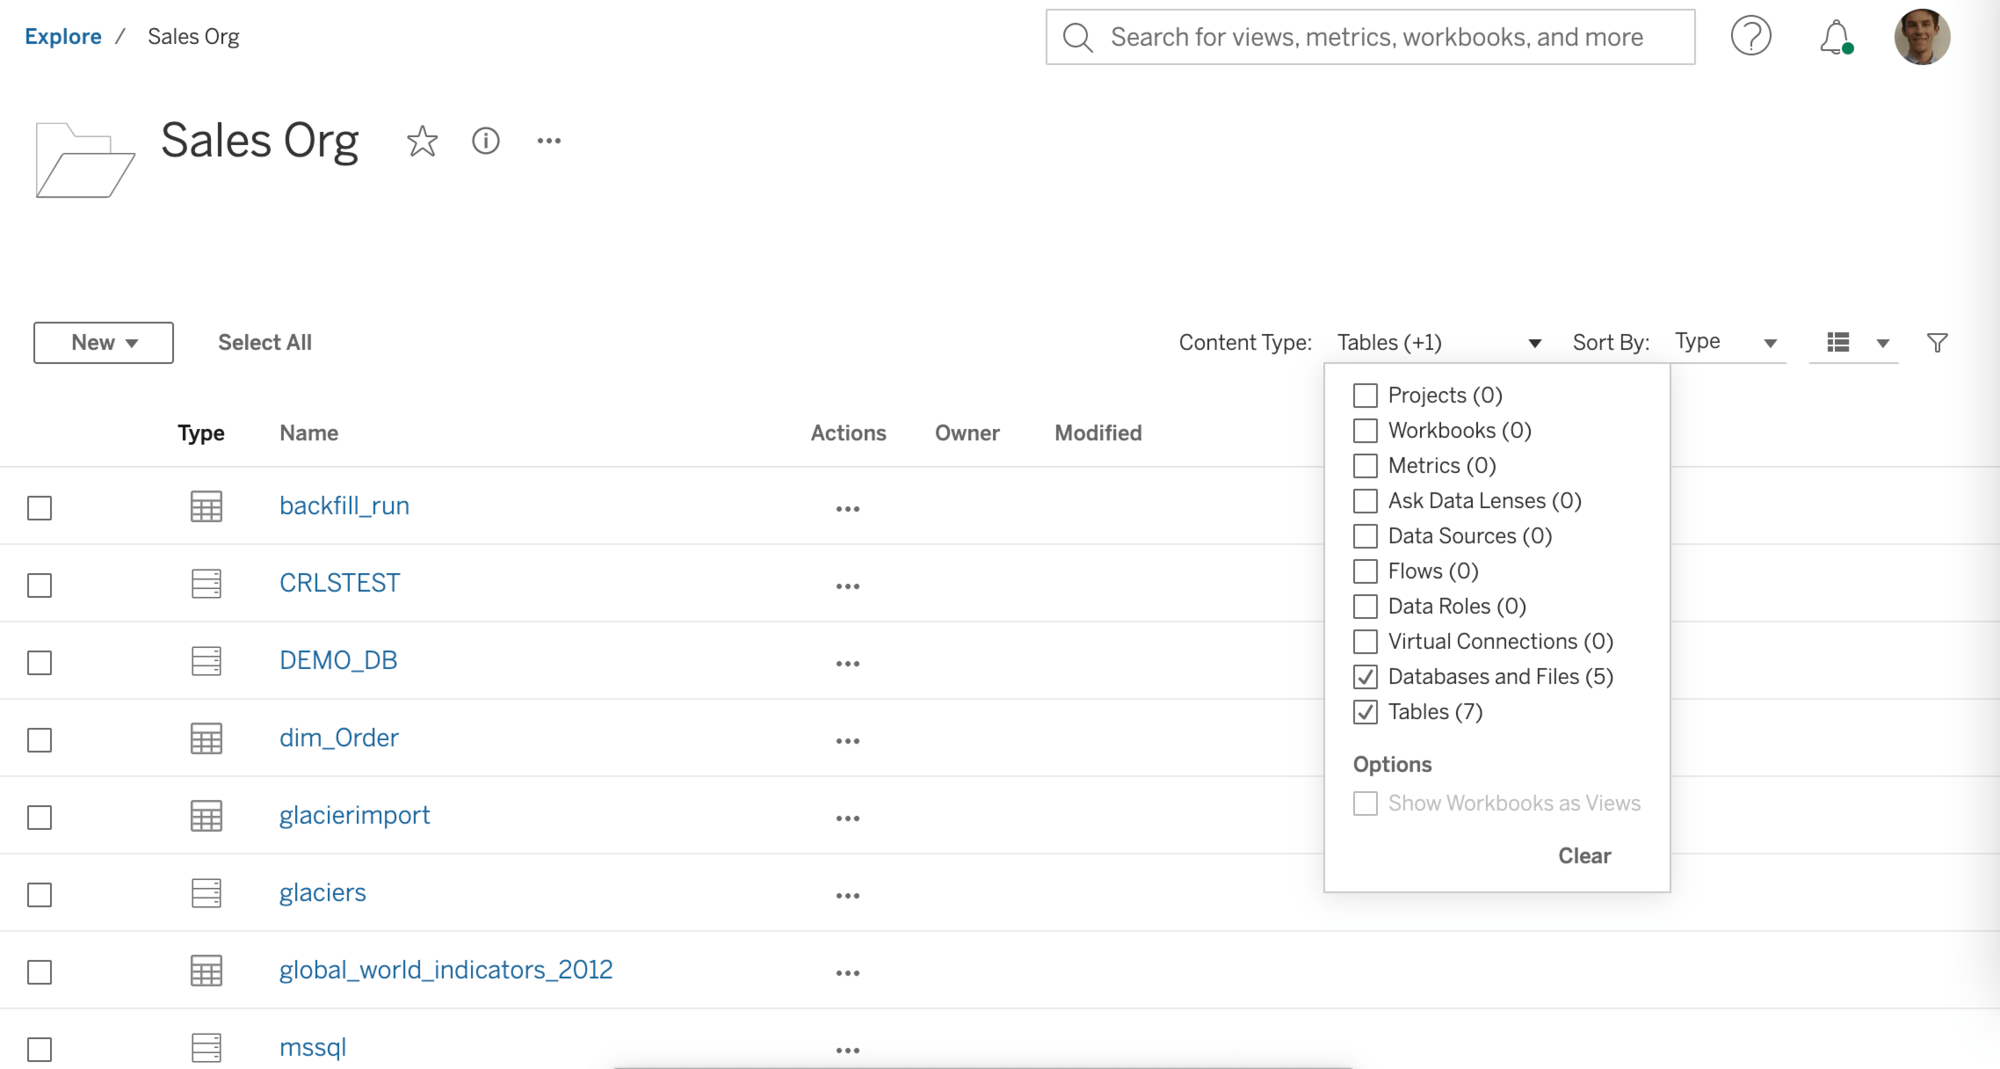
External assets permissions improvement
External assets can now be moved into projects. This change democratises metadata curation by utilising existing project permissions to allow more users to manage descriptions and data quality warnings. This removes site admins as a potential bottleneck and gives metadata ownership to users who know the data best. Additionally, this makes external assets more discoverable for content creators. More information here.
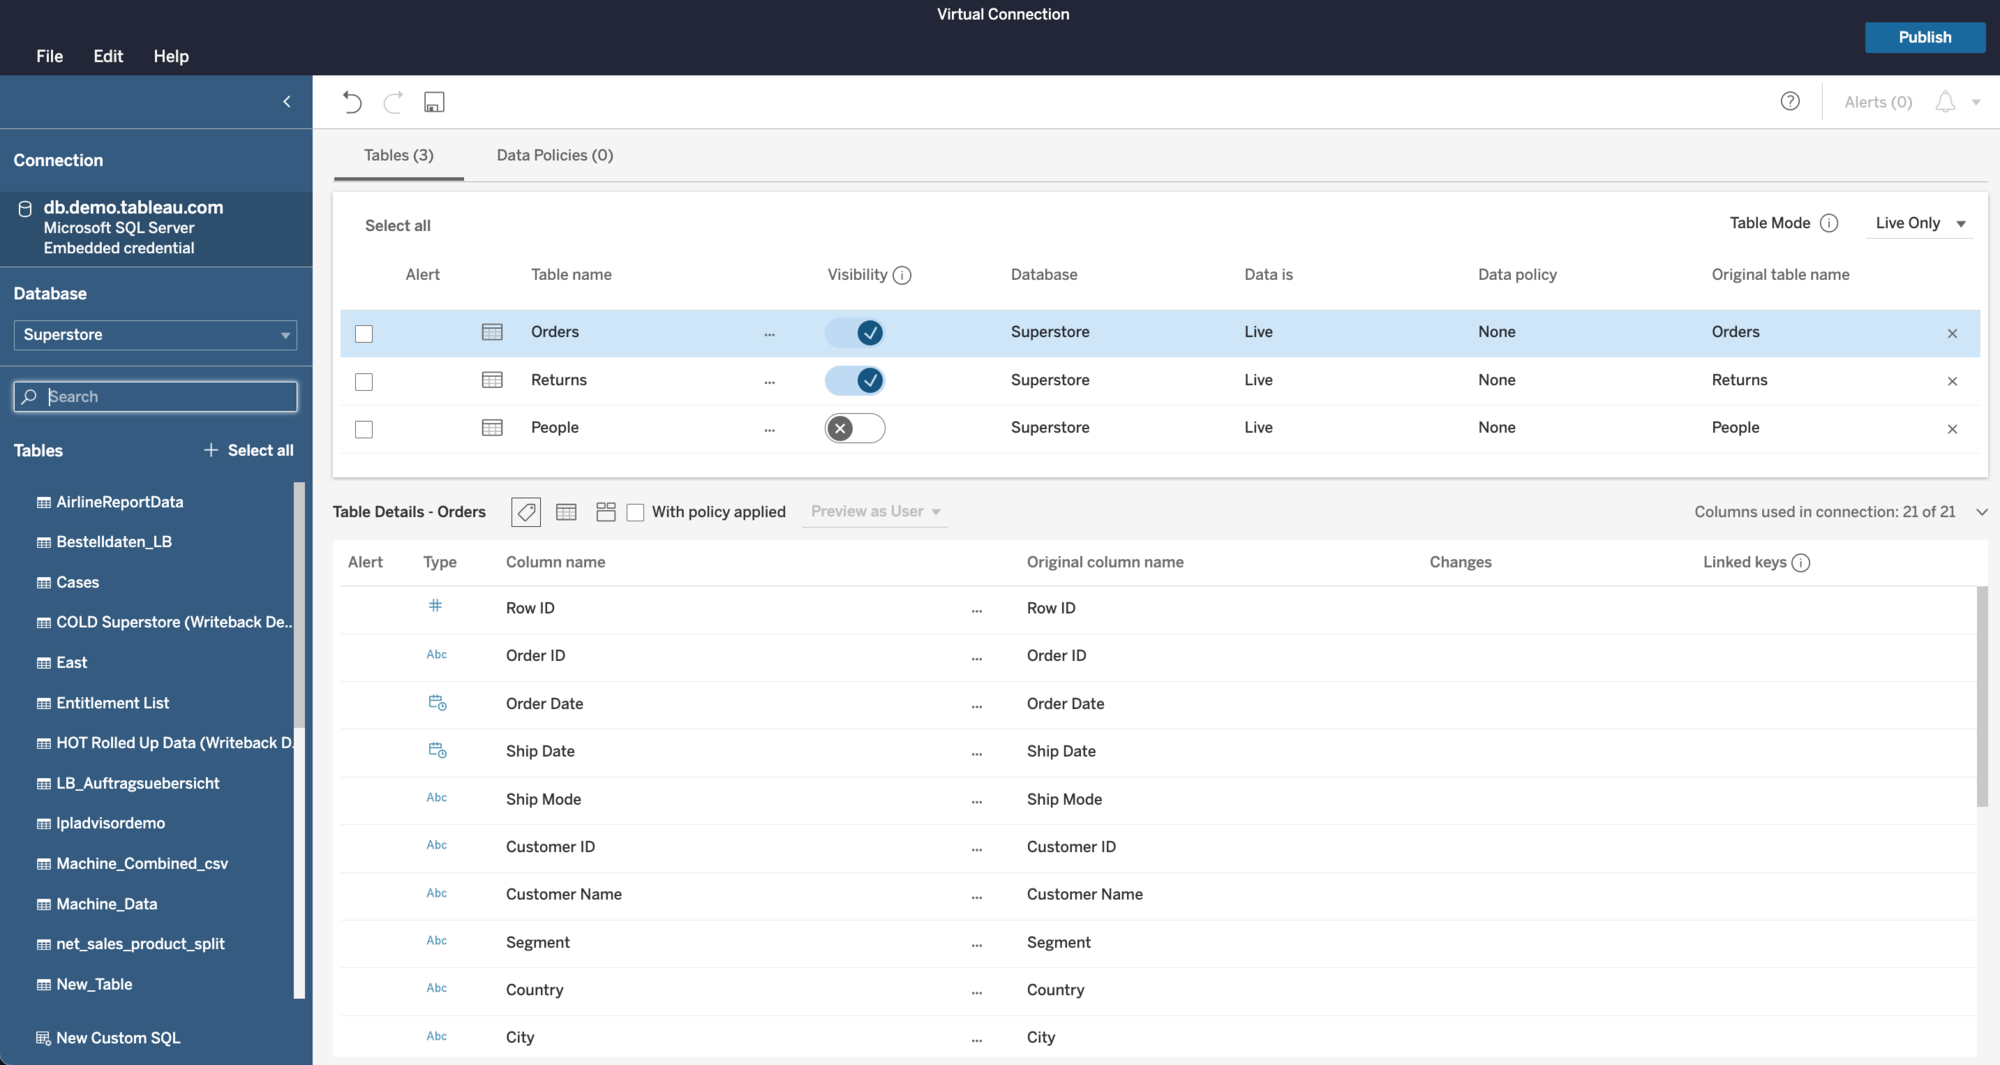
Down-stream feature compatibility
Users can now configure subscriptions, alerts, metrics, and thumbnail generation for assets that leverage data sources created from Virtual Connections.
Extract encryption
Tableau Server customers can choose to force extract encryption at the site or server level, similar to extracts not contained within a Virtual Connection.
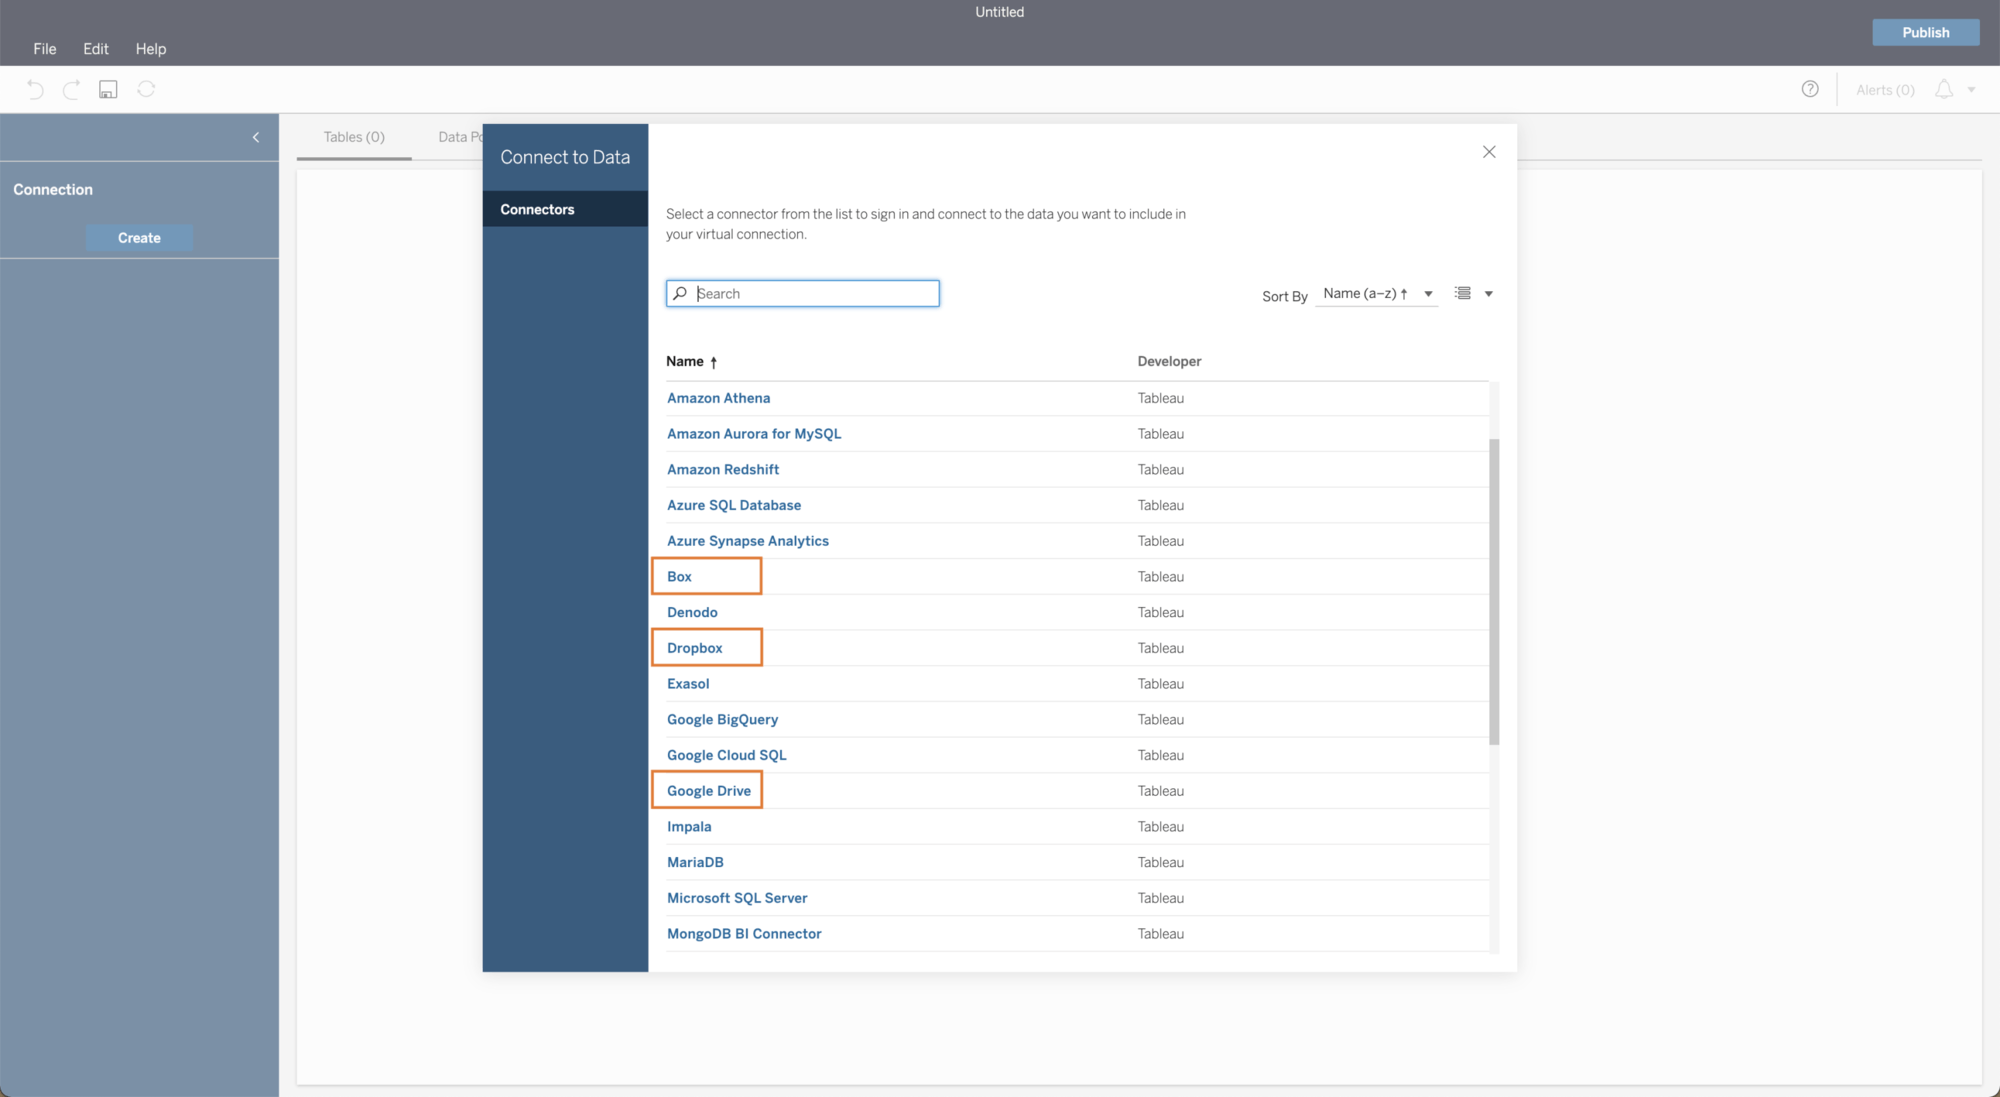
Cloud-based file connectors for Virtual Connections
Virtual Connections can now connect to files stored in Box, Dropbox, Google Drive and Microsoft Azure Data Lake Storage Gen 2.
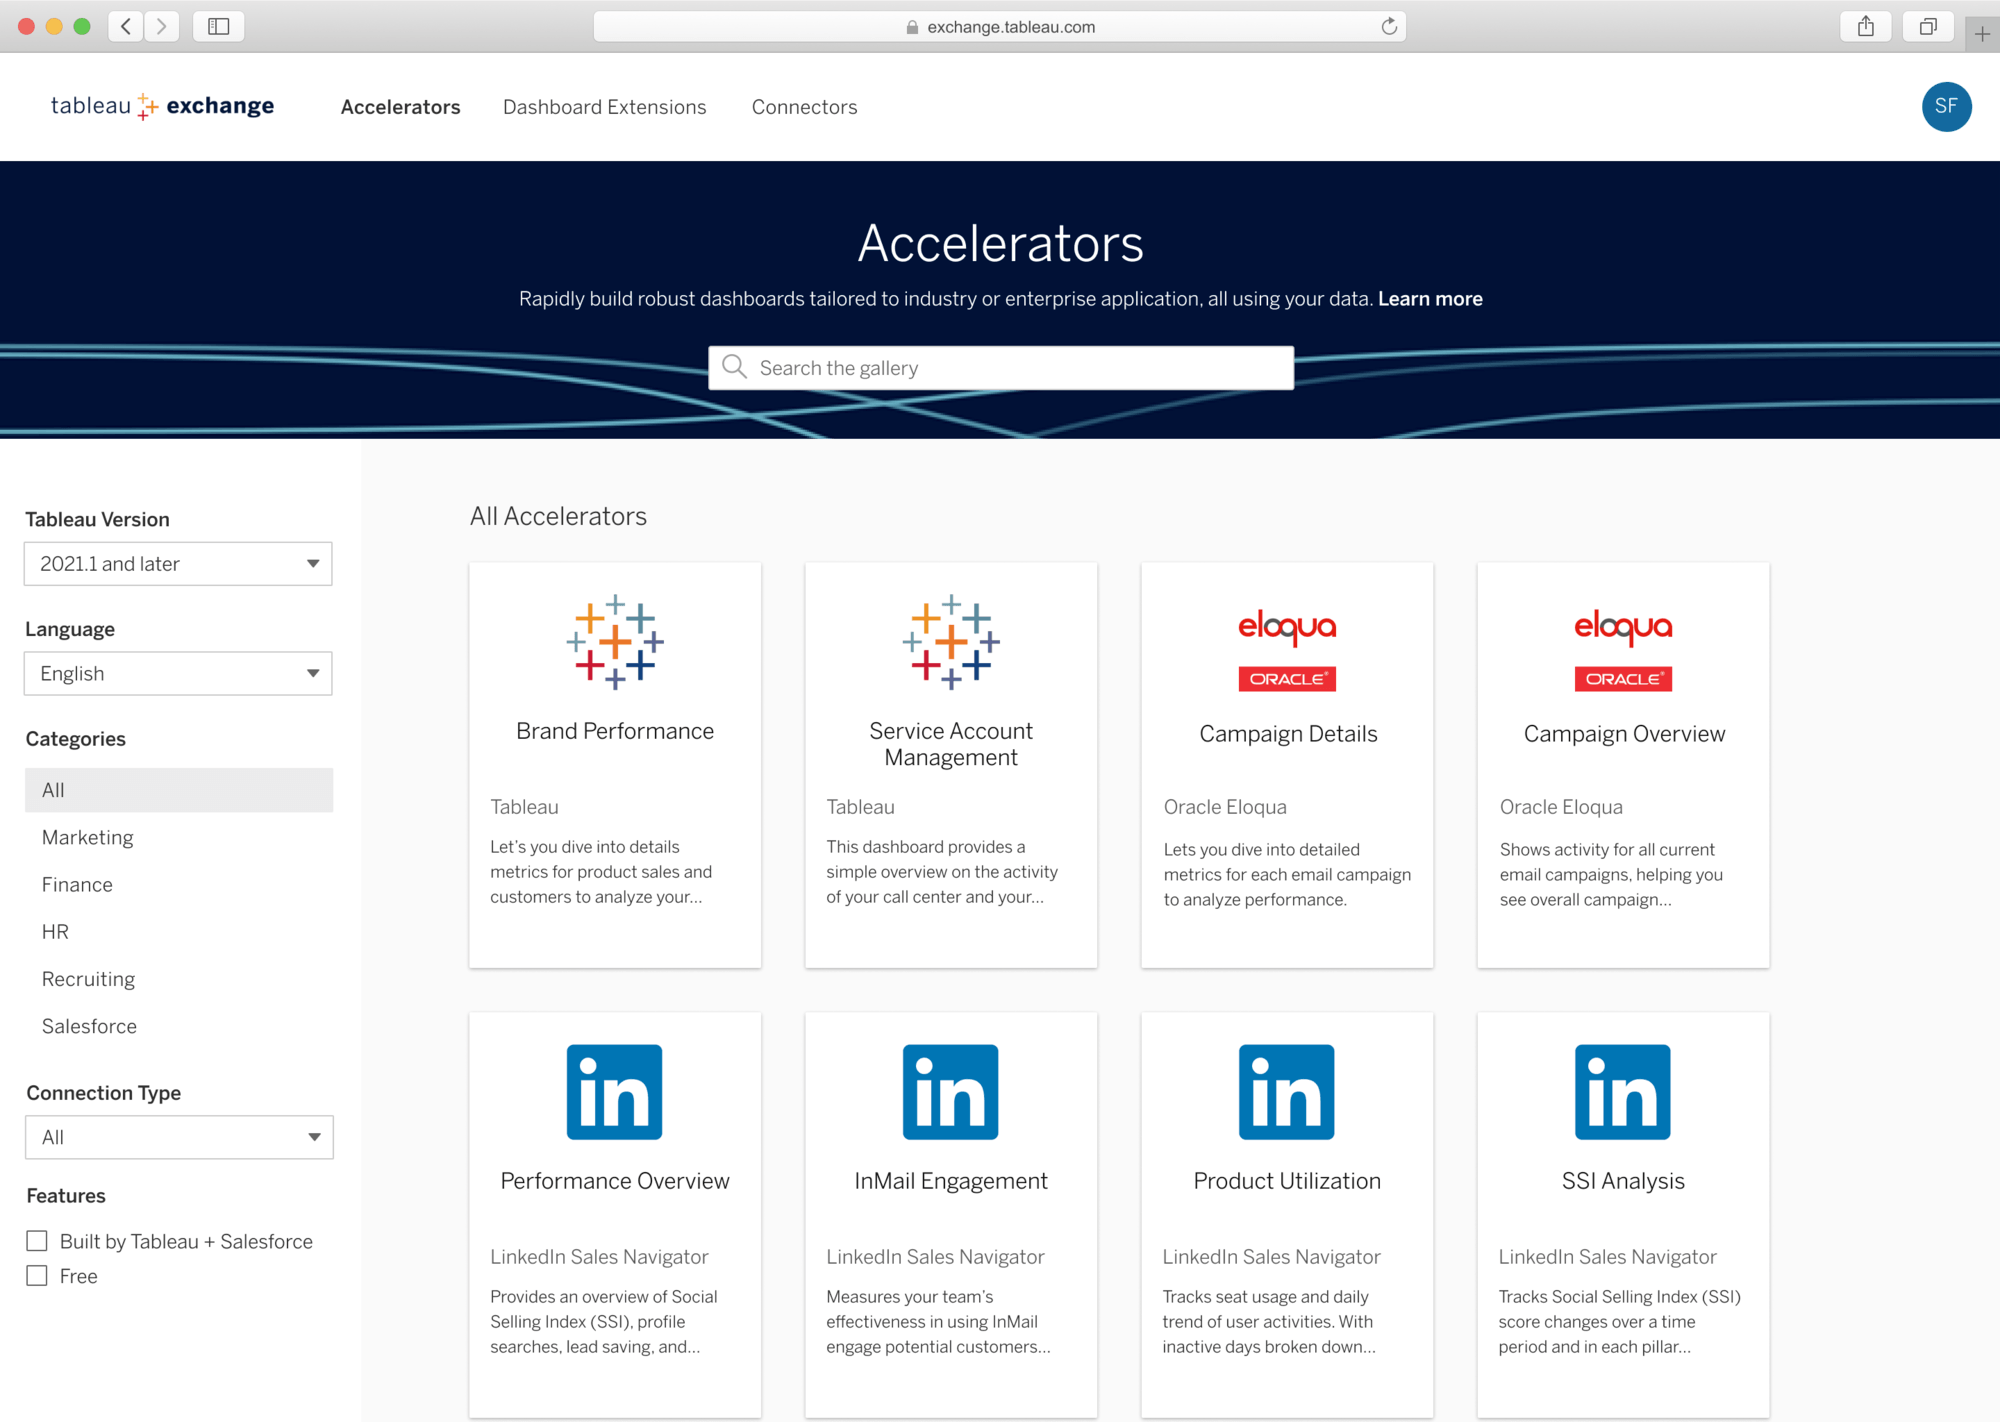
New accelerators on Tableau Exchange
We've released a number of new Accelerators built by Tableau + Salesforce and partners. Here are some of the highlights!
New Accelerators:
Major upgrades:
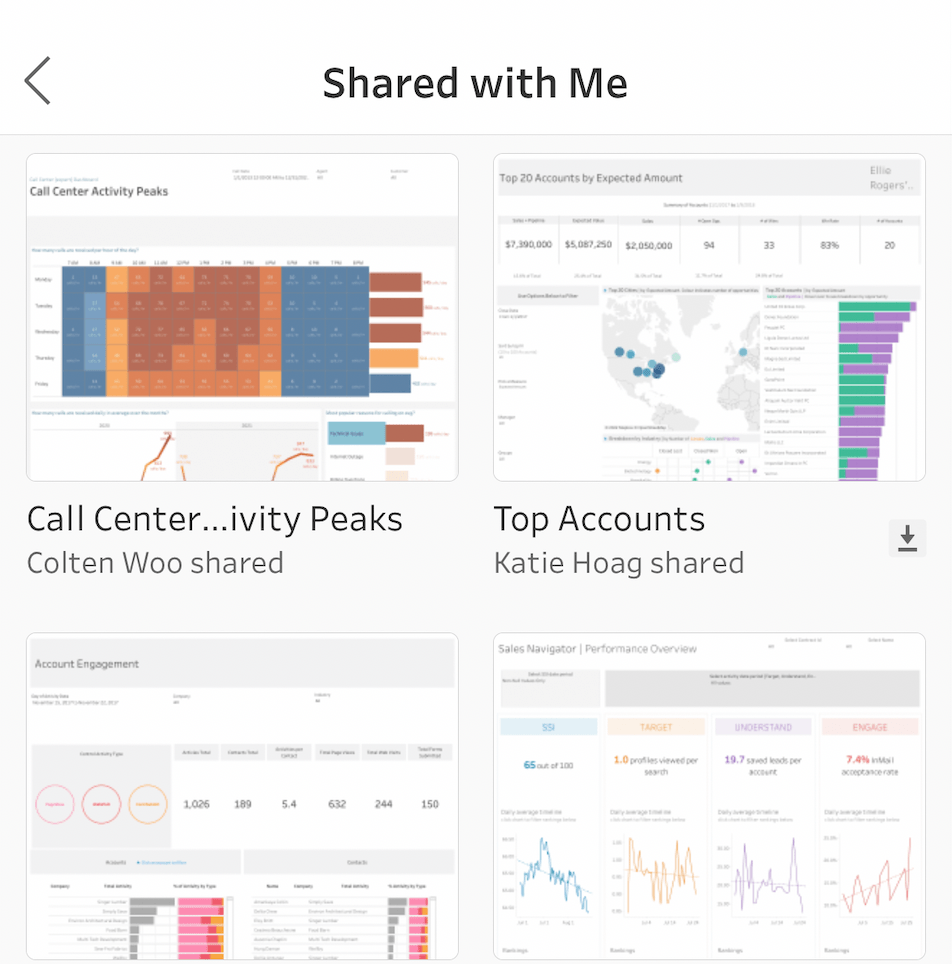
Improved sharing in Tableau Mobile
You can now share content with other Tableau users in Tableau Mobile to ensure you’re working off the same information. Recipients will receive a notification and have shared content appear in the “Shared with Me” channel on their home screen. More information here.
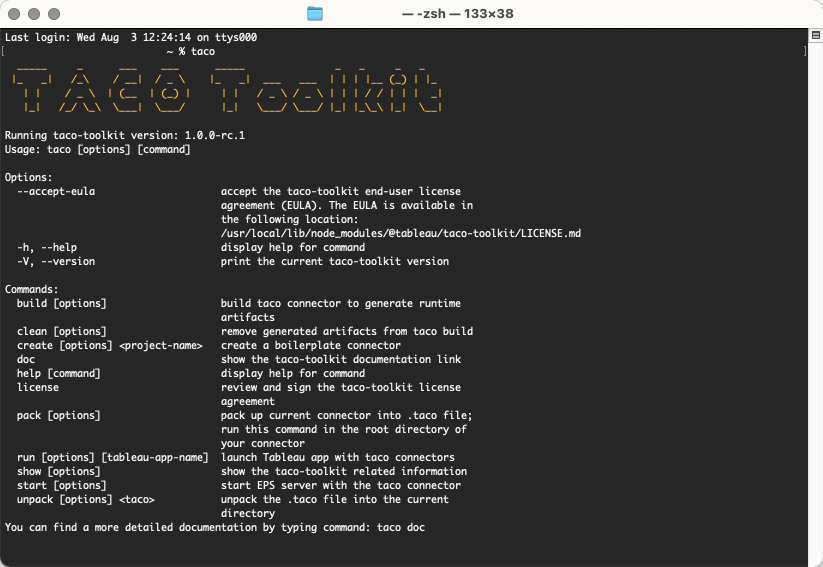
Web Data Connector 3.0
There is now a new developer experience for creating connectors to web application data via APIs. Web Data Connector 3.0 provides a toolkit with everything you need to develop a connector in a single package. Additionally, web data connectors are now .taco files so they no longer need to be web hosted and can be easily integrated across the entire Tableau platform.
SharePoint Lists connector
With the new connector for Sharepoint Lists in Tableau Cloud and the Tableau Exchange, users can now access data in SharePoint Lists, directly from Tableau. This connector also supports Azure AD authentication.

New Google BigQuery connector in Tableau Cloud
The new Google BigQuery connector in Tableau Cloud unlocks enterprise use cases. The new connector leverages the Storage Read API for faster extract creation and allows for more customisation in connection options such as initial SQL and cross-project joins.

Improvements to Ask Data
We continue to extend the availability of Ask Data! Adding Ask Data to a Dashboard is now smoother than ever, supported end-to-end in Tableau Desktop. We are also increasing flexibility to manage Ask Data inside dashboards. Analysts can decide to show or hide the Ask Data Configuration toolbar, so business users can easily add visualisations to Pins, publish them as workbooks, or even share them with others.
Previously released in other Tableau products in Tableau 2022.2, this capability is now available in Tableau Server 2022.3.
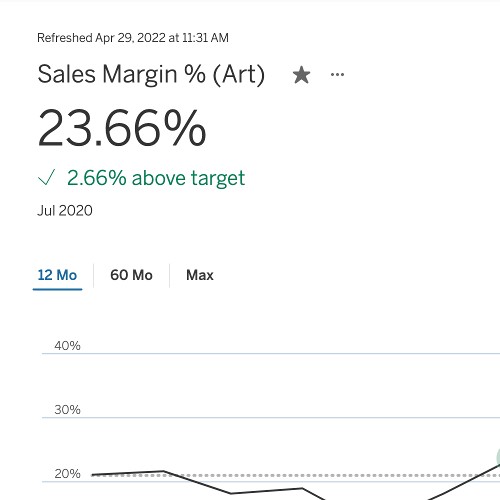
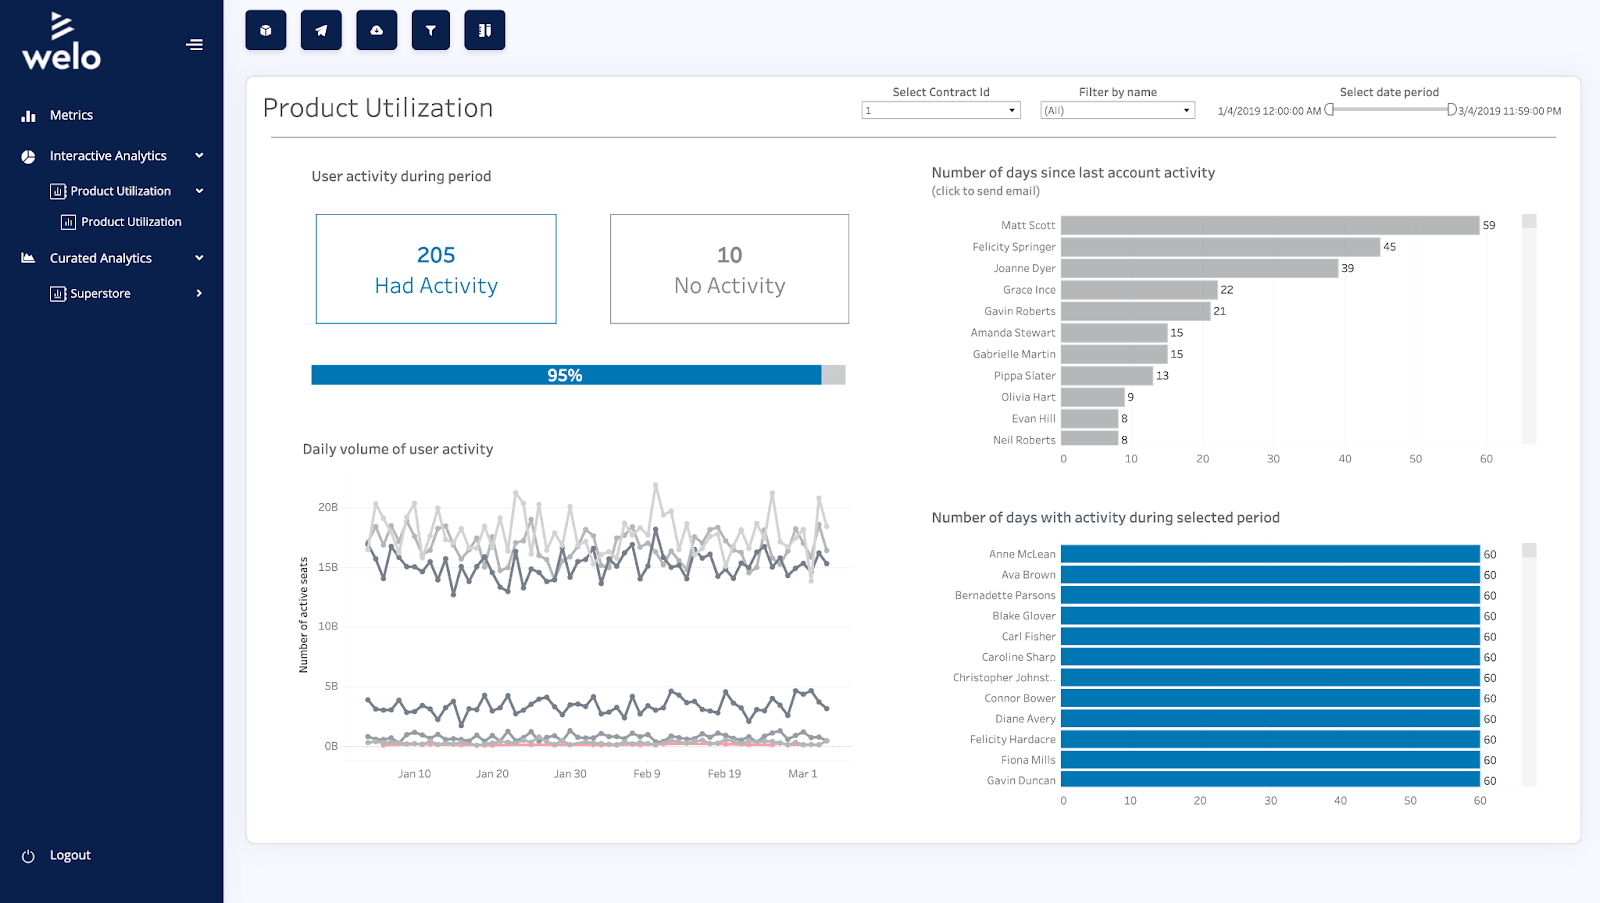
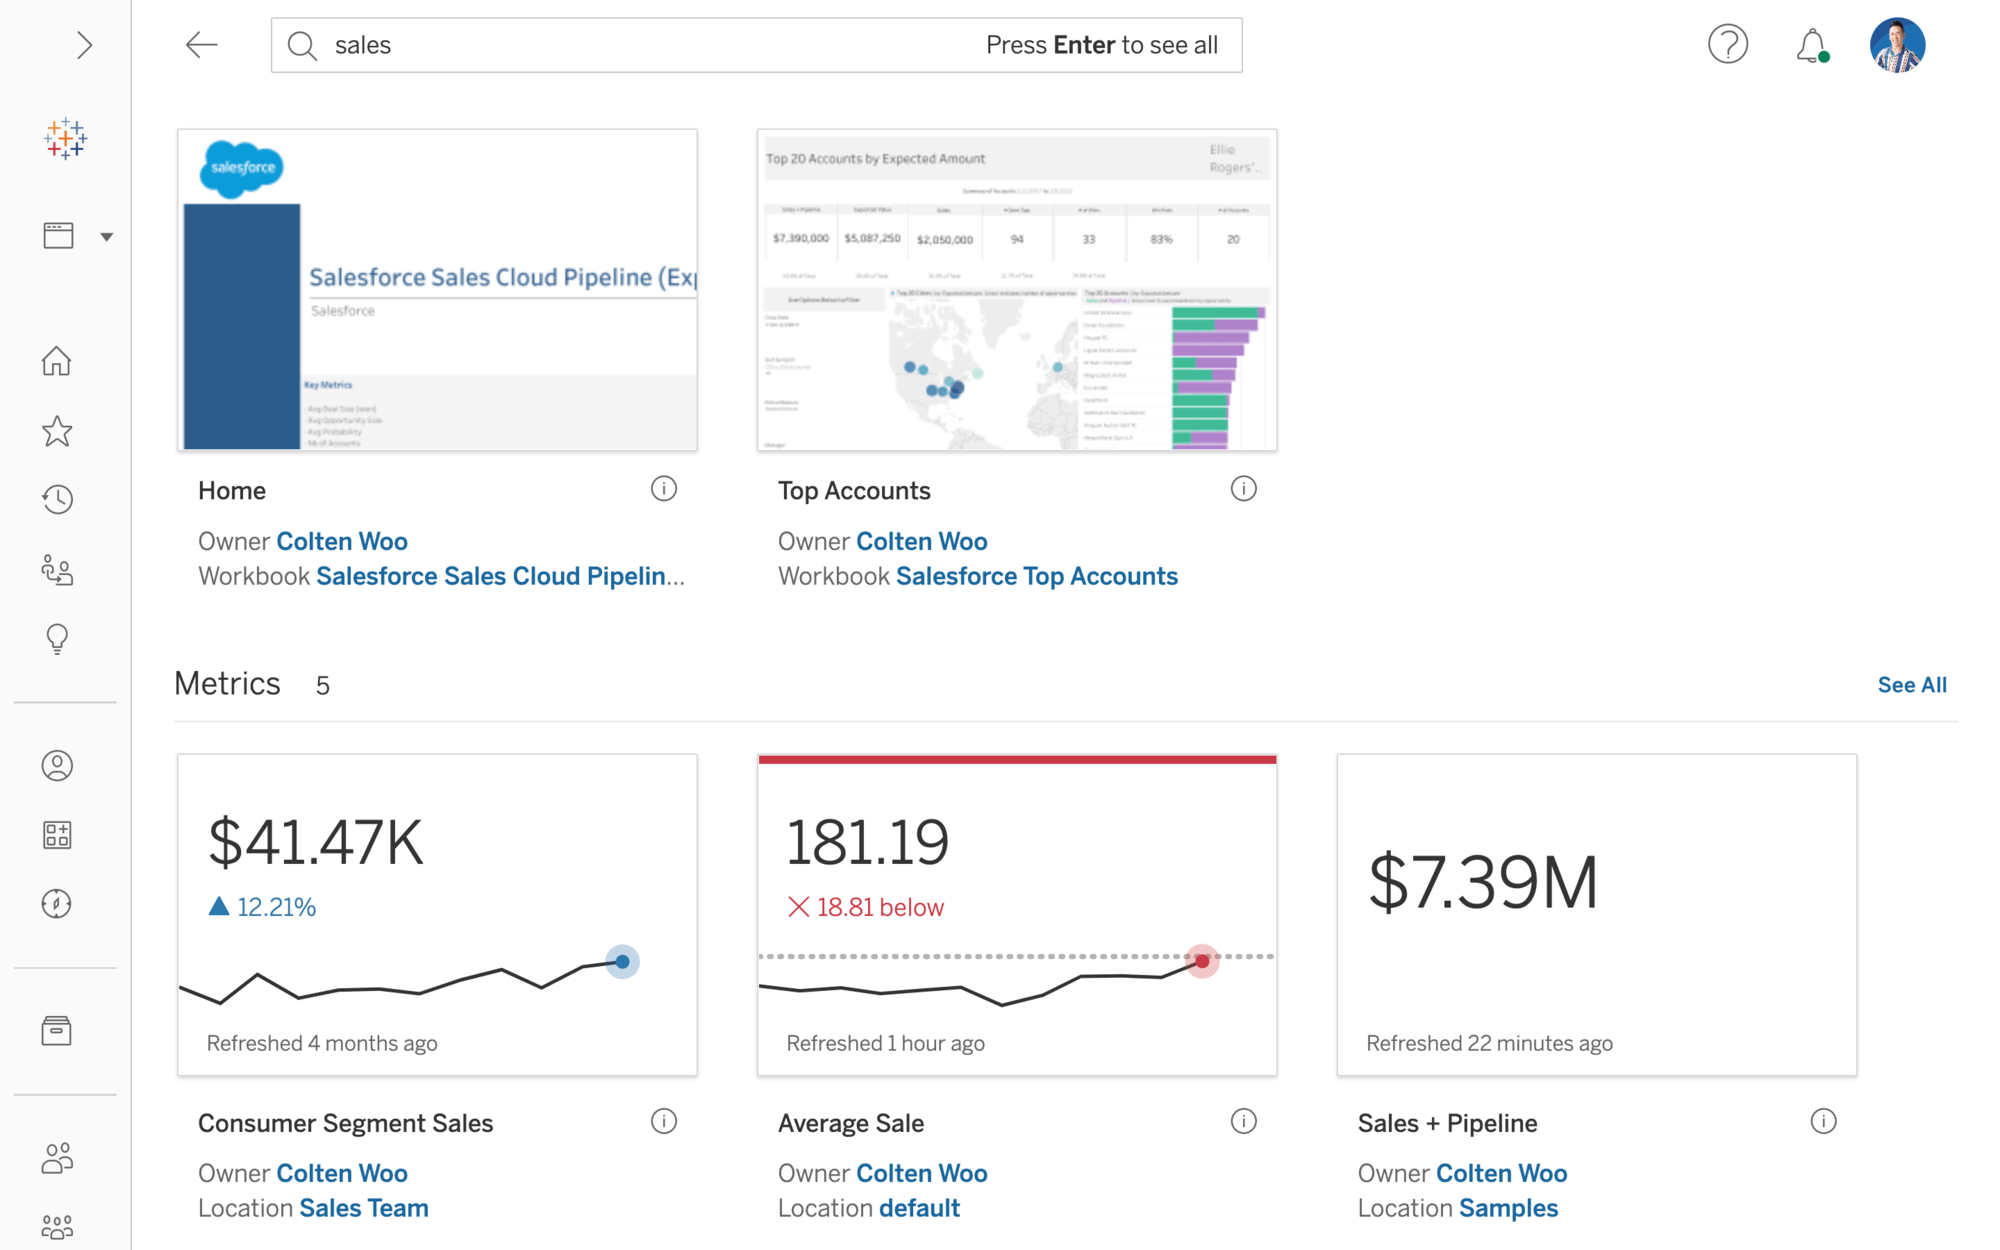
Metrics improvements
Create metrics to track key data points without having to access your dashboards and edit them at any time. You can now come back and edit existing metrics to change the historical comparison period, the date range used by the metric and the status indicators. Additionally, you can dynamically explore different date windows while analysing the metric without editing the configuration.
Previously released in other Tableau products in Tableau 2022.2, this capability is now available in Tableau Server 2022.3.
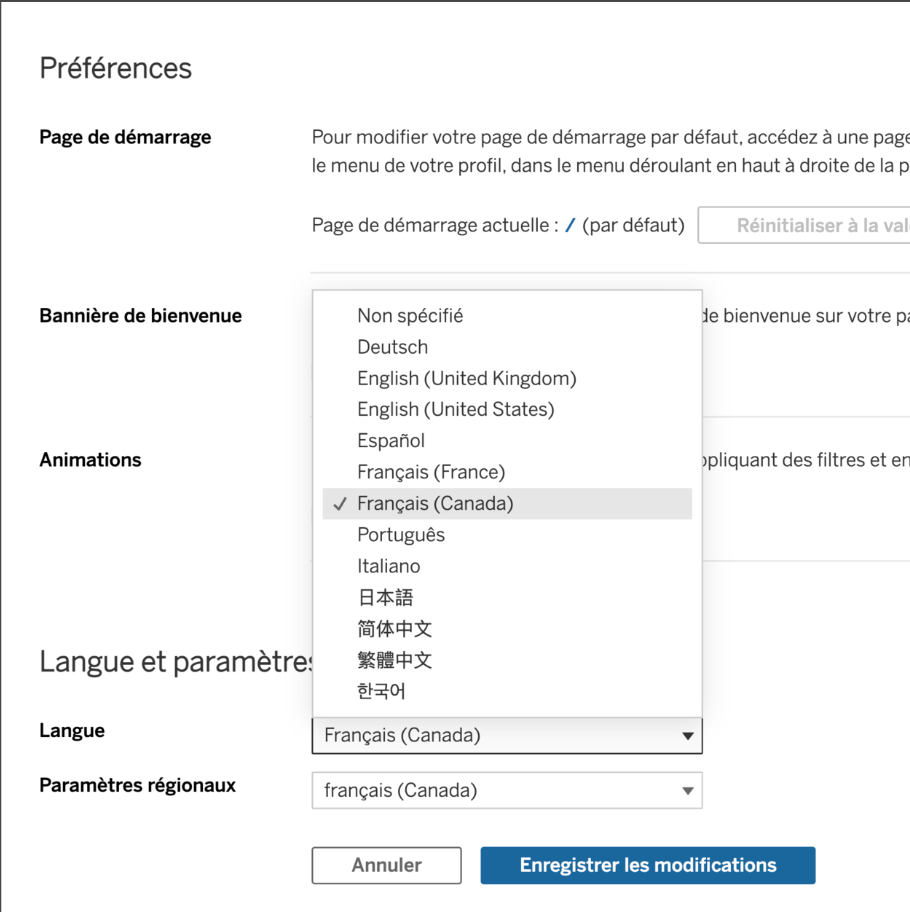
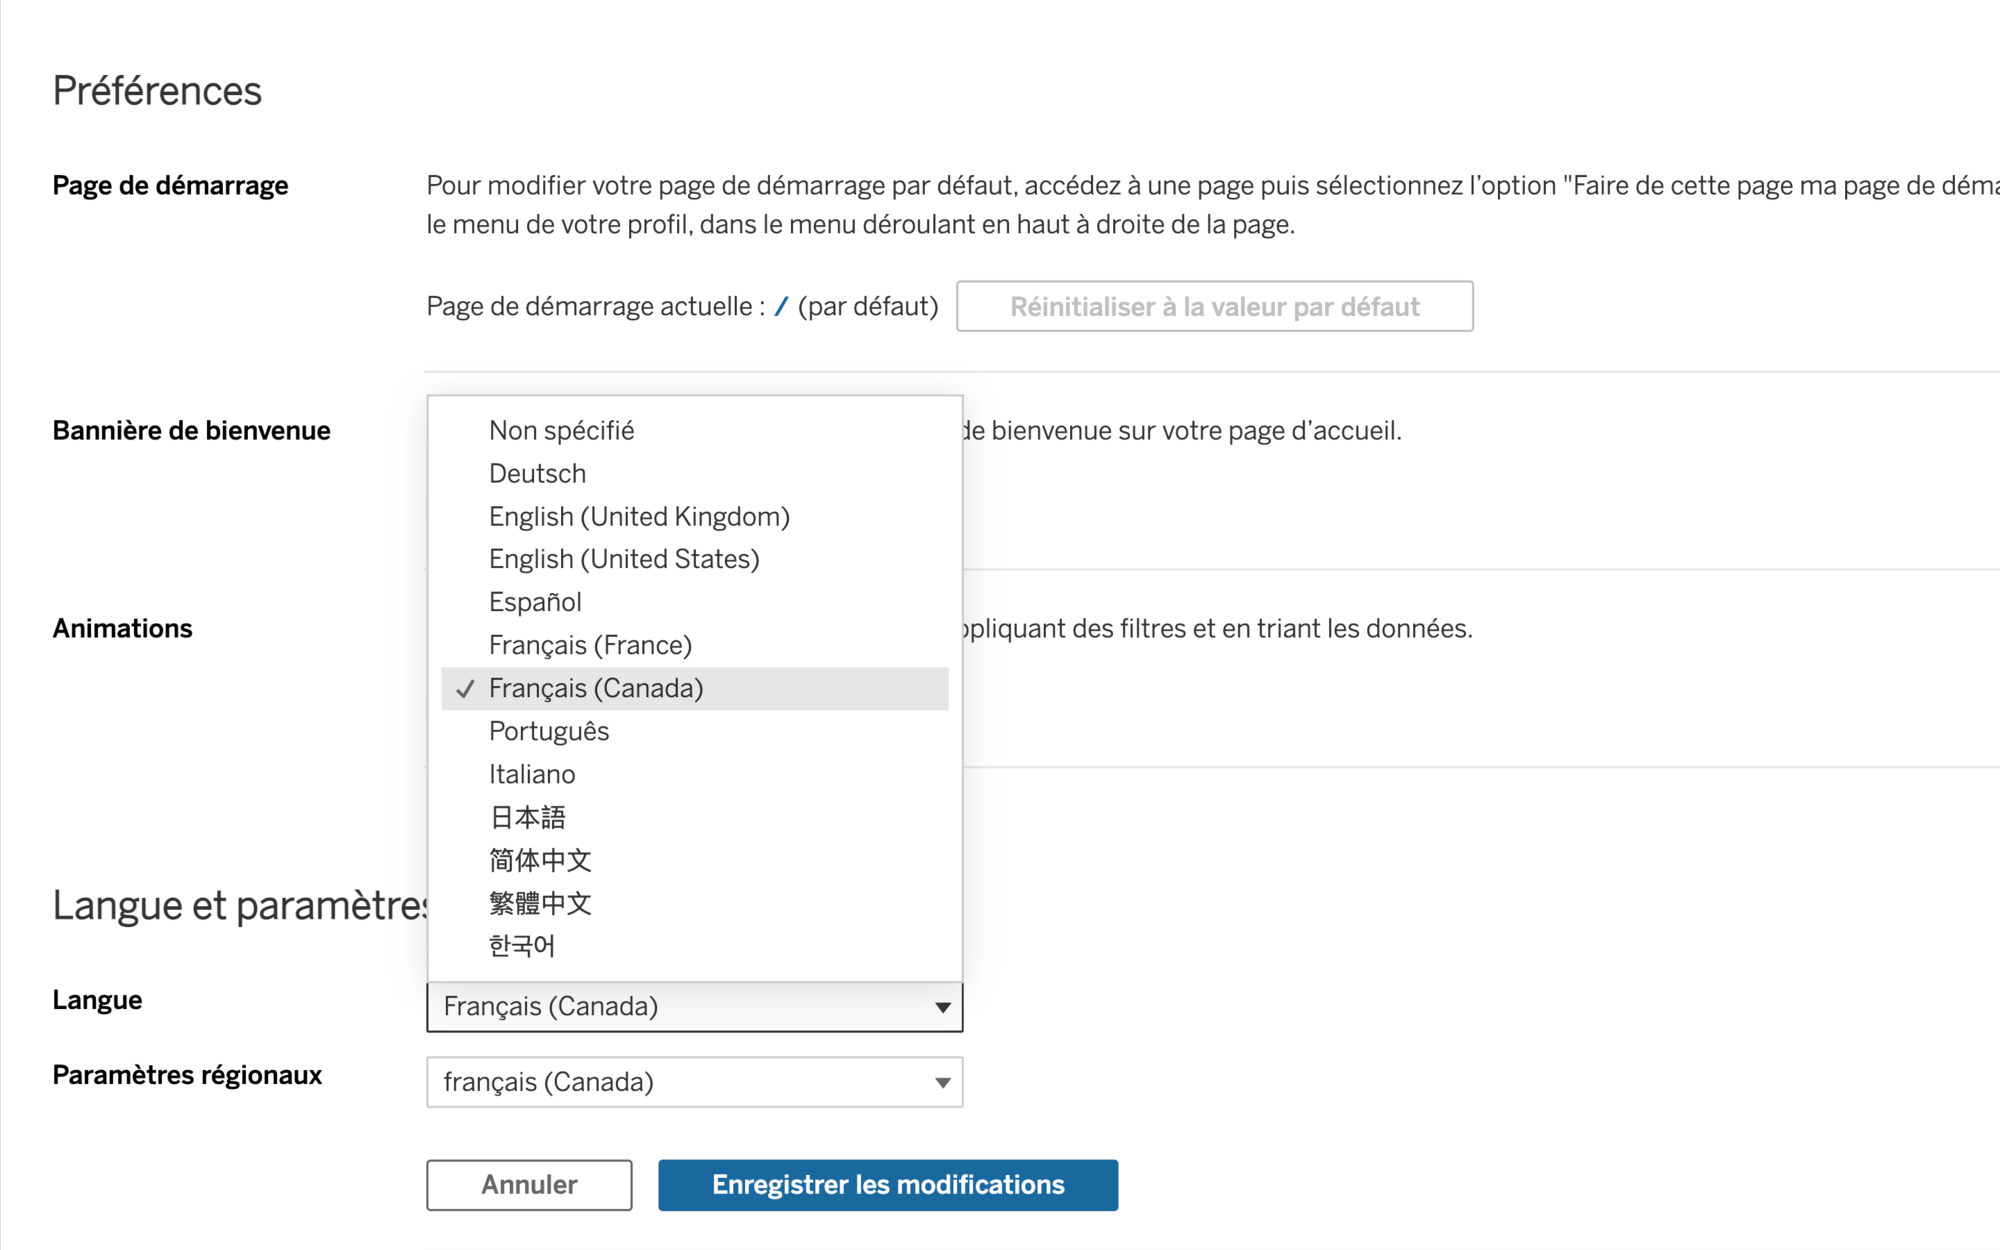
New product language: French (Canada)
See and understand data in your local language. We’ve expanded our language options to include French (Canada), making Tableau feel more familiar for Canadian French speakers.
Previously released in other Tableau products in Tableau 2022.2, this capability is now available in Tableau Server 2022.3.
View acceleration improvements
You can now automatically suspend acceleration for views that are consuming unnecessary resources. Set a threshold for the number of times an acceleration task can fail per day, week or month before the acceleration is automatically suspended.
Previously released in other Tableau products in Tableau 2022.2, this capability is now available in Tableau Server 2022.3.
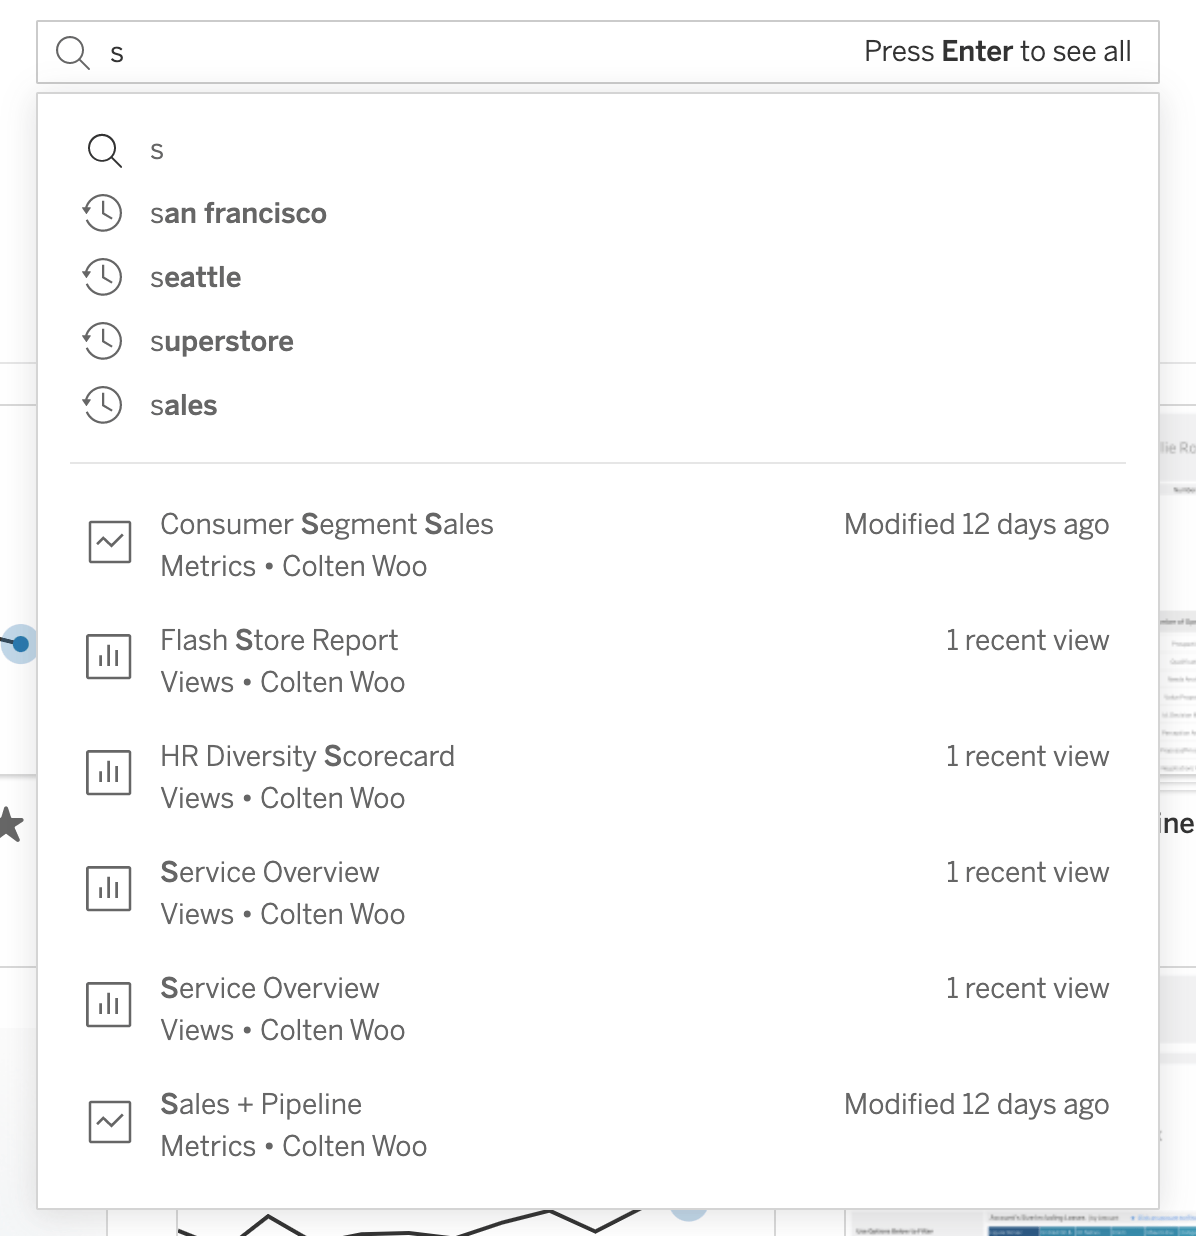
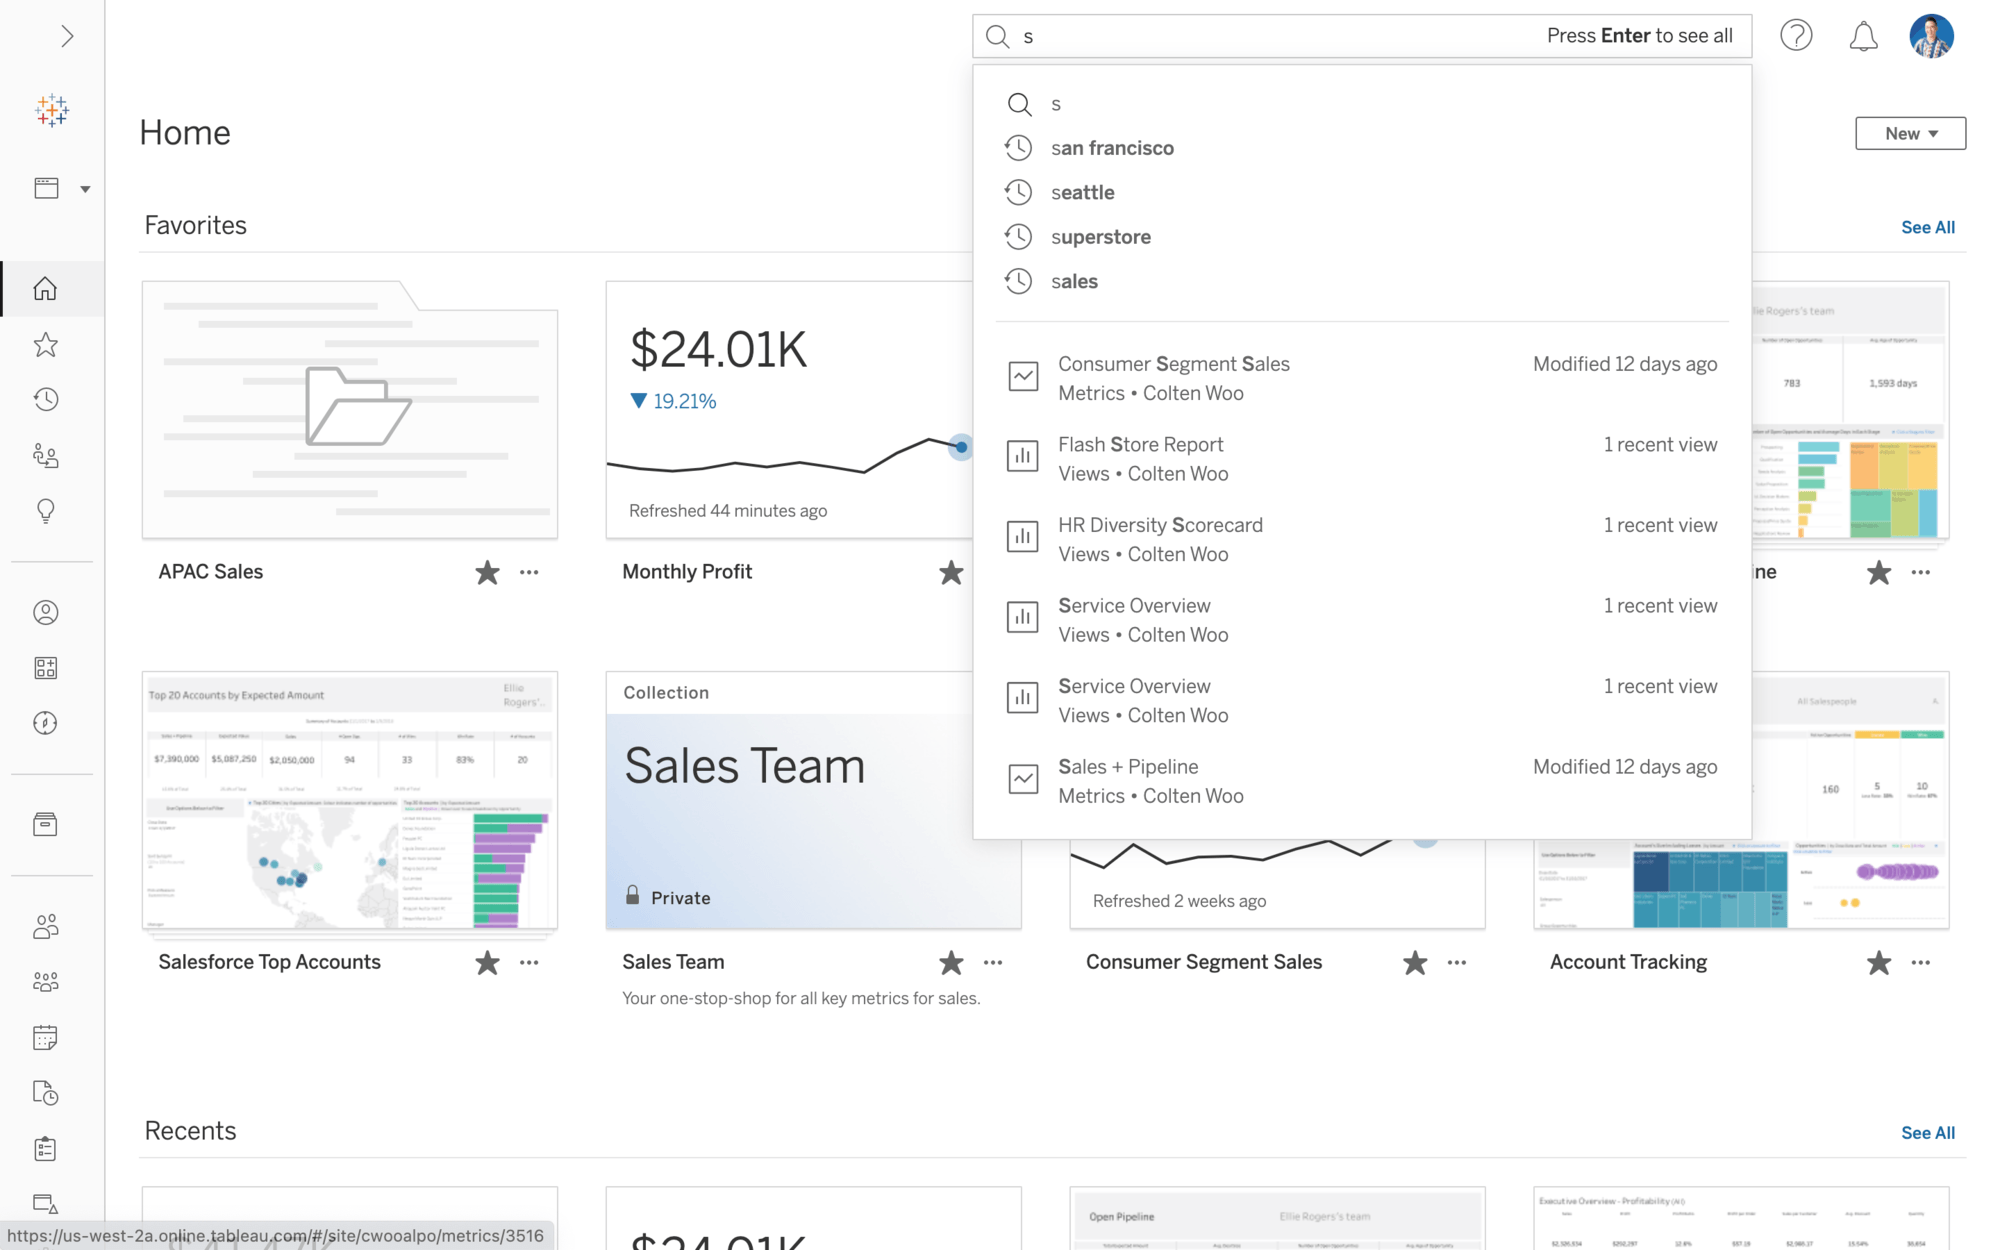
Improved Quick Search
Navigate to relevant content faster and more intelligently in Tableau. The reimagined Quick Search includes a new suggested content algorithm, a streamlined design, and past searches a click away to save time and speed up your time to insight.
Previously released in other Tableau products in Tableau 2022.2, this capability is now available in Tableau Server 2022.3.

Column reordering enhancements for Prep
When working with really large tables in Tableau Prep, instead of manually dragging and dropping each column in the profile pane, users can now drag and drop to sort data columns in the field list view. Once the user has specified their column order, the order is maintained across the entire flow and the final output after the flow is run.
Previously released in other Tableau products in Tableau 2022.2, this capability is now available in Tableau Server 2022.3.
New Connector on Tableau Exchange
The following Connector is available now on the Tableau Exchange:
Learn more about Tableau releases