DataFam Roundup October 2026


Welcome! Dig into this month’s DataFam Roundup—a monthly blog that brings together community content all in one post. As always, we invite you to send us your content—and the DataFam content from your peers that have inspired you! Join the Tableau Community workspace on Slack and join the #community-share channel to get your daily inspiration, tips, tricks from the DataFam!
Community Highlight
To recognize new and consistent Tableau contributors—we’re excited to have a section within the monthly DataFam Roundup called the Tableau Community Highlight. Find out how to get involved.

Emilie Smith, Sr. Business Intelligence Developer at EnlivenHealth
North Carolina, USA
Emilie Smith brings a distinct and thoughtful perspective to data analytics as a Senior Business Intelligence Developer at EnlivenHealth. She spent ten years as a research scientist in early drug discovery, but after discovering Tableau through online analytics coursework, she developed a deep appreciation for data visualization, building her technical expertise through hands-on portfolio projects and insights from Tableau Visionaries. Today, she applies that analytical rigor to develop client-facing and operational dashboards that directly impact healthcare outcomes, tracking critical initiatives such as medication adherence, vaccine programs, and patient communication.
Emilie is equally dedicated to empowering and connecting the broader analytics community. Inspired by community leaders at Tableau Conference, she co-founded the Data + Women North Carolina User Group alongside two other leaders to create local spaces for professional growth and collaboration. A frequent speaker across local and virtual TUGs as well as Tableau Conference, Emilie actively shares her knowledge through both stage presentations and personalized, one-on-one mentorship. As she looks ahead to working with the latest capabilities in Tableau Studio, she continues to pay forward the mentorship and encouragement that defined her own path into analytics.
Connect with Emilie on Linkedin and Tableau Public.
DataFam Content
Blogs
- Dan Chissick: Apply to Totals
- Deepak Holla:
- Donna Coles:
- Eric Parker:
- Iris Sun:
- Johan de Groot:
- John Johansson: Public Data Projects
- Kevin Flerlage: Force Tableau Cloud to Open Links in New, Individual Tabs
- Kevin Wee: Free Learning Resources: Graphic Design Concepts Applied in My Dashboards
- Kirk Munroe: Why do relationships do that? Part 3: show me the SQL
- Le Luu:
- Matt Huff: Why Data Portfolios are a Must Have
- Phillip Schrijnemaekers: How did I pass the Salesforce Tableau Next Consultant Certification Exam
- Rafael Guevara Jr: Don’t Mess With Texas; It’s on Camera
- Ramdoss.K:
- Design Pattern for Reducing Multiple Joins in CRM Analytics — Vol 3: Using Window Functions to…
- Design Pattern for Reducing Multiple Joins in CRM Analytics — Vol 4: Finding the Most Recent Closed…
- How to Build YoY Analysis in Tableau Next — From Semantic Modeling to Agentforce Insights
- How We Built Semi and Anti Join Logic in Tableau Next to Identify Students Who Didn’t Rebook After…
- Veronica Simoes?:
- Waqar Ahmed Shaikh:
- Yehwan Hwang:
- Yoshitaka Arakawa: I Let Generative AI Build an Entire Tableau Workbook (An Experiment)
- YusukeNakanishi: Salesforce Certified Tableau Consultant 合格体験記
Videos
- Blake Feiza:
- Cecilia Fryar:
- Deepak Holla:
- Eduard Nizamov: Claude Built a Tableau Dashboard Through MCP
- Eric Parker:
- Nisar Ahmed:
- Samantha Cohn: Samantha Cohn:
- Tristan Gullivan: New Tableau Viz Extensions: Waterfall, Ternary Plot and more
Visualizations
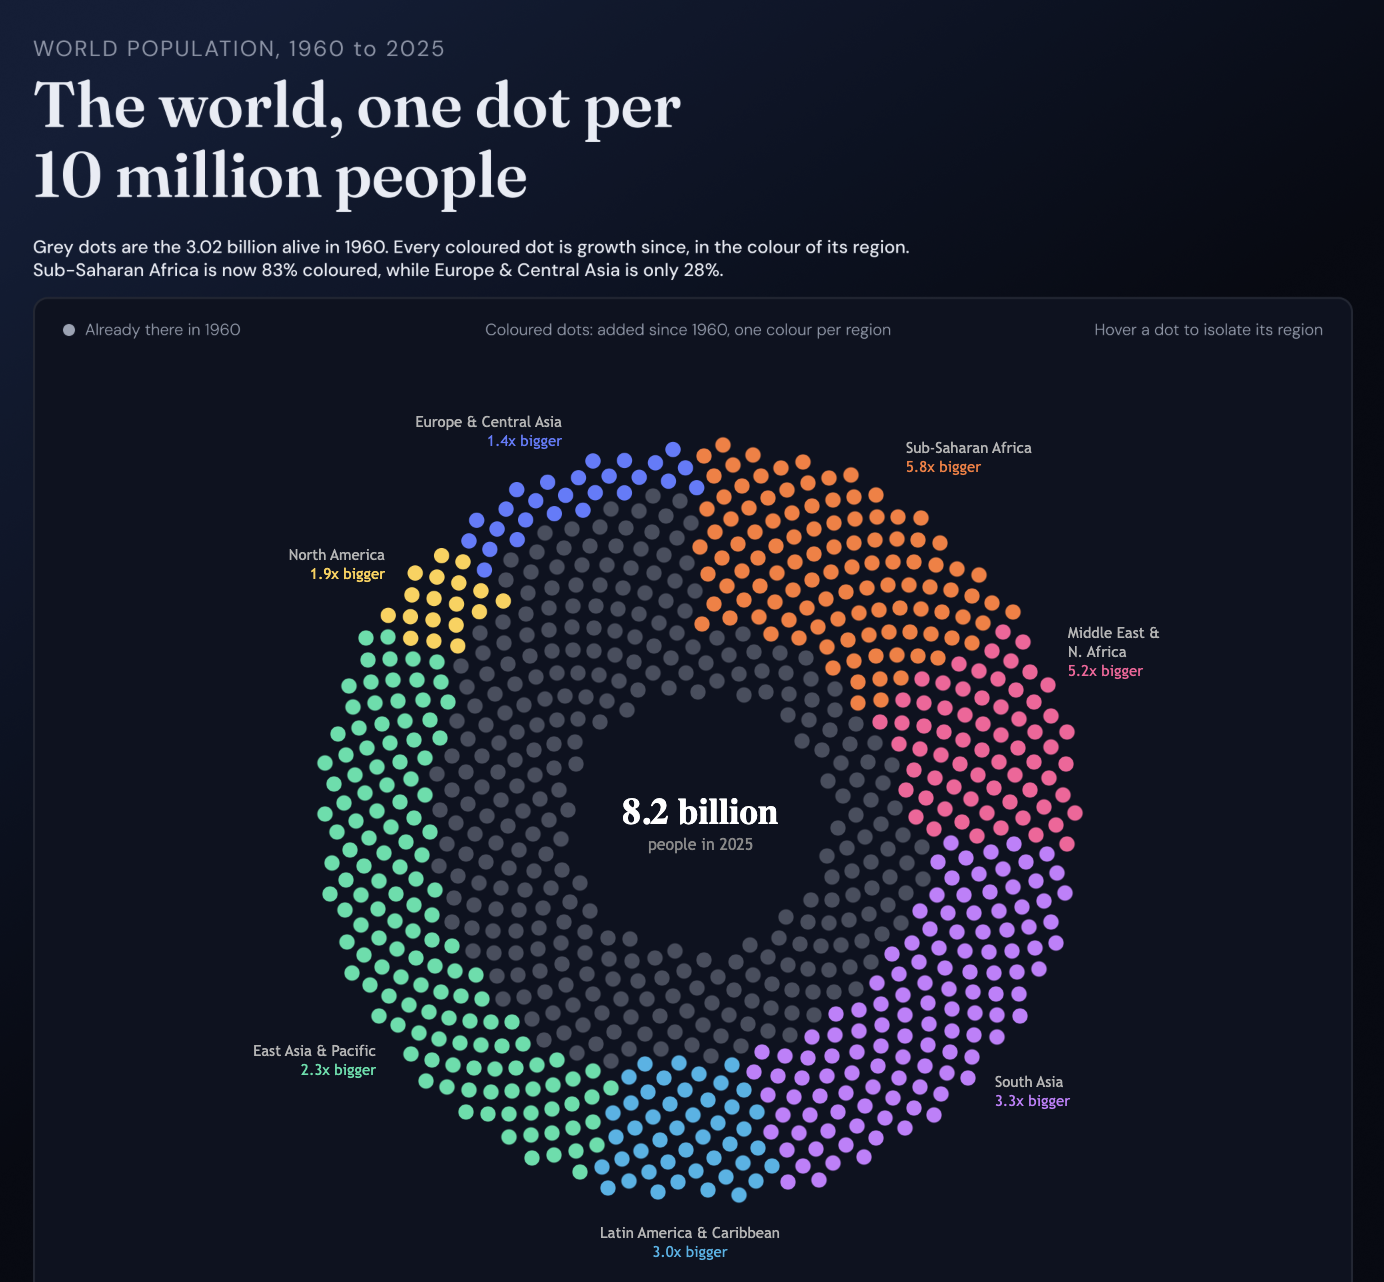
Waqar Ahmed Shaikh: One Dot, 10 Million People: World Population 1960 vs 2025
See the latest Viz of the Day, trending vizzes, featured authors, and more on Tableau Public.
Check out some inspirational vizzes created by the community:
- Artem Liakh:
- Bikram Dulal: Hotel Booking Demand & Cancellation Risk Analysis
- Deepak Holla: Find the Outlier
- Gospel Chinedu Nwachukwu:
- Hironobu Yamada (Yamacho): The First Door
- Jinseong Heo: LOTTE WORLD ADVENTURE DASHBOARD
- John Johansson: Twenty Years of Modern Baseball
- Külli Esko: Counting America | Makeover Monday 2026 W42
- Luis Martinez: Human Killas
- Manbow (Hiroaki Nakajima):
- Matthias Giger: Heads-up Tableau admins (Resolved Issues Tableau Desktop, Prep and Server)
- Michael Lamprell: #MOM 2026 Wk 40
- Miyuki Akimoto:
- Naresh Suglani: Building Materials - Competitor Analysis
- Noel Myung: Red Bull RB20 - 3D Model
- Olha Tykhotska: Eurovision
- Rajan Das: EU Tourism Insights 2025
- Sviatoslav Mykytyn: Piano Music Performance
- Tom Fowler:
- Viktoriia Yelisavenko: Sound Evolution: How Taylor Swift's Music Features Correlate
- Yash Motiani: Retail Analytics: Superstore Sales & Profit Insights (2023-2026)
- Zenzo Duma: Which Texas County Gets the Next Clinic?
Social Posts and Other Content
- Anastasiya Kuznetsova: How to structure tables
- Ankur Napa: tableau-ambassador-atlas
- Deepak Holla:
- Eduard Nizamov: EasyTables: self-service tables and pivots for Tableau
- Hideaki Yamamoto: tableau-ambient-analyst
- Isarolava Misai: Drill-down regional map with dissolved hexagons: From QGIS to Tableau Public
- Michael McCusker: tableau-rest-api-starter-pack
- Phillip Schrijnemaekers: My very first Salesforce Tableau Next dashboard
- Rob Taylor, Chris Westlake: Introducing Shorts In Sports
- Seun Adeyemo: I built my first tableau extension today
- Zach Bowders:
- Zohra Tamjeed: 3 Excel moves, translated into Tableau
New Tableau Ideas
- Michael McCusker: Bring Filter as User to Tableau Cloud (preview a dashboard as another user) (60 points)
- Jacob Rothemund: Allow automatic refreshes of Published Data Sources (60 points)
- Frederic Fery: Ability to share Data Sources from Tableau Public (40 points)
- Vicky Tirrell: Freeze column(s) in Tableau Table extension (20 points)
- Elizabeth Bumgarner: Setting to disable version notification pop-ups in Tableau Cloud (20 points)
- Mirza Talha: Display Enabled/Disabled Status for Schedules in Subscription Schedule Dropdown (20 points)
- Chris Meardon: Custom Mark Labels in Visualisations (20 points)
Job Board
Check out the #job-board channel in the Community Slack Workspace for the latest available jobs in the data space. Find the 5 most recent listings below.
- [Full-Time; Remote] Data Analyst | Customer Journey & Attribution at Motorola Solutions
- [Full-Time; Remote] Senior Data Visualization Developer at THOR Solutions
- [Full-Time; Washington, DC] Senior Data Analyst at National Education Association
- [Full-Time; Sioux Falls, SD, and other locations] Business Analyst Advisor at Pathward
- [Full-Time; Wilmington, DE] Data Visualization Senior Associate at JP Morgan Chase
Team Tableau Content
- Sign up for the Tableau Builder and DataDev LIVE, a free virtual event taking place on Nov. 10.
- Tableau 2026.3 is here!
- 11/4 Webinar: Tableau Data Apps: Vibe code analytics with any agent — host and scale on Tableau
Community Projects
Back 2 Viz Basics
A bi-weekly project helping those who are newer in the community and just starting out with Tableau. Not limited just to newbies!
Web: Back 2 Viz Basics
X: #B2VB
Workout Wednesday
Build your skills with a weekly challenge to re-create an interactive data visualization.
Web: Workout Wednesday
X: #WOW2022
Preppin' Data
A weekly challenge to help you learn to prepare data and use Tableau Prep.
Web: Preppin’ Data
X: #PreppinData
Makeover Monday
Create business dashboards using provided data sets for various industries and departments.
Web: Makeover Monday
X: #MakeoverMonday
Data ChangeMakers
Volunteer to design data visualizations that help nonprofits harness the power of data for social change.
Web: Data ChangeMakers
Visual Climate
Collaborate and share climate data.
Web: Visual Climate
X: #VisualClimate
DataFam Con
A monthly challenge covering pop culture and fandoms.
Web: DataFam Con
X: #DataFamCon
EduVizzers
A monthly project connecting real education data with real people.
Web: Eduvizzers
Games Night Viz
A monthly project focusing on using data from your favorite games.
Web: Games Nights Viz
X: #GamesNightViz
Iron Quest
Practice data sourcing, preparation, and visualization skills in a themed monthly challenge.
Web: Iron Quest
X: #IronQuest
Storytelling with Data
Practice data visualization and storytelling skills by participating in monthly challenges and exercises.
Web: Storytelling with Data
X: #SWDChallenge
Project Health Viz
Uncover new stories by visualizing healthcare data sets provided each month.
Web: Project Health Viz
X: #ProjectHealthViz
Diversity in Data
An initiative centered around diversity, equity & awareness by visualizing provided datasets each month.
Web: Diversity in Data
X: #DiversityinData
Sports Viz Sunday
Create and share data visualizations using rich, sports-themed data sets in a monthly challenge.
Web: Sports Viz Sunday
X: #SportsVizSunday
Real World Fake Data
Create business dashboards using provided data sets for various industries and departments.
Web: Real World Fake Data
X: #RWFD
Data Plus Music
A monthly project visualizing the data behind the music we love!
Web: Data Plus Music
X: #DataPlusMusic
BizViz52
A weekly project centered around designing business dashboards.
Web: BizViz52
X: #BizViz52
相關文章
DataFam Roundup September 2026

Congratulations and welcome to the 2026 Tableau Ambassadors
 2026/09/09