
Interact with public vizzes from around the world
Tableau Public is a free platform to explore, create and share data visualisations publicly online.
Create. Explore. Share.
Looking to improve your data skills, get inspired or grow your career? Create and explore data visualisations for free with Tableau Public as you build your own portfolio of work. Connect, share tips and tricks, and collaborate with data enthusiasts around the world.

DataFam explained: What is Tableau Public?
Discover the magic of Tableau Public and take your data viz journey further with the help of the DataFam.
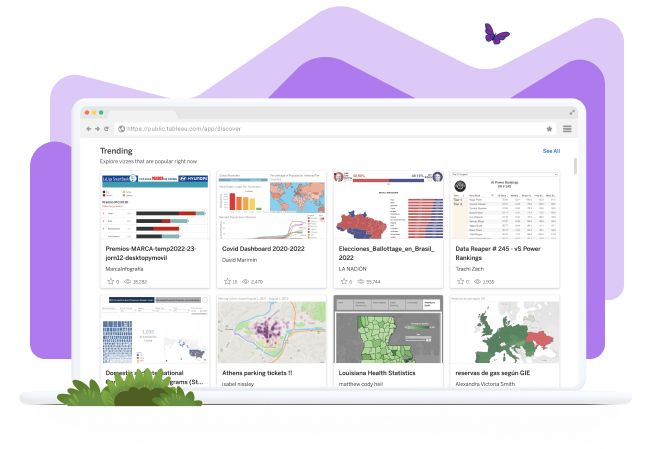
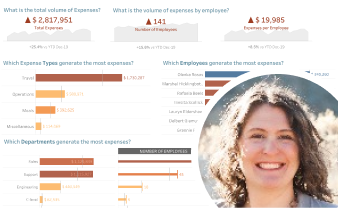
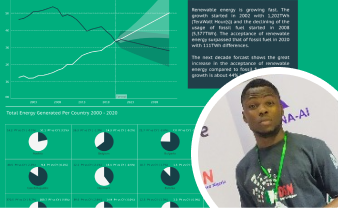
Watch nowExplore trending data visualisations on Tableau Public

Take a look at these Tableau Public authors for inspiring visualisations
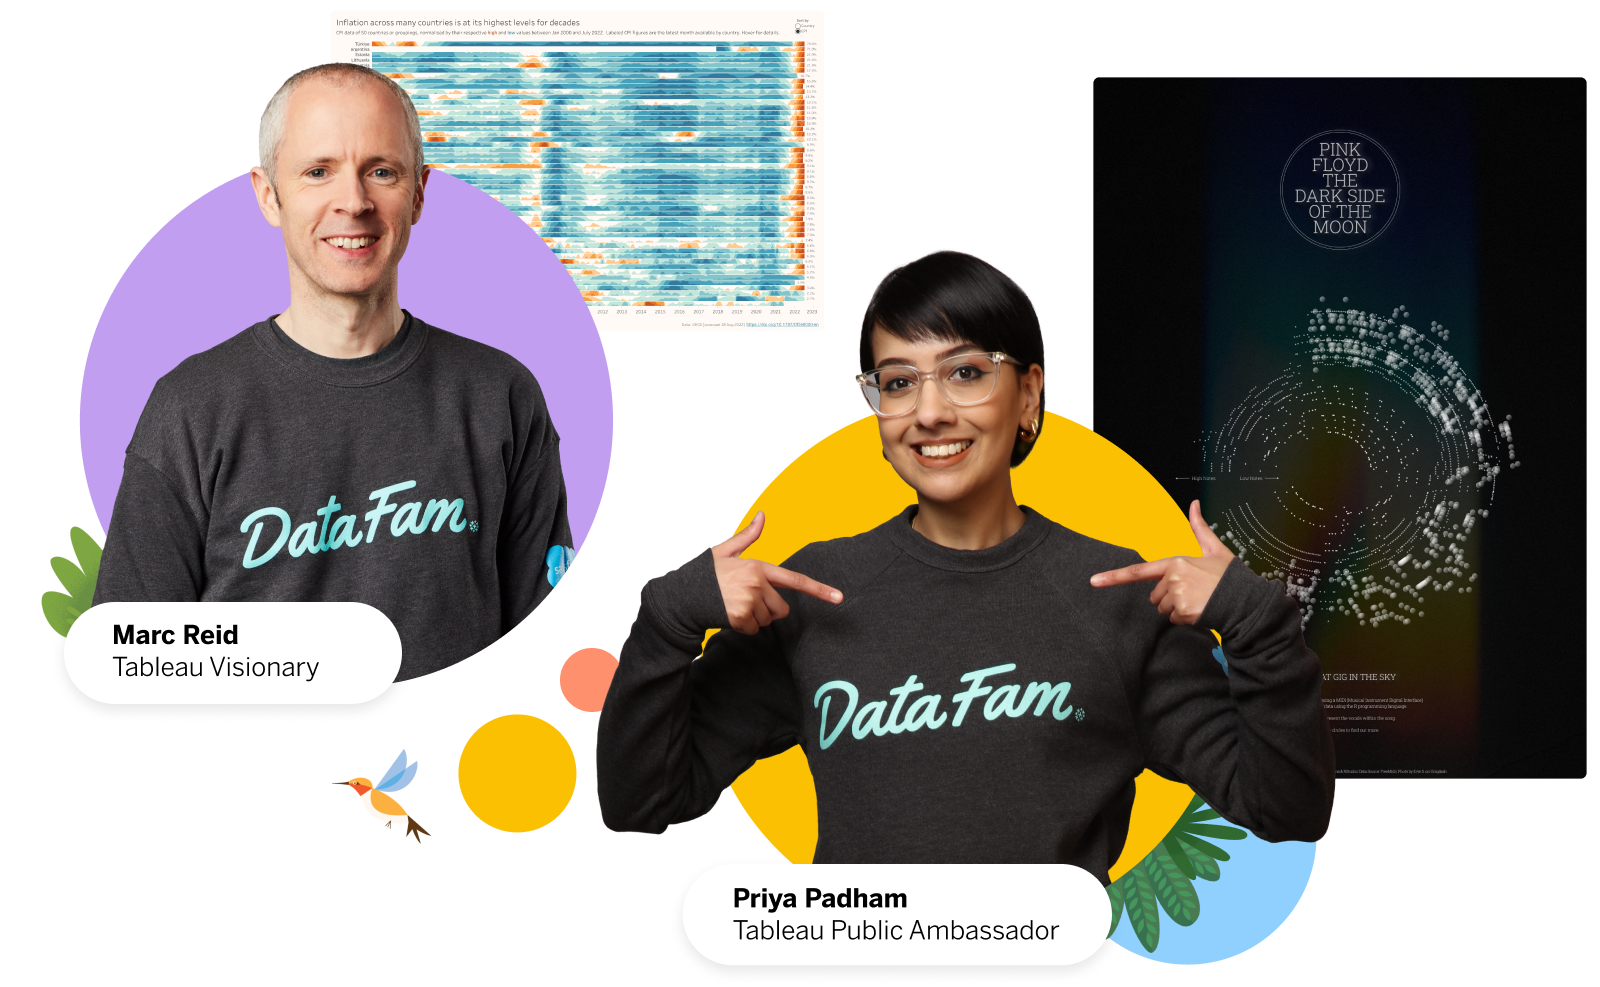
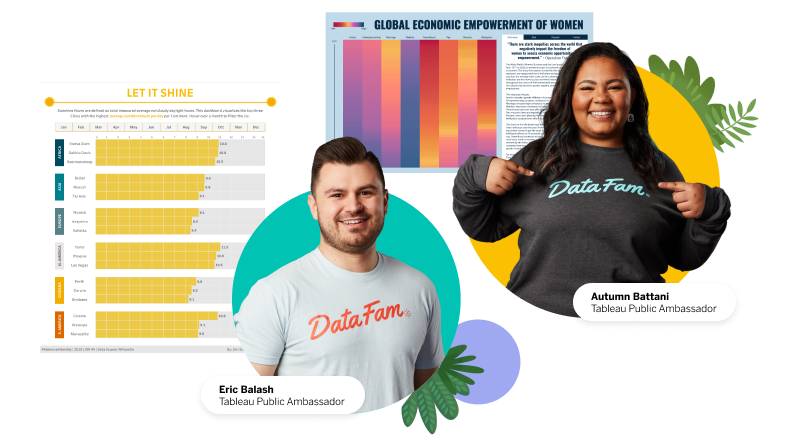
Tableau Public isn’t only a free platform for visualising public data, it’s also where the Tableau Community can find limitless inspiration and learn from one another. Following Tableau Public Ambassadors helps you discover new topics, visualisation ideas and community activities.

Damola Ladipo

Chiaki Ishida

Kasia Gasiewska-Holc

Kevin Wee 黃克文

Brittany Rosenau

Priyanka Dobhal
“I’m so inspired by the dashboards I find on Tableau Public. It really helps me see what’s possible and apply new techniques in my own work.”.
Priya Padham, Tableau Public Ambassador
Grow your career
Stand out with your online analytics portfolio by enabling the Hire Me button. Learn how these Public community members used their attention-grabbing profiles to get noticed, advance their careers, and even source new data visualisation job opportunities.

Idris Akilapa
The Hire Me button helped Idris get a job offer – no applications required.
Get inspired“The greatest thing about Tableau Public is that you have a visual portfolio of your work… I landed my dream job after working with Tableau Public for less than six months. It has truly changed my life and the lives of hundreds of others.”
Kevin Flerlage, Tableau Public Ambassador
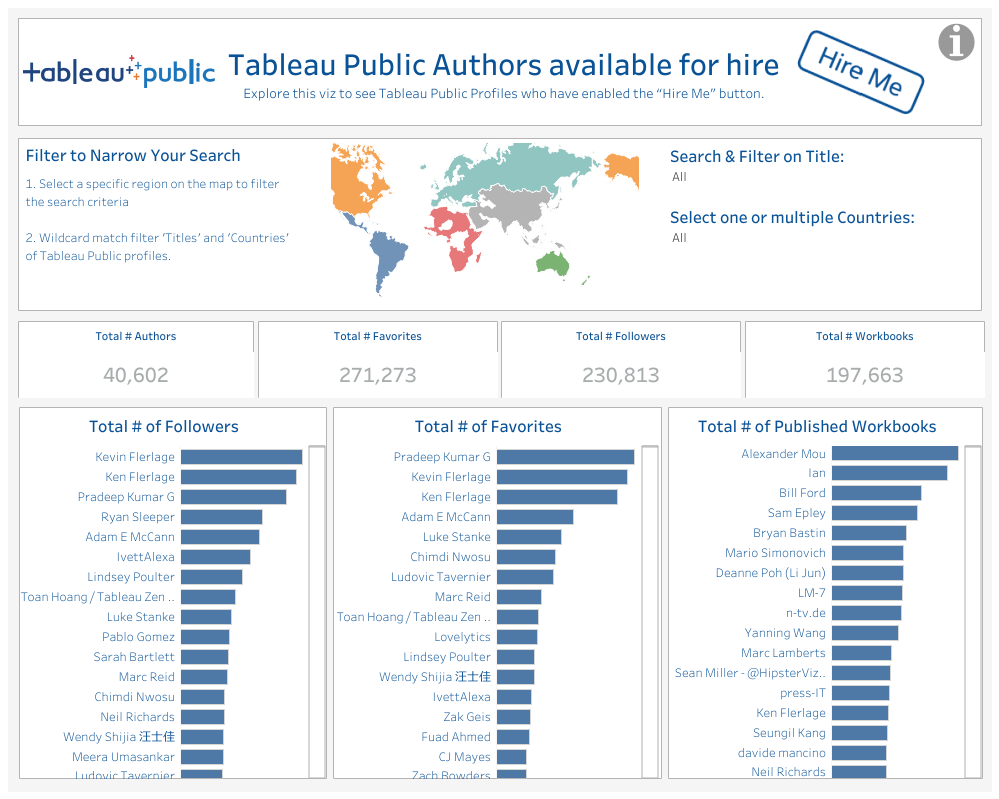
GET NOTICED
Expand your options
Enable the Hire Me button on your free Tableau Public profile to showcase your growth, areas of expertise and more.
Join 50,000+ Tableau Public authors who've built engaging profiles to get noticed, advance their careers and connect with hiring managers.
Connect with the DataFam
Follow @TableauPublic on Twitter and tag us when you’ve got something to share.
Create and share on Tableau Public
Find daily inspiration with the Viz of the Day. Yours could be featured next!
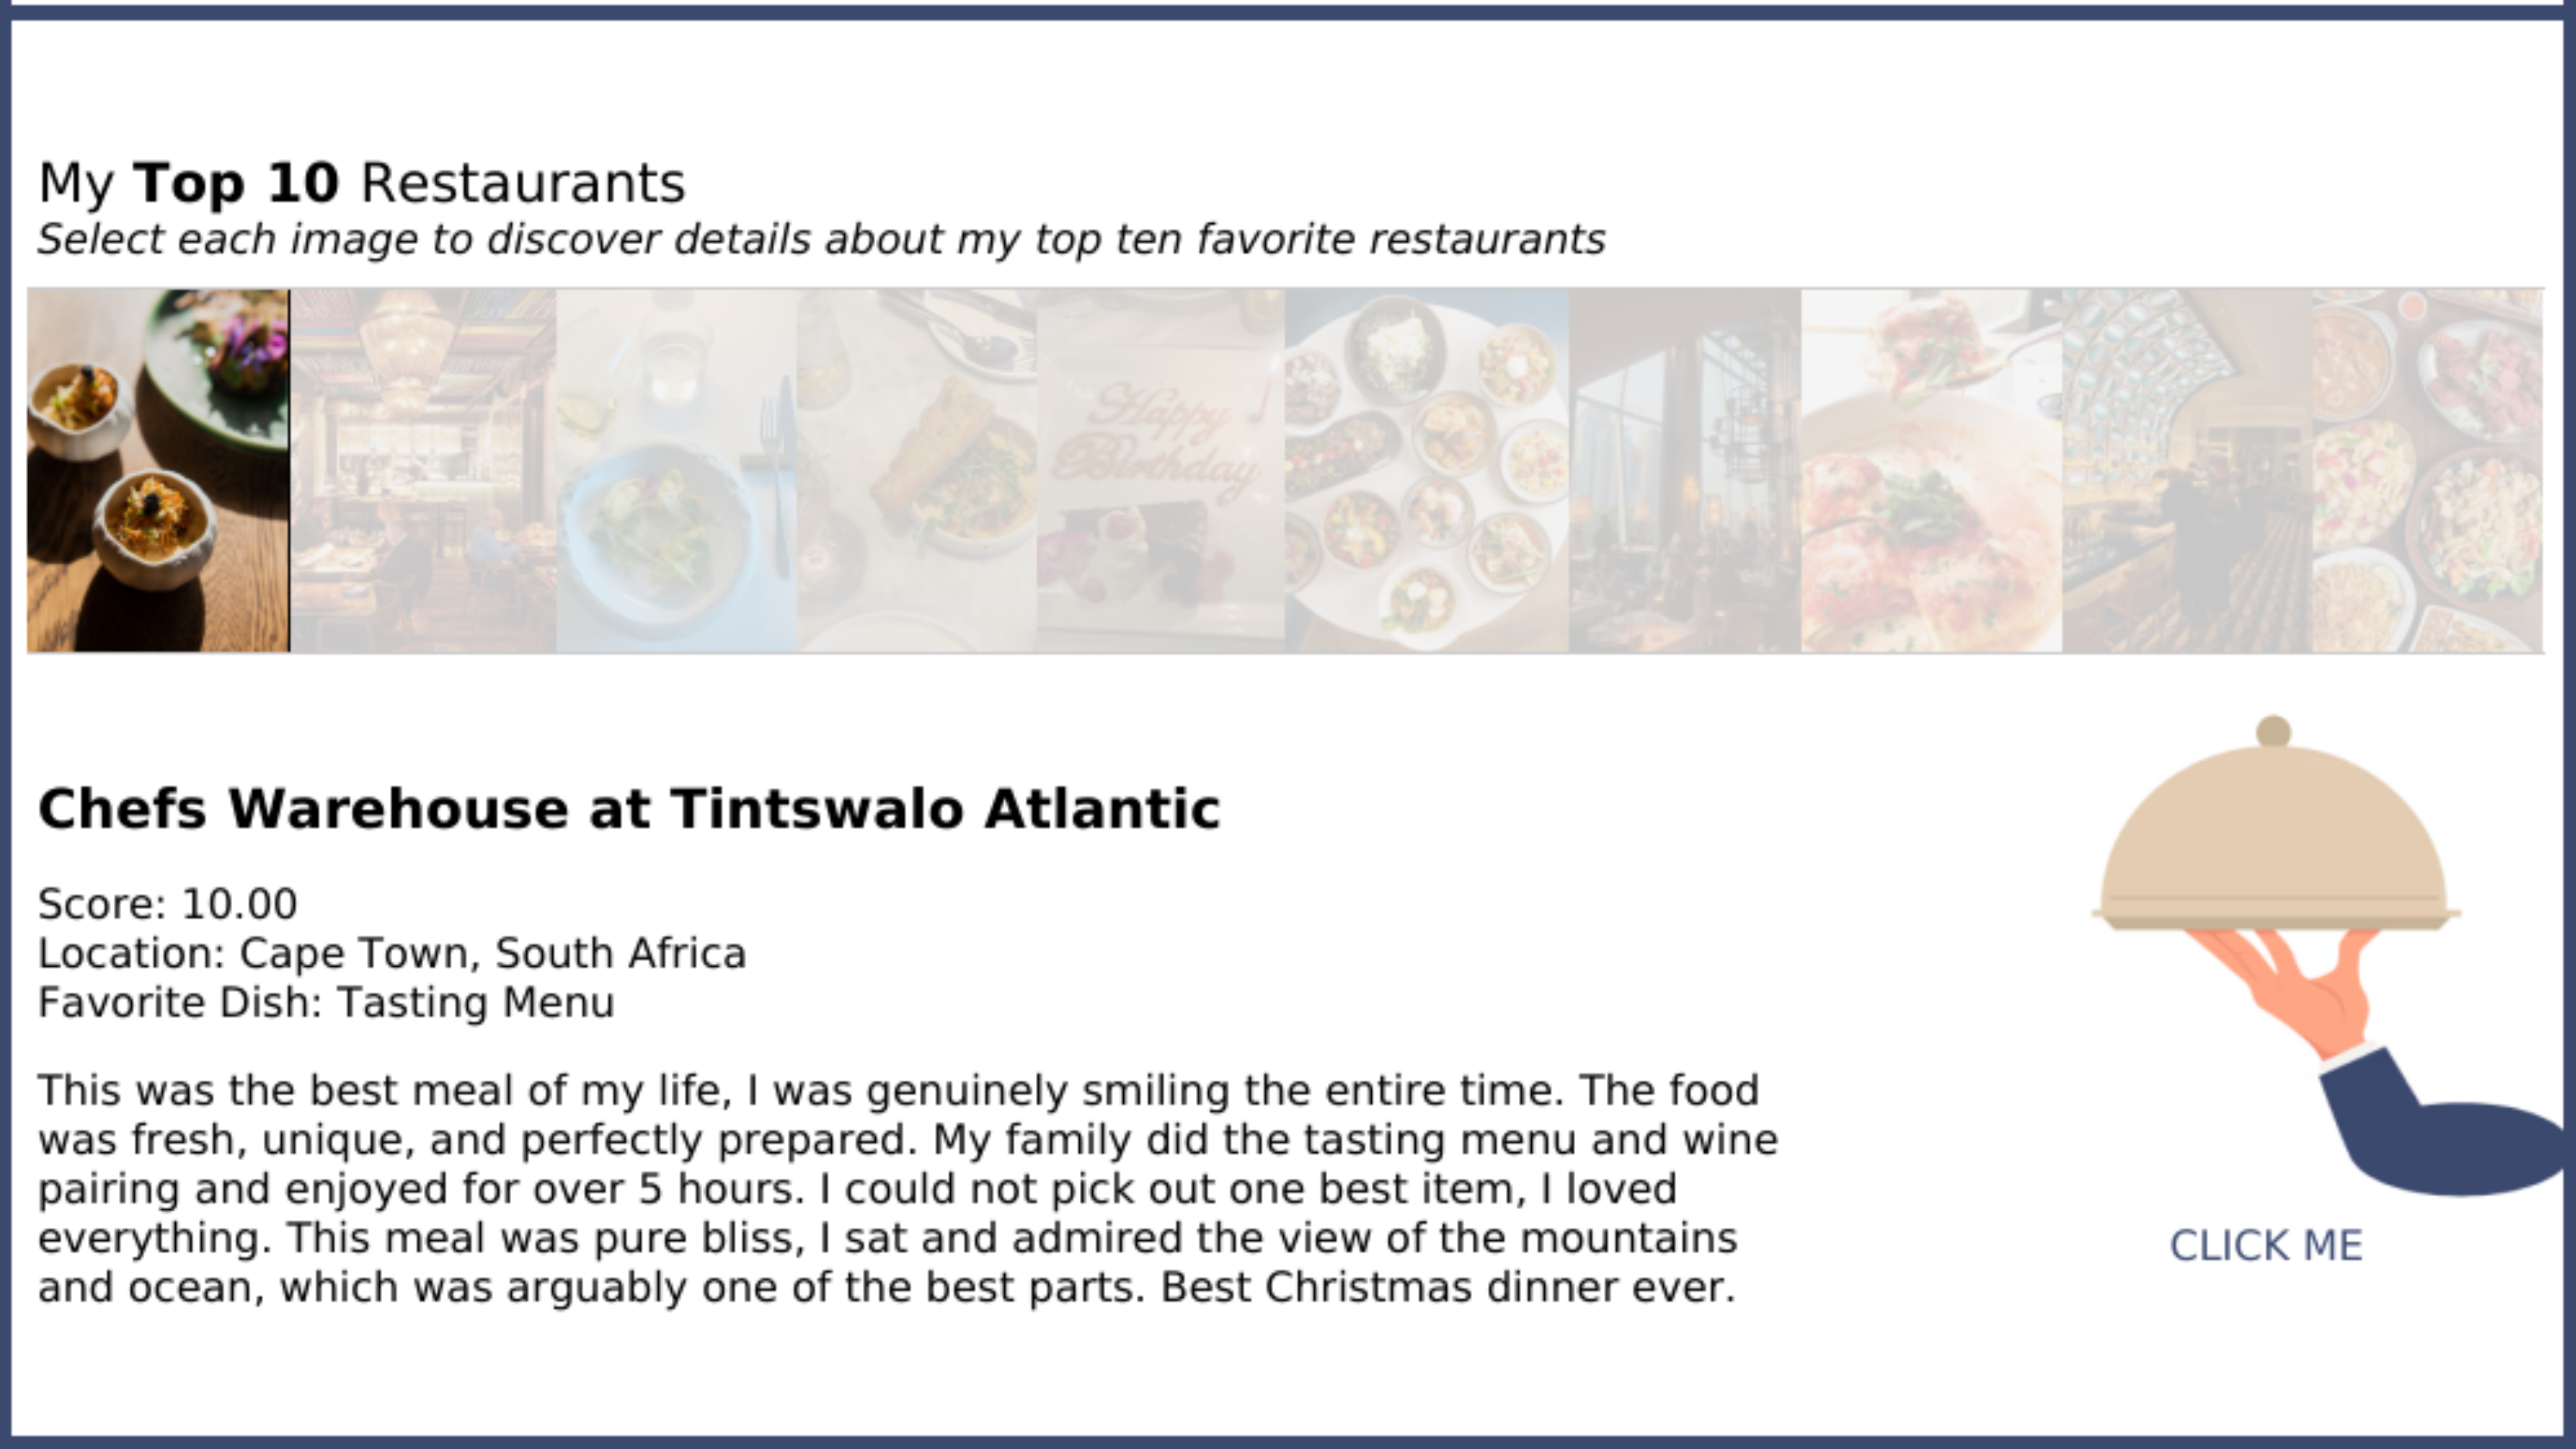
Beli Ratings
In this #VizOfTheDay, Hanne de Bie analyzes restaurant experiences, ratings, and ordering habits in her student #IronViz winning entry. A three-part navigation flow guides viewers to one key question: why cook at home?
Interact with the viz