Getting ready to publish your first data visualisation


In our beginner’s guide to Tableau Public, we showed you how to create a free Tableau Public profile page and the benefits of doing so. Next in this series, we talk about how to analyse data and publish a data visualisation to your Tableau Public profile. We will also walk through some free resources available to help you grow your data skills and discuss the benefits of connecting with the Tableau Community. Let’s dive in!
How do I quickly analyse, create and publish a data visualisation?
When it comes to Tableau Public, you have two options for analysing data and sharing your insights with others. To access them, make sure you're on a device that supports this functionality such as a laptop or desktop computer.
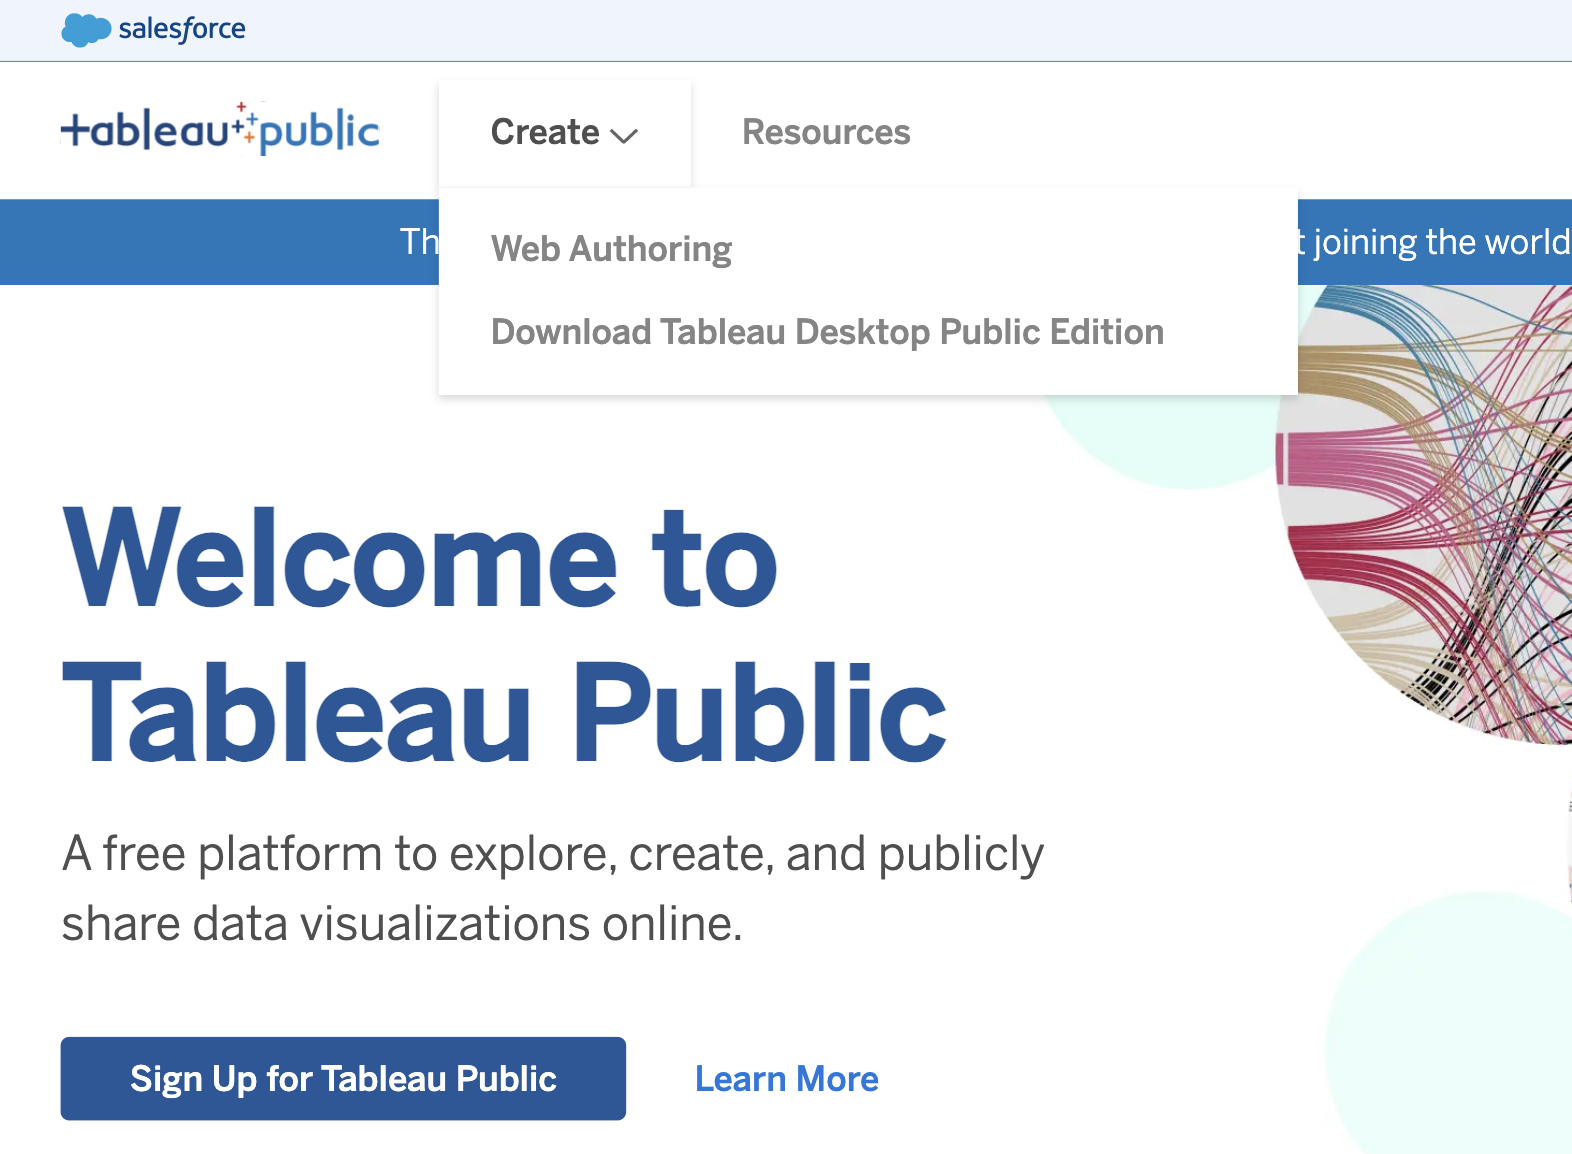
To access Tableau Public’s free data visualisation tools, simply click Create in the navigation bar.
You can create data visualisations and dashboards with drag-and-drop ease using:
1. Tableau Public web authoring
Web authoring allows you to create visualisations – or vizzes, as we affectionately call them – directly from a web browser. Can you create a viz without downloading any software? Yes! Since you’ve already set up your Tableau Public profile, all you need to do is log in and select Web authoring under Create in the navigation bar.
2. Download Tableau Desktop Public Edition
You can also download the software directly to your Mac or PC. Select Tableau Desktop Public Edition under Create in the navigation bar on Public’s website.
Reminder: Tableau Public should only be used for analysing and sharing public data. All workbooks and datasets published will be freely accessible to anyone. If you have private or proprietary data you want to analyse or share, check out Tableau’s other offerings.
What are the basic steps for creating my first visualisation?
- Open web authoring or the desktop app to create a viz.
- Connect to a data source.
- Drag and drop dimensions and measures to explore the data.
- Once you’ve created one or more vizzes, you can also create a dashboard that will display multiple vizzes in a single view.
- When you’re ready to save and share your work, publish it to your Tableau Public profile.
- Bonus points: Share a link to your viz on Twitter and include @TableauPublic and #DataFam to let others know. Example: I just published my first viz on @TableauPublic. Here’s a link. What do you think, #DataFam?
How do I get more familiar with Tableau Public and practice some foundational skills?
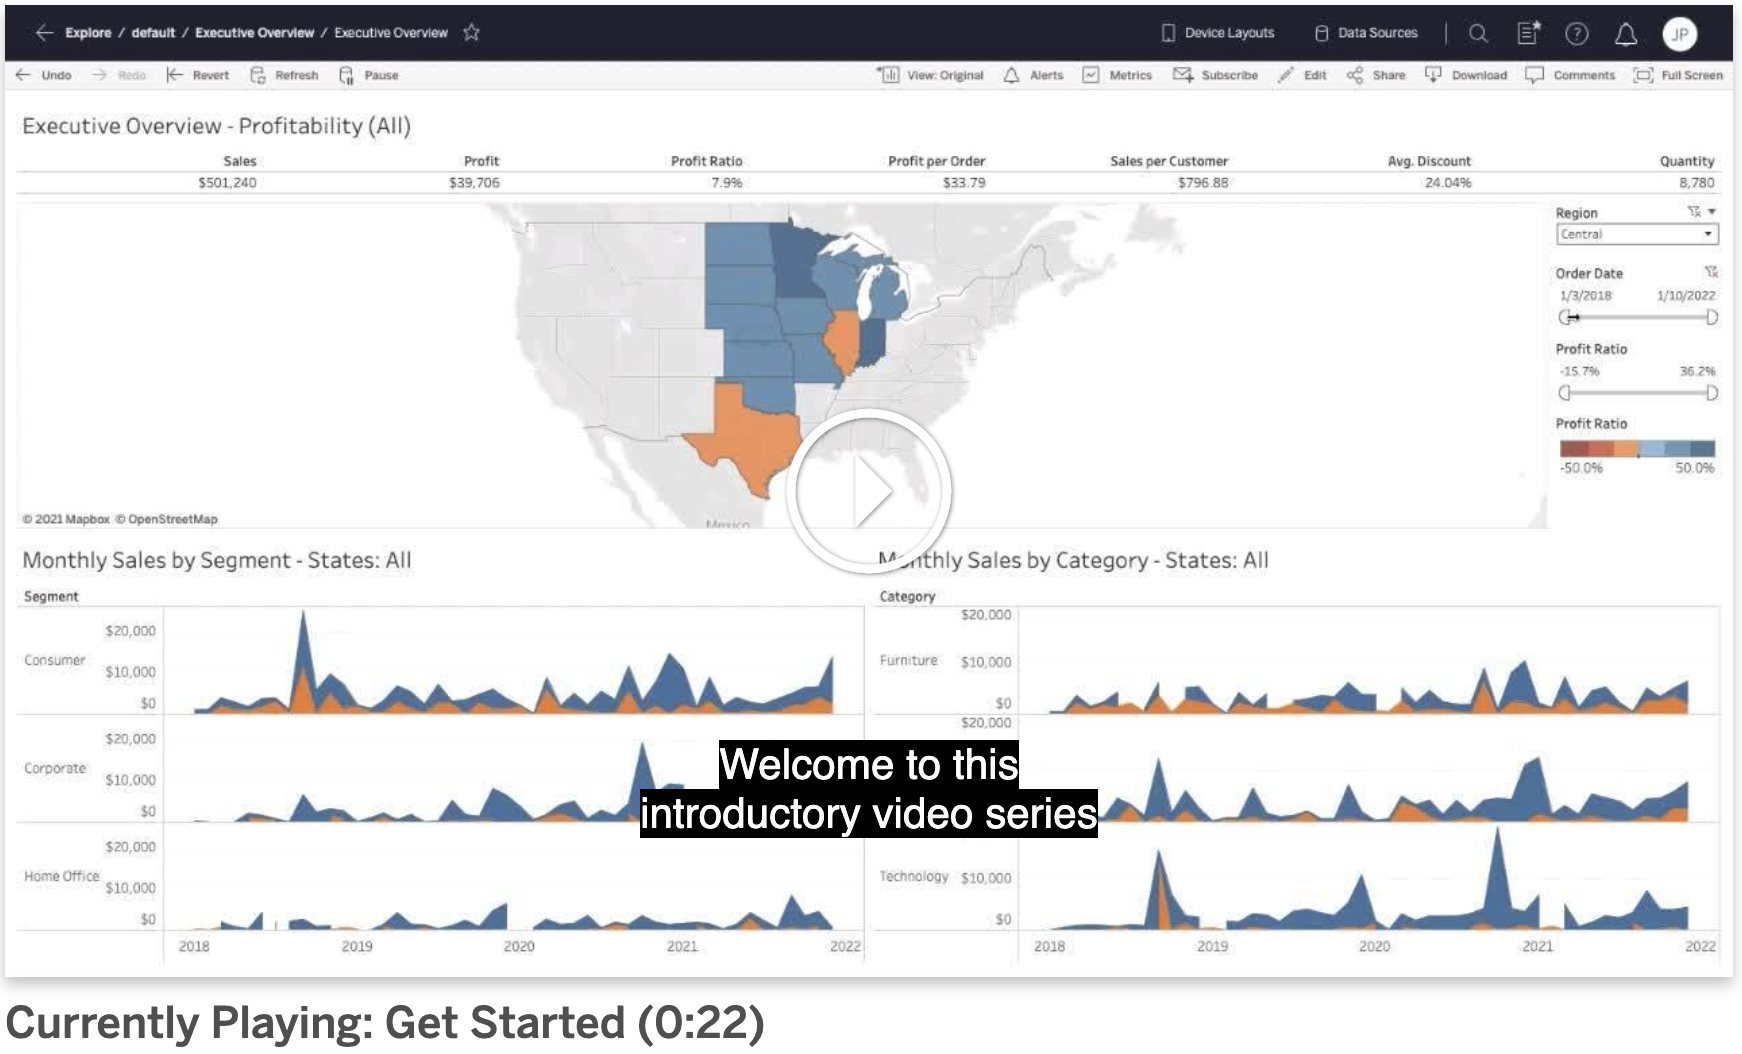
There are several short videos on the Tableau Public website that walk you through how to get started, connect to data, navigate the workspace, create an interactive map, build a dashboard and more. Take a look. Most of these videos are under 3 minutes long.
Videos are available in 11 different languages. To select your preferred language, use the drop-down menu at the bottom of the page.
You can also find sample data sets and, if you scroll to the bottom of this page, see a list of data set sources and web data connectors. Basically, if there’s a topic you’re interested in learning more about, there is probably a data set available to analyse too.
Once you’ve watched a few tutorial videos such as Get Started (0:22), Connect to Data (2:06) and Navigate the Workspace Area (2:17), you are ready to connect to a data set and start analysing it.
Where can I get help as I’m learning new data skills?
There are several resources created for the community by the community to help you learn new skills in Tableau Public. Here are a few we recommended as you’re getting started:
- The Tableau Student Guide - The brainchild of former Tableau Student Ambassador Maria Brock, the Tableau Student Guide offers a number of useful resources that explore in-product features, basic chart types, projects and more. (Recommended for beginners)
- Back 2 Viz Basics - Co-led by Tableau Public Ambassadors Eric Balsh and Elisa Davis, Back 2 Viz Basics is a community project that will help you build foundational knowledge using Tableau. Every other week, a new data set is published for you to practise building your own vizzes. (Recommended for beginner-intermediate learners)
- Workout Wednesday - Co-founded by Andy Kriebel and Emma Whyte in 2017, Workout Wednesday is a weekly challenge to recreate data visualisations across a variety of different topics. (Recommended for intermediate-advanced learners) Pro tip: Over the years, many Tableau Public authors have led and contributed to this project. If you’re looking for additional authors to learn from, consider following a few of them on Public.
See a data visualisation on Tableau Public that you want to know more about? Check to see if the viz is available for download or try clicking through to the person’s profile and looking to see what other information they’ve included on their profile page. They often will have links to LinkedIn, Twitter, personal blogs and so forth, with ways to find out more about them and their work, and even connect one-on-one.
In our next blog in this series, we will delve further into Tableau community projects and more ways to connect with the DataFam. To stay up to date, follow us on Twitter.
Related stories

DataFam Roundup June 2026

DataFam Roundup May 2026

Iron Viz 2026: Read Between the Data
 28 May, 2026