Best of the Tableau Web: Viz in Tooltip selector, quadrant square charts, and the importance of iteration
We've rounded up the latest and greatest from the Tableau community! Learn all the tips, tricks, code, and more from January.


Our Tableau blogging community did not disappoint in January! Check out a few highlights.
As a parent of two unruly daughters, I personally love Adam Crahen’s blog post on the ingenious marriage of parenting, Alexa, IFTTT, and Tableau to create a way for tracking his kids’ behavior. Not only is it a smart use of modern technology, it shows us how data can be used in all walks of life, not just at work. See this as a call to arms – what methods have you used to integrate smart technology to quantify your daily life? Let us know in the comments, or tweet me at @acotgreave.
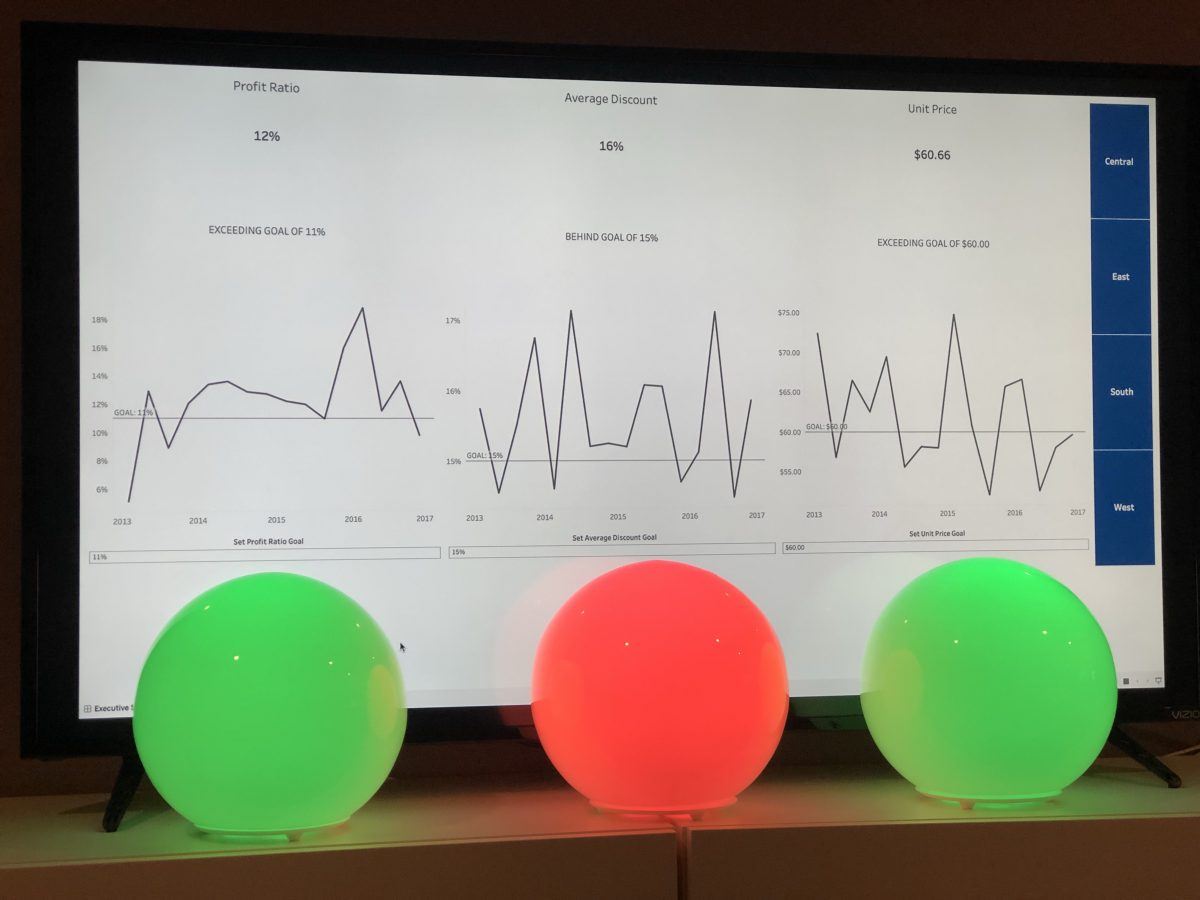
As the Tableau platform grows, I’m also delighted to see people sharing their explorations beyond the desktop. For the coders, we’ve got great posts about integrating Tableau with Python. For instance, Ann Jackson’s integration of Tableau and smart light bulbs is clever and practical. Tamas Foldi shows us how easy it is to integrate live currency conversions into your dashboards. And Ken Black’s analysis of the Hyper Data Engine speeds is excellent. With the new extensions API, and Project Maestro (our amazing new data prep product) around the corner, there’s a big opportunity to blog about more diverse topics in future months.
There are also some really thoughtful posts from people considering what data visualization is all about. Mark Bradbourne’s post on iteration is really important. Why? One lesson I’ve learned over 10 years of using Tableau is that when you think your viz is finished, it’s time to show it to someone else, because other people are better judges and have useful input. Never develop a viz in isolation: always seek feedback and iterate.
Keep on blogging!
Tips and tricks
Ryan Sleeper Tableau UI Tip 1: How to Create a Custom Top Navigation
VIZJOCKEY MakeoverMonday #1/2018
Data Revelations Intra-question analysis –Cut and filter any question by any other question (Part 1)
learningtableaublog #TakeapartTuesday – Shading between lines
Drawing with Numbers Creating Lists of Values for Tableau from Text & Excel Sources
Sarah Loves Data How to Dynamically Colour Tooltip Text in Tableau
The Data Duo Mobile UX – Creating Buttons for Parameters
Practical blog for Viz Enthusiasts WorkoutWednesday S02 E1
Data + Tableau + Me Creating a 4 Quadrant Square Chart
Vizible Difference #TweakThursday 36: Designing for Viz-in-Tooltip
Joe Macari Showing multiple percentages over multiple categories
Inspiration
Jackson Two The Remaining 25 Weeks of #WorkoutWednesday
Pixel Mixer Anatomy of a Viz - The Level is in the Details
Data Revelations Intra-question analysis –Cut and filter any question by any other question (Part 2)
mikevizneros Wait But Why?
TableauFit 5 Hacks for Learning (Tableau, Alteryx, or anything else) in the New Year
Sons of Hierarchies Building your own Style
POINTS OF VIZ We Don’t Need Another Zero
Questions in Dataviz What alternative ways are there for visualising timelines?
3danim8 Benchmark Results of the Tableau Hyper Data Engine
Ken Flerlage Creating a 3D Star Map in Tableau
Sons of Hierarchies The Importance of Feedback and Iteration
The Data Duo Using Siri or Alexa with IFTTT, Google Sheets & Tableau (IoT)
Jedi
Drawing with Numbers Using a Filter Action as a Parameter
SirVizALot How To: Conditional Viz in Tooltip Selector with Tableau
David Sanchez Revelations – densification using bins and Index in Tableau. Case in point: normal distribution.
Data + Tableau + Me Filter Actions as Parameter = New Tableau UX Options
Related stories

DataFam Roundup June 2026

DataFam Roundup May 2026

Iron Viz 2026: Read Between the Data
 28 May, 2026