DataFam Roundup: June 12 - 16, 2023


Welcome! Dig into this week's DataFam Roundup—a weekly blog that brings together community content all in one post. As always, we invite you to send us your content—and the DataFam content from your peers that have inspired you! Find the content submission form here.
Data Pride
#DataPride today, and every day. We’re almost halfway through Pride Month, and there are still plenty of ways to celebrate our diverse community. Join us!
Explore the Tableau Public Pride Viz Gallery which highlights visualizations that honor, recognize, and tell the stories and experiences of the LGBTQ+ community through data.
Attend our Data + Diversity event on Thursday, June 29th at 9am PT as we examine the intersection of data and human rights and celebrate our LGBTQ+ community.
Participate in a Tableau Community challenge:
- Back 2 Viz Basics has 2 recent data viz challenges in collaboration with the Data Pride Tableau User Group.
- Analyze the locations of the “YOU ARE LOVED” billboards through a map challenge. These billboards were first created by Rae Senarighi for FairWisconsin and GSafe, two Wisconsin organizations working for LGBTQ+ rights throughout the state. Today, they are spread across 300 locations.
- Build a table using Lambda Literary Awards Finalists & Winners. The Lambda Literary Awards, also known as the “Lammys,” are prestigious literary awards that recognize and celebrate outstanding works of literature that explore LGBTQ+ themes, experiences, and identities across various genres, including fiction, non-fiction, poetry, and more.
- Diversity in Data is visualizing LGBTQ+ representation in film this month using a number of smaller data sets which includes a breakdown of sex and ethnicity.
Add your pronouns to your Tableau Public profile: Make your Tableau Public profile shine by adding your pronouns.
Community Highlight
To recognize new and consistent Tableau contributors—we’re excited to have a section within the weekly DataFam Roundup called the Tableau Community Highlight. Find out how to get involved.

Andy Holt, Visualization Lead at Woolworths
Parrearra, Australia
Andy Holt is the Visualization Lead at Woolworths. He stays active in the Tableau Community through the Brisbane Tableau User Group and Analytics Tableau User Group.
As a Tableau user for over 12 years, Andy has experience teaching Tableau in a variety of settings. He has worked both as an accredited trainer and in more informal teaching roles such as his current role: leading a group of developers who are new in their Tableau journey. Through this role, Andy gets to serve as an on-call trainer and mentor everyday.
To foster a community around Tableau at Woolworths, Andy also is involved in an internal Tableau User Group called the Woolworths Gladiators, in addition to the Brisbane Tableau User Group. He enjoys attending and supporting others in their presentations but also presenting and sharing his own knowledge and experience at both forums. Check out Andy’s latest presentation at the Brisbane TUG.
Connect with Andy on Linkedin, Twitter, and Tableau Public.
DataFam content
Dive into content created by the Tableau Community:
-
Brandi Beals: Pagination in Tableau (even when exporting to PDF)
-
Adam Mico: Unlocking Your Potential: Soaring Beyond the Data Analyst Role
-
Solomon Kahn: The Data Leadership Collaborative: AI + Data: 5 Ways to Maximize Your Impact
-
Kira Wetzel and Yanwen Chen: The Data Leadership Collaborative: Seven Strategies to Level Up Your Data Talent
-
Steve Wexler: Likert Scale Questions the Zvinca Way - Data Revelations
-
Nicole Mark and Ally W: Women in DataViz: How to account for missing states in a Tableau map
-
Mike Cisneros, Storytelling with Data: showing the insights vs. showing off
-
Tim Ngwena, Tableau Tim: Tableau Public Search - Find Tableau inspiration for anything.
-
Liyana Johan: Using Data Analytics to see which horoscope pairings have the highest divorce rates!
Team Tableau
-
2023 Tableau Ambassador nominations and applications are open
-
Celebrate diversity by adding pronouns to your Tableau Public profile
-
Use this viz to find data viz creators available for hire on Tableau Public
-
2023 Iron Viz finalists made earth their viz-ness at Tableau Conference
-
Closing the (ideas) loop: Update re. Tableau product ideas, features & releases
Upcoming events and community participation
-
Michelle Frayman, Zak Geis and Nicole Klassen: Viz Feedback Office Hours
-
Data + Diversity: Using Data for Human Rights Advocacy: Virtual Event - Join us for our Data + Diversity event as we examine the intersection of data and human rights advocacy and celebrate our diverse community.
-
Connected Communities LATAM on June 22: This virtual community conference will bring together regional communities across Tableau, MuleSoft, Slack, and Salesforce to showcase the power of community collaboration.Come learn from community leaders and share your expertise to help other communities learn the basics of Tableau and more!
-
When: June 22, 11 am-6 pm PT
-
Languages: Spanish and Portuguese
-
-
Data Book Club: This spring we'll be reading Avoiding Data Pitfalls: How to Steer Clear of Common Blunders When Working with Data and Presenting Analysis and Visualizations by Ben Jones.
-
TrailblazerDX ’23 Tableau Quest: Leverage the power of data with the world’s leading analytics platform to drive better business decisions.
-
Community Calendar and Upcoming Events: stay up-to-date on the latest Women in Dataviz events and other data visualization-related events. If you'd like to submit an event to the calendar, please fill out this form.
Vizzes
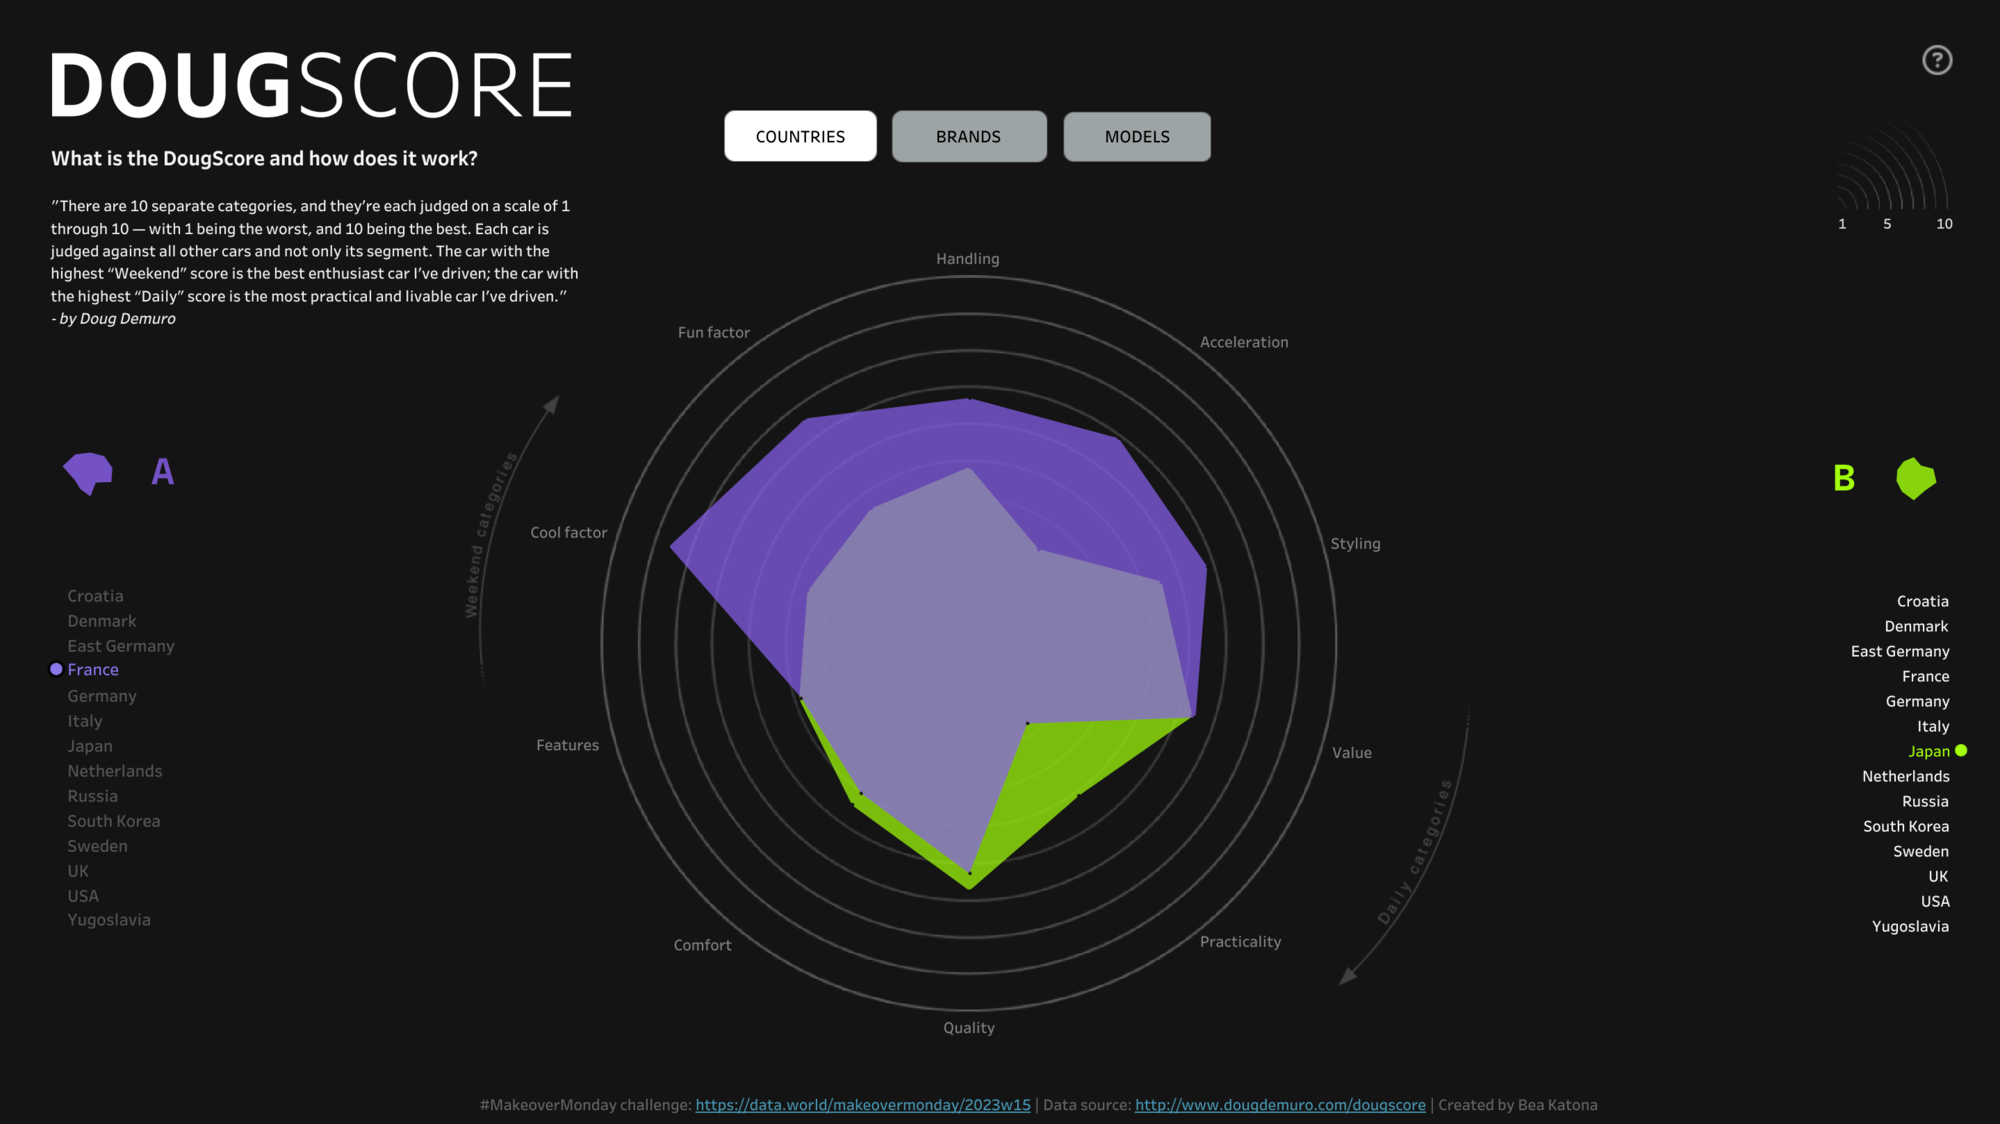
Bea Katona: The DougScore | #MakeoverMonday 2023w15
See the latest Viz of the Day, trending vizzes, featured authors, and more on Tableau Public.
Check out some inspirational vizzes created by the community:
-
Jacob Rothemund: Netflix vs Spotify Historical Stock Price
-
Adedamola (Damola) Ladipo: Nigerian Heads of State
-
Alexander Varlamov: NYC Airbnb Listings
Community Projects
Back 2 Viz Basics
A bi-weekly project helping those who are newer in the community and just starting out with Tableau. Not limited just to newbies!
Web: Back 2 Viz Basics
Twitter: #B2VB
Week 11: Build a Map
Workout Wednesday
Build your skills with a weekly challenge to re-create an interactive data visualization.
Web: Workout Wednesday
Twitter: #WOW2022
Week 24: Can you build a mobile KPI app?
Makeover Monday
A weekly social data project.
Web: Makeover Monday
Twitter: #MakeoverMonday
Week 24: Global Cereal Production
Preppin' Data
A weekly challenge to help you learn to prepare data and use Tableau Prep.
Web: Preppin’ Data
Twitter: #PreppinData
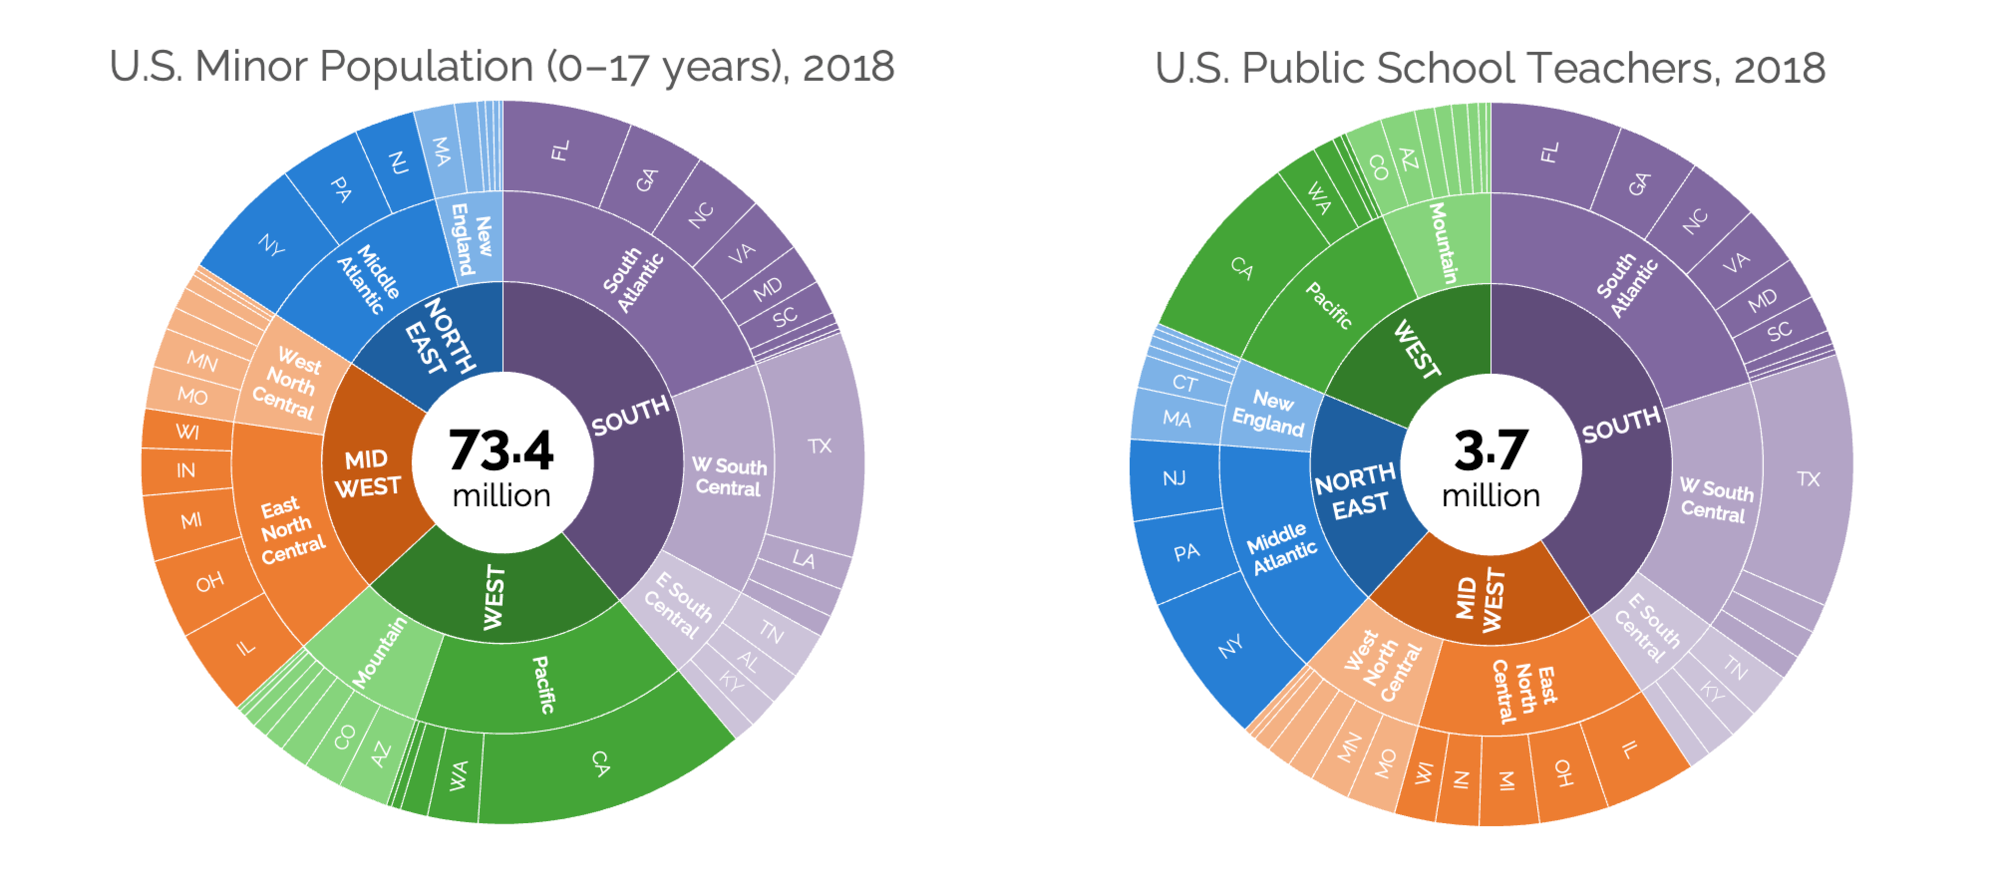
Week 24: Is it the teacher or the student? Part II
DataFam Con
A monthly challenge covering pop culture and fandoms.
Web: DataFam Con
Twitter: #DataFamCon
April 2023: Kids Month!
EduVizzers
A monthly project connecting real education data with real people.
Web: Eduvizzers
June 2023: OECD Programme for International Student Assessment
Games Night Viz
A monthly project focusing on using data from your favorite games.
Web: Games Nights Viz
Twitter: #GamesNightViz
Level 6: The Final Boss
Iron Quest
Practice data sourcing, preparation, and visualization skills in a themed monthly challenge.
Web: Iron Quest
Twitter: #IronQuest
Advanced Chart Types
Storytelling with Data
Practice data visualization and storytelling skills by participating in monthly challenges and exercises.
Web: Storytelling with Data
Twitter: #SWDChallenge
June 2023: fun with fonts
Project Health Viz
Uncover new stories by visualizing healthcare data sets provided each month.
Web: Project Health Viz
Twitter: #ProjectHealthViz
June 2023: Funding for Research for Various Conditions and Diseases
Diversity in Data
An initiative centered around diversity, equity & awareness by visualizing provided datasets each month.
Web: Diversity in Data
Twitter: #DiversityinData
May 2023: Mental Health Awareness Month
Sports Viz Sunday
Create and share data visualizations using rich, sports-themed data sets in a monthly challenge.
Web: Sports Viz Sunday
Twitter: #SportsVizSunday
January 2023: Is it a Sport or a Game?
Viz for Social Good
Volunteer to design data visualizations that help nonprofits harness the power of data for social change.
Web: Viz for Social Good
Twitter: #VizforSocialGood
June 9 - July 18, 2023: Gord Downie & Chanie Wenjack Fund
Real World Fake Data
Create business dashboards using provided data sets for various industries and departments.
Web: Real World Fake Data
Twitter: #RWFD
Session 5: Diversity Score Card
Data Plus Music
A monthly project visualizing the data behind the music we love!
Web: Data Plus Music
Twitter: #DataPlusMusic
相關文章

DataFam Roundup June 2026

DataFam Roundup May 2026

Iron Viz 2026: Read Between the Data
 2026/05/28