Announcing support for Amazon Redshift Spectrum (external S3 tables) in Tableau 10.4!


We’re excited to announce an update to our Amazon Redshift connector with support for Amazon Redshift Spectrum (external S3 tables). This feature was released as part of Tableau 10.3.3 and will be available broadly in Tableau 10.4.1. In Tableau, customers can now connect directly to data in Amazon Redshift and analyze it in conjunction with data in Amazon Simple Storage Service (S3).
This connector was a direct result of joint engineering and testing work performed by the teams at Tableau and Amazon Web Services (AWS). Following other connectors to Amazon Redshift, Amazon EMR, and Amazon Athena, this is yet another market-leading integration with the AWS analytics platform. Tableau Server also runs seamlessly in Amazon’s cloud infrastructure so the customers who prefer to deploy all of their applications inside AWS have a complete solution offering from Tableau.
How does support for Amazon Redshift Spectrum help customers?
Many Tableau customers have large buckets of data stored in Amazon S3. If this data needs to be accessed frequently and stored in a consistent, highly structured format, then you could provision it to a data warehouse like Amazon Redshift. If you want to explore this S3 data on an ad hoc basis—to determine whether or not to provision it and where—you could use Amazon Athena, a serverless interactive query service from AWS that requires no infrastructure setup and management.
But what if you want to analyze both the frequently-accessed data stored locally in Amazon Redshift AND your full data sets stored in Amazon S3?
What if you want the throughput of disk and sophisticated query optimization of Amazon Redshift AND a service that combines a serverless scale-out processing capability with the massively reliable and scalable S3 infrastructure?
What if you want the super fast performance of Amazon Redshift AND support for open storage formats (e.g. Parquet, ORC) in S3?
To enable these “ANDs” and resolve the tyranny of OR’s, AWS launched Amazon Redshift Spectrum earlier this year.
Amazon Redshift Spectrum provides the freedom to store data where you want, in the format you want, and have it available for processing when you need it. Since the Amazon Redshift Spectrum launch, Tableau has worked tirelessly to provide best-in-class support for this new service, allowing customers to extend their Amazon Redshift analyses out to the entire universe of data in their S3 data lakes
Several customers have already experienced success with this connector, including Sysco, the world’s largest food product distributor.
Let’s explore how Tableau works with Amazon Redshift Spectrum. In this example, I’ll also show you how and why you might want to connect to your AWS data in different ways, depending on your use case.
The experiment
I’m using the following pipeline to ingest, process, and analyze data with Tableau on an AWS stack.
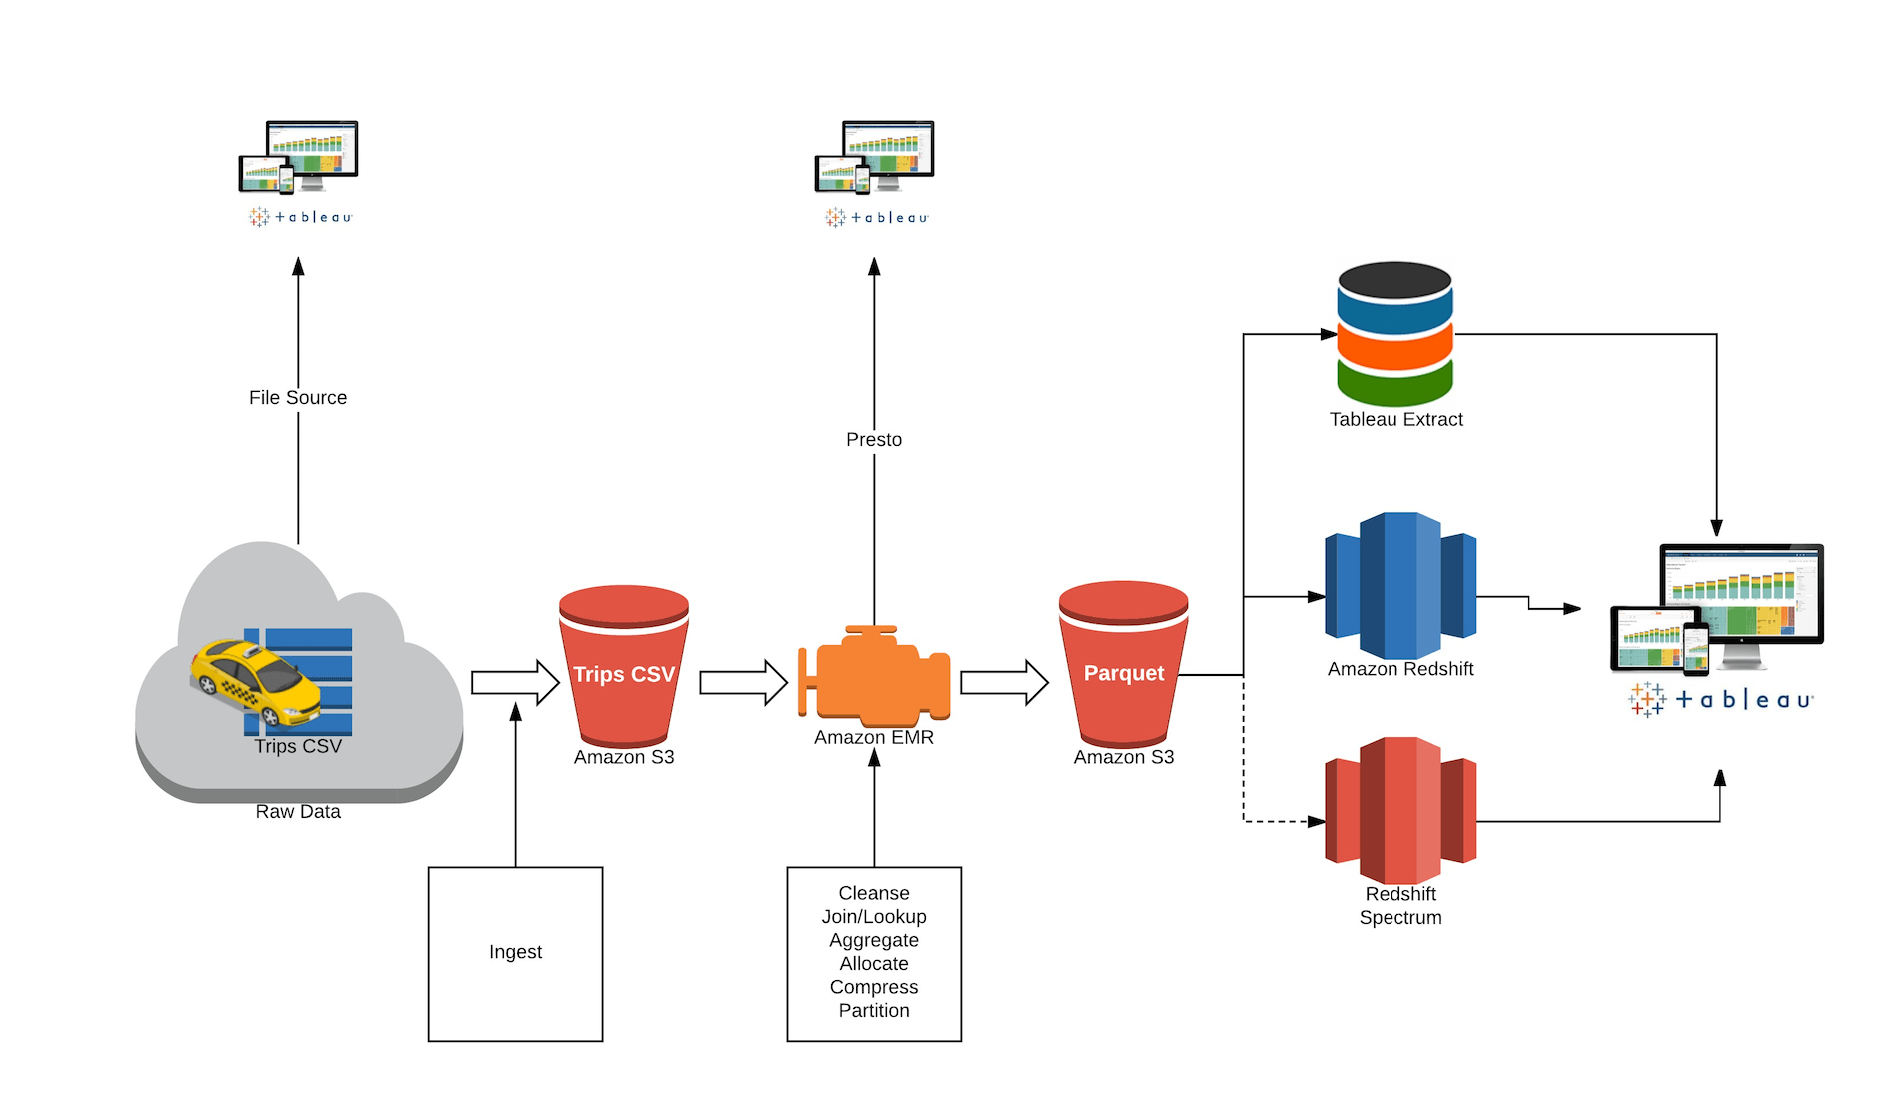
In this example, I’ll use the New York City Taxi data set as the source data. The data set has nine years’ worth of taxi rides activity—including pick-up and drop-off location, amount paid, payment type—captured in 1.2 billion records.
The data lands in S3. It is cleansed and partitioned via Amazon EMR and converted to an analytically optimized columnar Parquet format.
Note that you can point Tableau to the raw data in S3 (via Amazon Athena) as well as access the cleansed data with Tableau using Presto via your Amazon EMR cluster. Why might you want to use Tableau this early in the pipeline? Because sometimes you want to discover what’s out there and understand some questions worth asking before you even start the analysis.
Once you discover those questions and determine if this sort of analysis has long-term advantages, you can automate and optimize that pipeline, adding new data as soon as it arrives so you can get it to the processes and people that need it. You may also want to provision this data to a highly performant “Hotter” layer (Amazon Redshift or a Tableau extract) for repeated access.
As represented in the flow above, S3 contains the raw, denormalized taxi ride data at the timestamp level of granularity. This is the fact table. Amazon Redshift has the time dimensions broken out by date, month, and year, along with the taxi zone information.
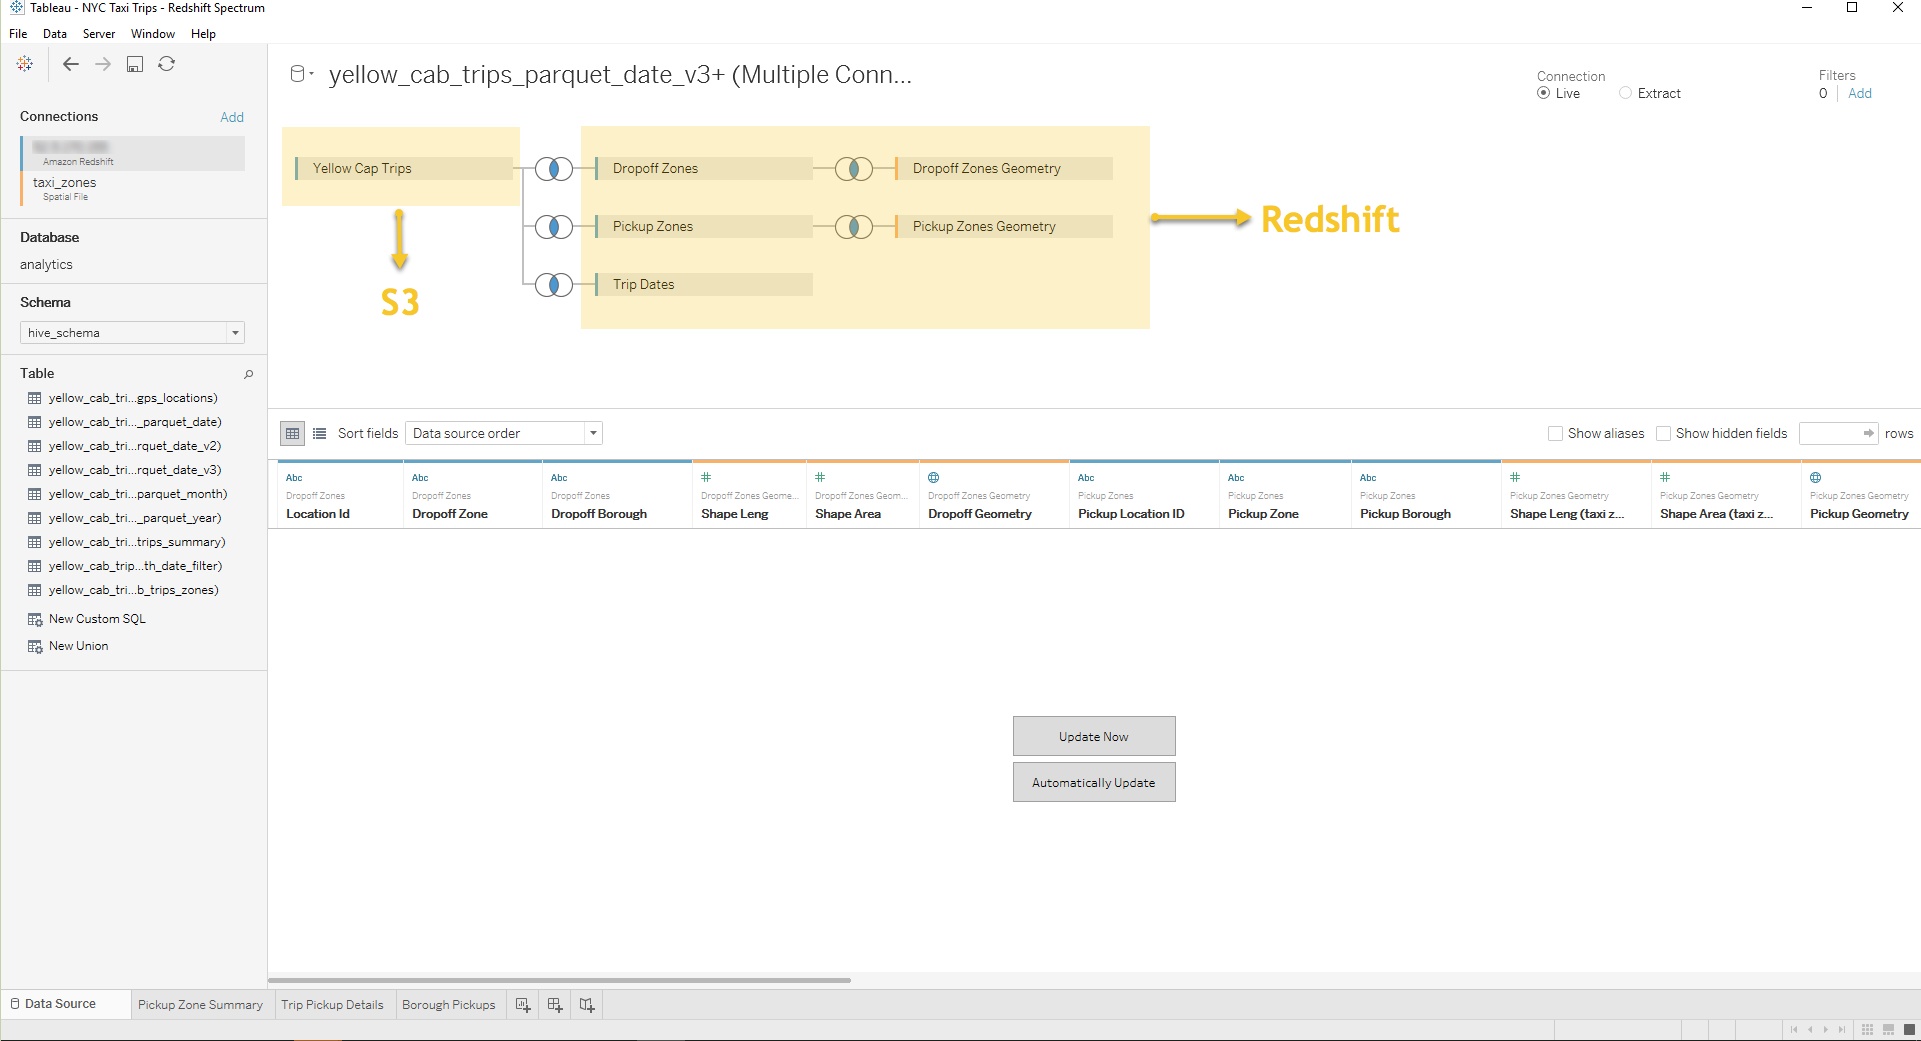
Now let’s imagine that I’d like to know where and when taxi pickups happen on a certain date in a certain borough. With support for Amazon Redshift Spectrum, I can now join the S3 tables with the Amazon Redshift dimensions.
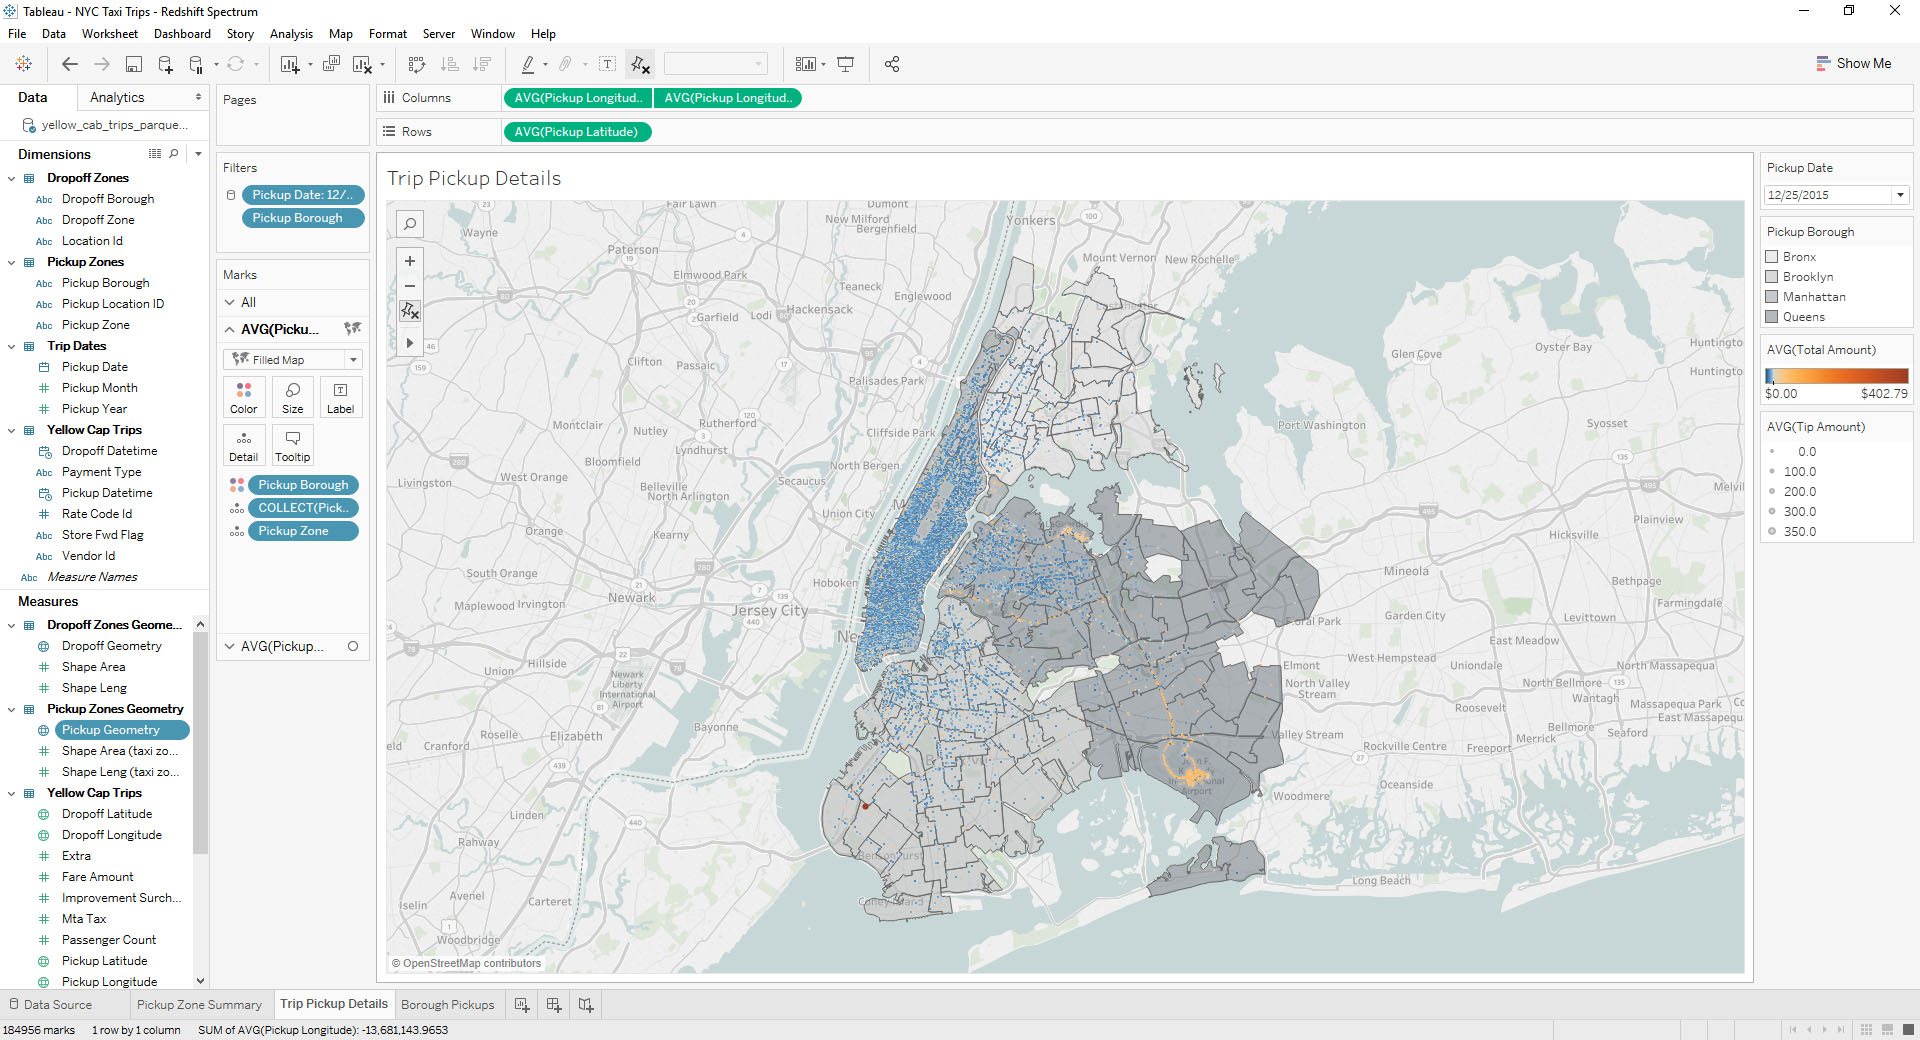
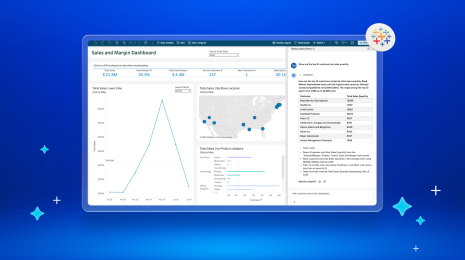
I can then analyze the data in Tableau to produce a borough-by-borough view of NYC ride density on Christmas Day 2015.
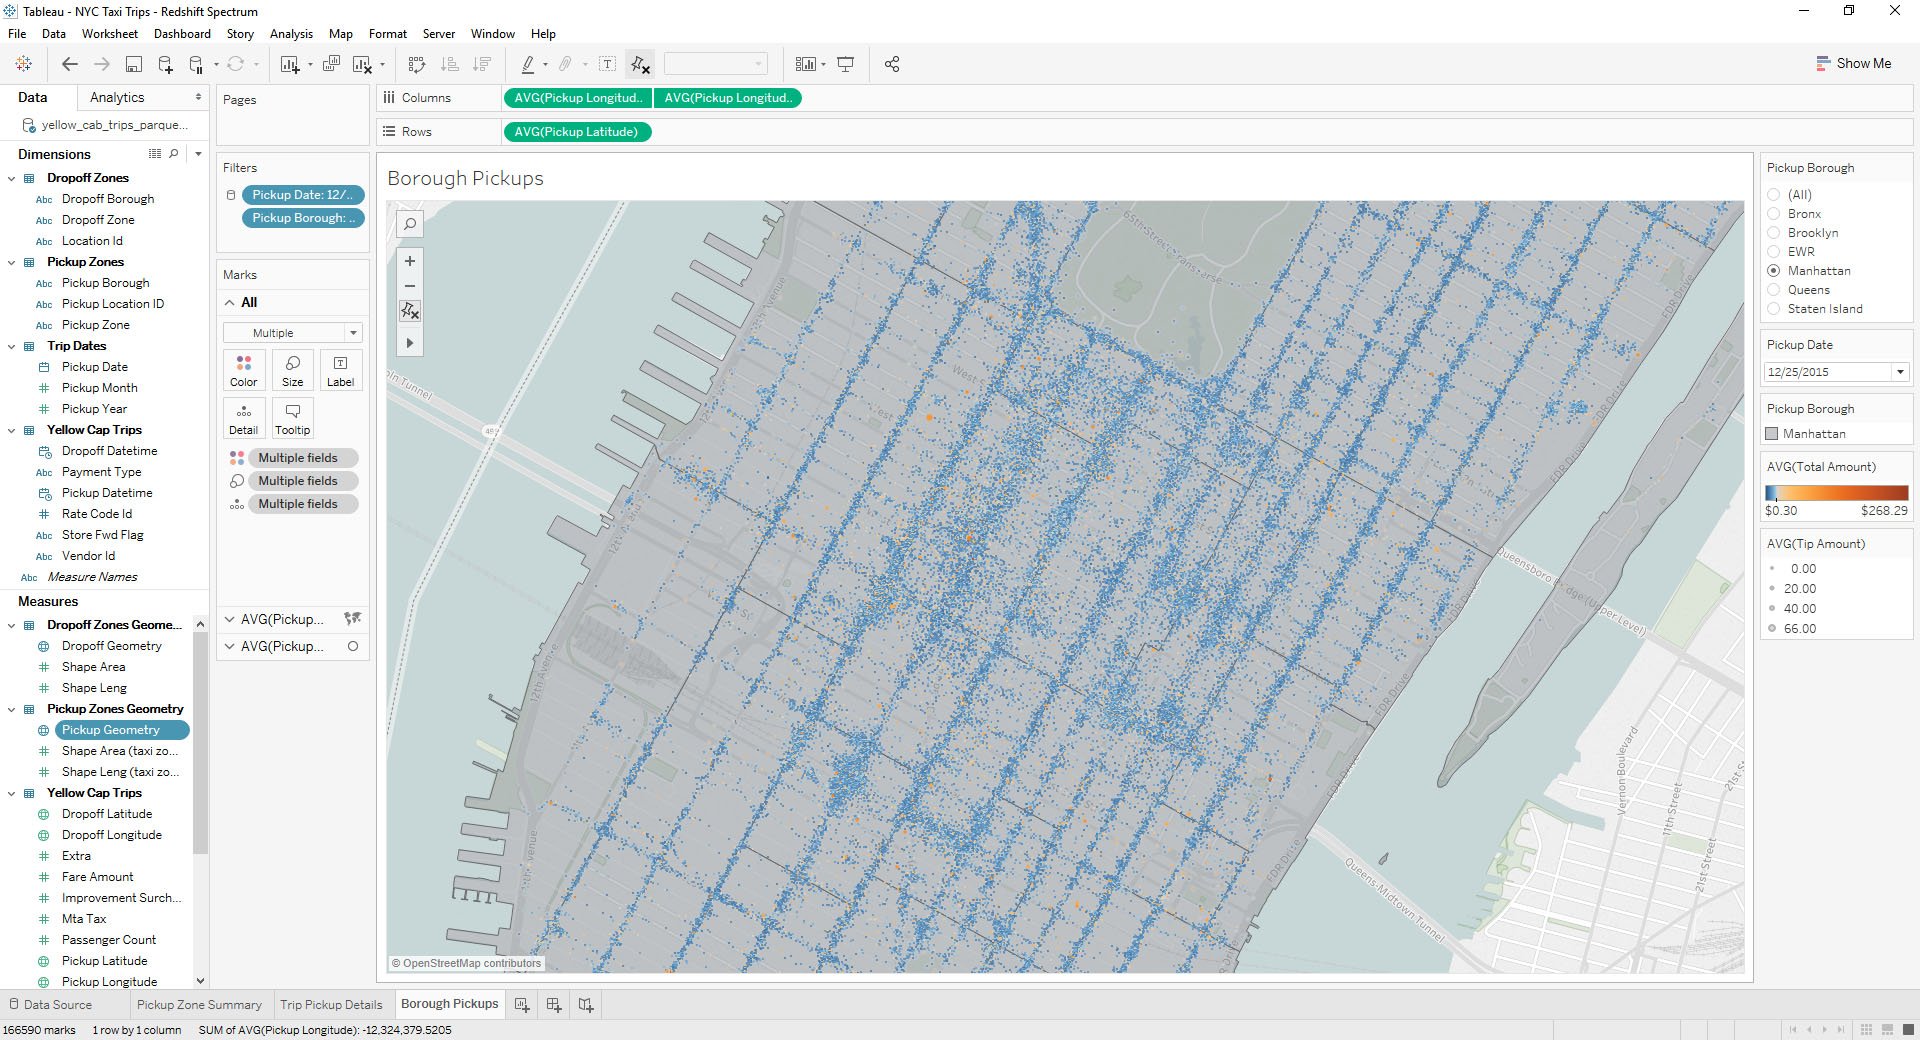
I could also hone in on just Manhattan to identify pick up “hotspots” where ride charges appear way higher than average.
With Amazon Redshift Spectrum, you now have a fast, cost-effective engine that minimizes data processed with dynamic partition pruning. Further improve query performance by reducing the data scanned. You could do this by partitioning and compressing data and by using a columnar format for storage.
At the end of the day, your choice of data source that you connect to in Tableau should be based on what variable you want to optimize for. For example, you may choose to connect live to Amazon Athena, Amazon Redshift, Amazon Redshift Spectrum, or bring a subset of your data into a Tableau extract.
Start by considering:
- Cost: Are you comfortable with the serverless cost model of Amazon Athena and potential full scans vs. the advantages of no setup?
- Performance: Do you want the throughput of local disk?
- Setup effort and time: Are you okay with the lead time of a Redshift cluster setup vs. just bringing everything into a Tableau extract?
To meet the many needs of our customers, Tableau’s approach is simple: it’s all about choice. This includes how you choose to connect to and analyze your data.
For more on how to approach data architecture decisions for the enterprise, watch this Big Data Strategy session my friend Robin Cottiss and I delivered at Tableau Conference 2017. We share several examples of companies leveraging the Tableau on AWS platform and provide a detailed run-through of the aforementioned demonstration.
If you’re curious to learn more about analyzing data with Tableau on Amazon Redshift we encourage you to check out the following resources:
- Read this whitepaper for best practices on optimizing and tuning your Amazon Redshift and Tableau Software deployment for better performance
- Check out the The Tableau AWS Modern Data Warehouse Quickstart for an automated AWS-certified reference deployment of Tableau on Amazon Redshift. The Quickstart simplifies the process of launching, configuring, and running projects with the required AWS resources for compute, network, storage and other services while following best practices for security, availability and optimum query performance
- Hear Sysco and Expedia talk about their experiences deploying Tableau on AWS to achieve self-service analytics at AWS re:Invent 2017 in Las Vegas
相關文章
Trusted, Real-Time Insights for All: Tableau Brings Conversational Analytics to Cloud & Server
 2026/07/30
How Tableau is Expanding Access to Agentic Analytics Across the Enterprise
 2026/07/22

What is Tableau Cloud?
 2026/07/21