What is the Tableau Community Project—DataFam Con?


Celebrate everything pop culture and fandoms while growing your data skills through DataFam Con, a Tableau Community data visualization challenge—initiatives created and led by members of the DataFam community for participants to learn, practice, and apply their data skills across a variety of topics, products, and causes. DataFam Con focuses on using data from geek culture—such as tv series, books, films, and conventions—to practice building visualizations on something that you are passionate about.
How did DataFam Con get started?
*NEW DATA CHALLENGE* Welcome to #DataFamCon a collab effort hosted by @NicoleKlassen12 and yours truly.
Each month we will be sharing data on a TV/Film/Book series or fanbase. Get ready to geek out and have fun with us along the way. 🖖https://t.co/gPnmwhGeeL
— Christina P. Gorga (@StyleSTEAMed) February 16, 2022
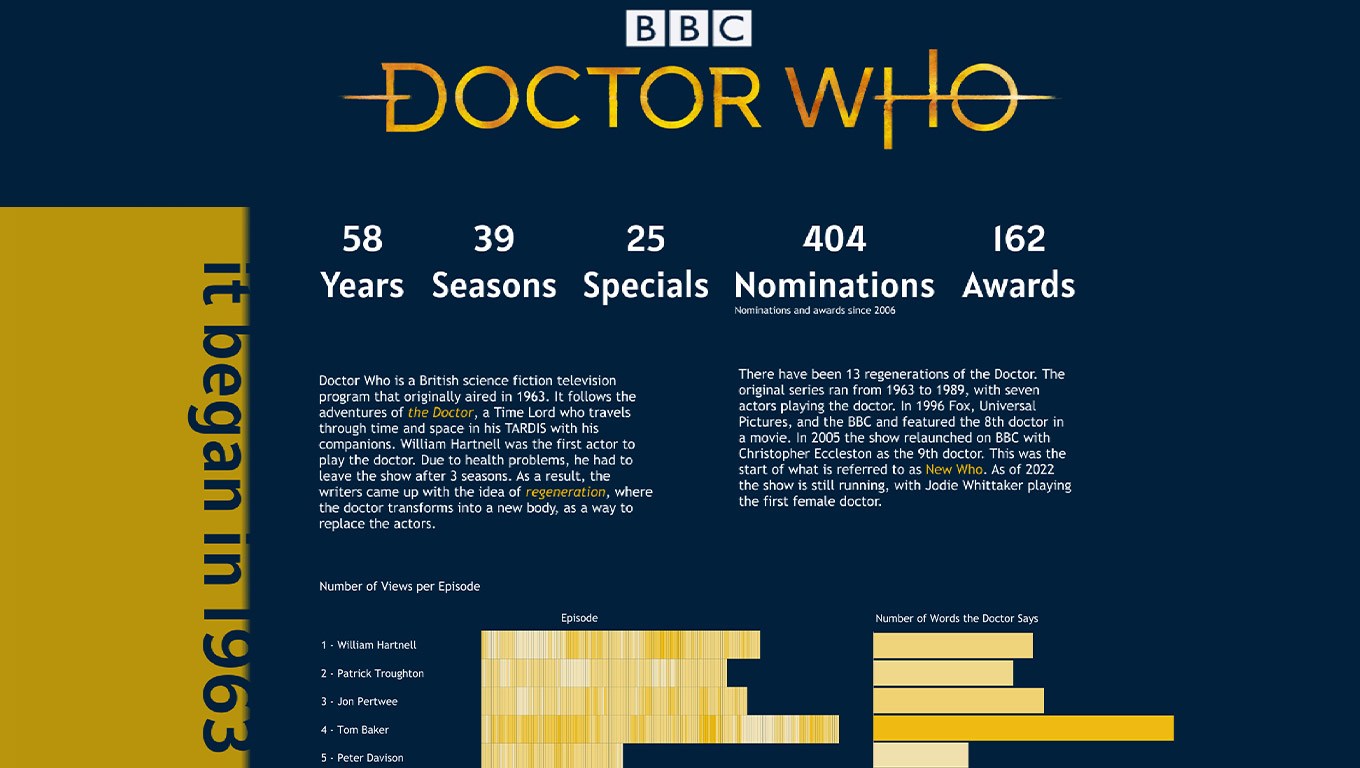
Back in December 2021, Tableau Visionary HOF Bridget Cogley put out a call to the DataFam to create new initiatives. Through discussions on Twitter, Tableau Social Ambassador Christina Gorga was inspired to organize a data challenge that was more niche than the current active data challenges. Christina was drawn to visualizations centered around pop culture, specifically Nicole Klassen’s Doctor Who Synopsis visualization. This sparked a desire to create a centralized effort for those who love talking about pop culture and fandoms and want to grow their data skills. Christina reached out to Nicole and together, they launched DataFam Con in February 2022. Shortly after the data challenge made its debut, Michelle Frayman, Lawrence Durbin and Preethi Lodha were added to the team.
Who can participate in DataFam Con?
This project welcomes participants who want to celebrate and visualize something they love. Nicole says, “Anything that you love is a fandom—so this is for anyone in the DataFam.” It is designed for you to practice the entire process of building a data visualization.
How do I participate in DataFam Con and what Tableau skills will I learn?
DataFam Con announces a topic and releases data sets every month. Check out their site or follow the project on Twitter to keep up with the monthly releases.
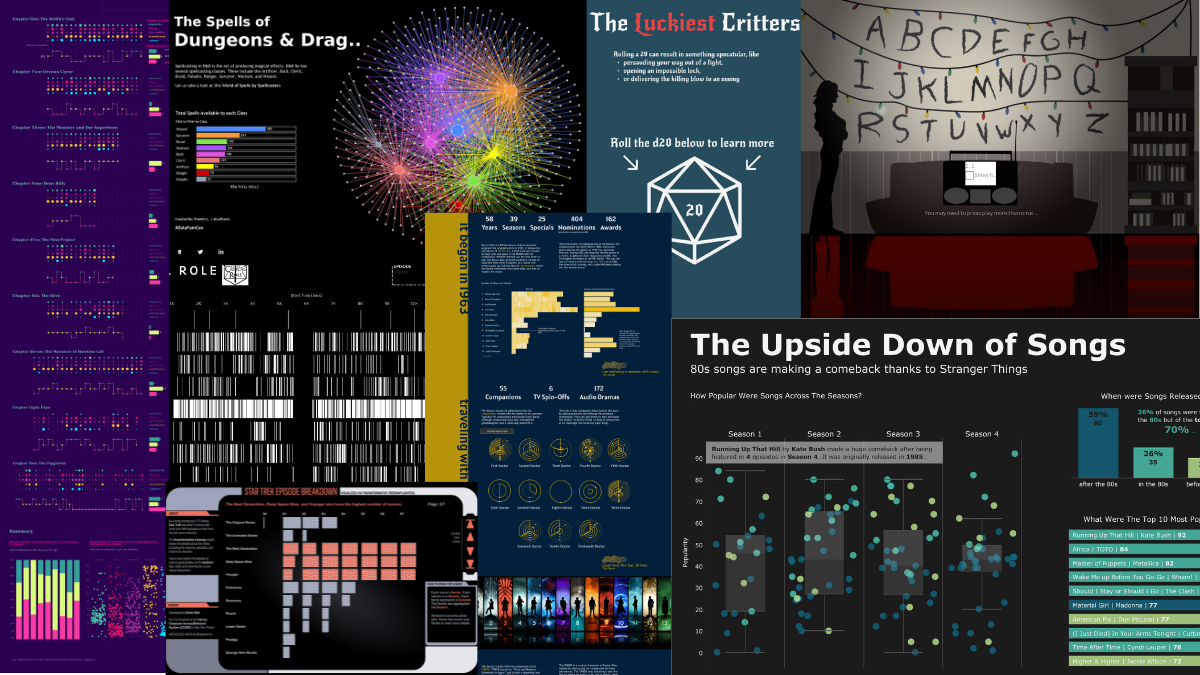
Topics cover a wide range of the geeky world including TV Series, films, books, and even some data about geek culture and conventions. Some previous topics include: Stranger Things, Lord of the Rings, Star Wars, Dungeons and Dragons, and Star Trek.
The goal of this project is to practice working with data and test out skills that you wouldn’t normally use at work. Preethi says, “It’s a great place for people to learn. Not only are you vizzing something you love, but you get to experience building a visualization from start to finish, while getting feedback from the DataFam community.” DataFam Con also collaborates with other Tableau Community projects, such as Back 2 Viz Basics and Preppin’ Data for more skill focused challenges.
The project welcomes participants of all skill levels, with no expectation to create overly complicated and impressive visualizations. Nicole says, “No matter what your viz looks like, if you’re really passionate about the topic, you can feel that come through no matter what you do.”
You’re also welcome to find and use your own data set that aligns to the theme. Lawrence says, “My skills handling, finding and working data have grown tremendously through the challenge.” Once complete, submit your visualization using the project tracker. If you’re on Twitter, use hashtag #DataFamCon to share your work or request for feedback from project leaders.
For a deeper dive into DataFam Con, check out this episode of Behind the Project where Christina, Preethi, Nicole, and Lawrence sat down with Tableau Public Ambassador, Priya Padham to share how being on the DataFam Con team has impacted their Tableau journey, provide a walk through behind Nicole Klassen’s Doctor Who Synopsis visualization, and give reasons as to why you should participate in a challenge.
What are the other Tableau Community Projects?
Tableau Community Projects are a great way to connect with like-minded data people while improving your data skills. Click here to see the complete list of projects that span topics, products, and causes.
相关故事

DataFam Roundup June 2026

DataFam Roundup May 2026

Iron Viz 2026: Read Between the Data
 2026/05/28