Beyond the Dashboard: Facilitating Data Conversations


This is a blog post was co-written by Britta Fiore-Gartland, Melanie Tory, Lyn Bartram , and Anamaria Crisan, and is associated with the paper “Finding their data voice: practices and challenges of dashboard users.” For more information check out the research paper!
Organizations want their employees to use data to drive smarter, more efficient decision-making. And while many organizations are awash in data, fewer are effectively leveraging data within the broader range of workflows and conversations that matter for decision-making. The current tooling ecosystem makes data access possible, but falls short of supporting the wide range of data conversations that need to happen across organizations. In general, dashboards are the primary interface to data for many individuals. They work to engage people in some cases, but in many more cases they stop short of supporting the expressivity, dynamism, and fluidity required for people to have conversations with their data, and for people to position data within decision-making conversations.
For organizations, the spectrum of potential data workers is broad, and yet our understanding of dashboard uses and practices is often limited to individuals that identify as professional analysts. Those that do not identify as analysts are often overlooked because their dashboard uses are deemed too simplistic and their interactions with data are too intermittent. These non-analysts, what we termed “data workers”, are people that use data to support decision-making in their role, but for whom data is not their primary job. We argue that these data workers are an under-recognized and under-served population, and they are essential for organizations that aim to support data-informed decision-making. This gap in knowledge shows up in the research and subsequently in the tools and ecosystems that then fail to support these real work practices and goals with data.
We conducted a research study with a spectrum of data workers that use dashboards (not Tableau-specific) in their work. Our study interviewed 20 professionals that hold diverse roles, from individual contributors to managers, and across different companies, nonprofit organizations, education, and government; for example, market campaign management, product management, operations, and employee success. We draw a distinction between professionals who produce dashboards and other data-driven artifacts for others (termed here as analysts) and people who use those artifacts (dashboard users). We capture and describe the practices, breakdowns, and workaround strategies of dashboard users and characterize their data work as conversations that occur both through and around data. In framing dashboard use as data conversations, we reveal the unmet needs of data workers and propose avenues to resolve them.
Data Conversations
Data and dashboard artifacts serve different roles within organizations. They can function as documentation, in which data highlights the provenance of decision making and can support collaboration by establishing a shared agreement or baseline. They can also function as circulation, distributing data artifacts throughout an organization, making information and ideas accessible across data workers and organizational contexts. Finally, and most pertinent to our research, is the role of data in supporting conversations. When data is conversational it supports sensemaking practices and importantly, it becomes the mode through which new ideas emerge and organizations may begin to change. But this depends on: Who can have a data voice? Who can ask and answer questions with data?
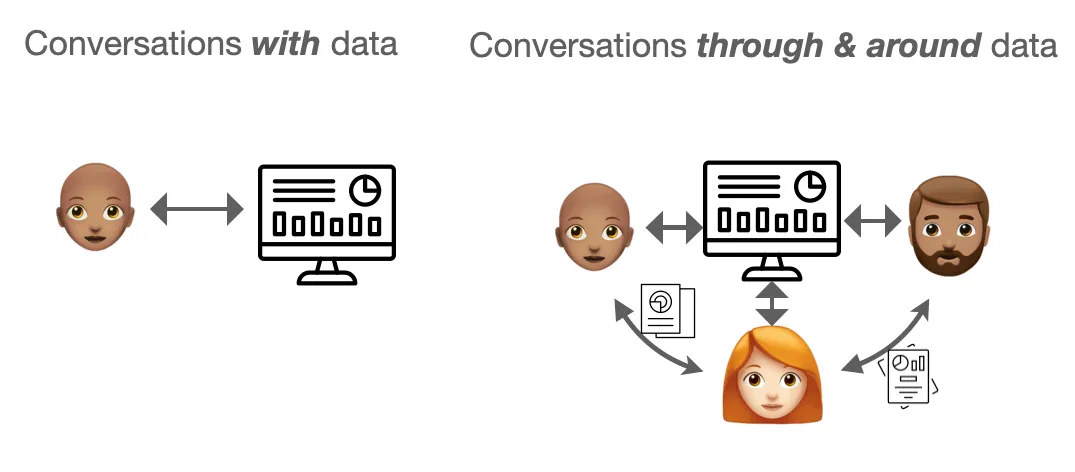
We can further break down these data conversations into categories: those with data, and those through and around data. Conversations with data involve interactions directly between the user and their data (individual analysis work). Conversations through and around data use the data as a medium for conveying information, a story, or a particular view to others. Key here is that people reshape the data and its associated artifacts as a strategy for communication, anticipating the translation necessary for data to jump contexts. Talk around data may generate further questions and insights, lead to actions, or simply support connections among people.
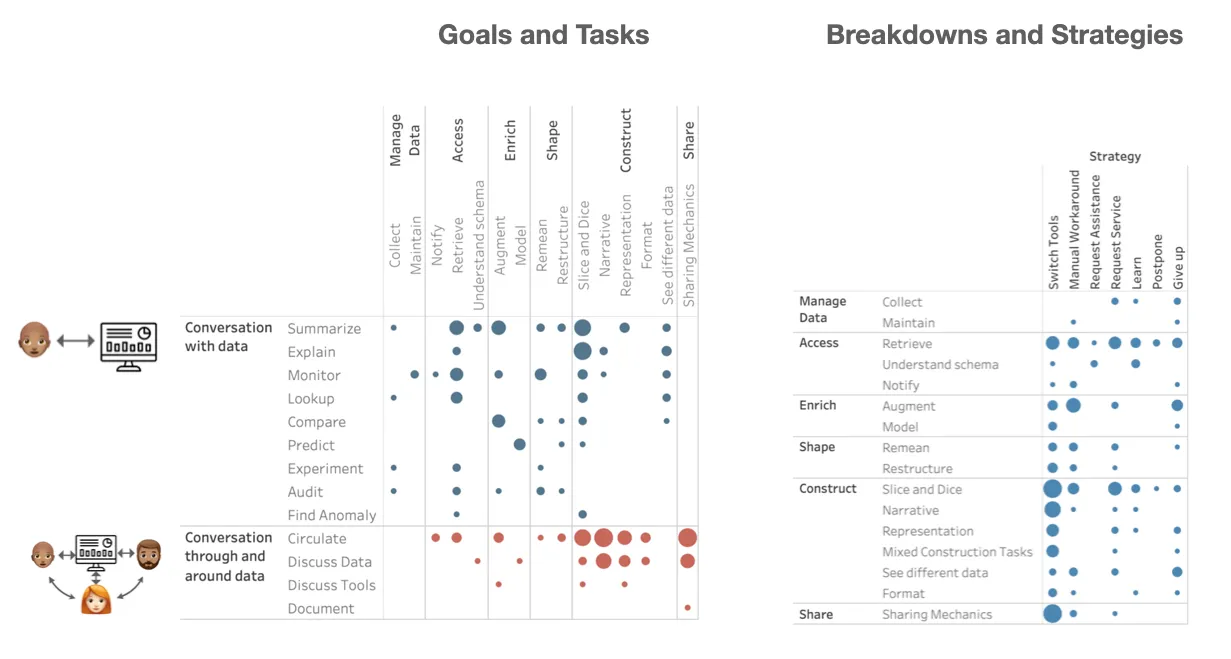
For these data workers, many of their conversations with data include common analysis goals, such as explain, predict, or find anomaly, that overlap with goals that an analyst would have. The difference, however, might be whether they have time or bandwidth to do the work, whether they have the data and analytic skills to do what they need to do, or perhaps they are lucky and have an analyst to support them answering the questions they have with their data. The goals of monitoring, lookup, and summarizing stood out as uniquely important for data workers, and are often overlooked when building tools for analysts.
Through mapping participant tasks to goals we are able to see how tasks contributed toward many goals while others were more specific. For example, data might be sliced and diced (i.e. grouped, filtered, and aggregated) as part of almost any conversation with, through, or around data, whereas data was only modeled to predict or discuss with others. Similarly, participants only bothered to format if the goal was to circulate or discuss. We are also able to see how there are tasks distributed across accessing, enriching, shaping, and construction in addition to sharing when thinking about what data workers do to have conversations through and around data (see Figure 2).
Breakdown and Mitigations
Our study participants aimed to have conversations with, through, and around data, but encountered an array of breakdowns along the way. We used these moments of breakdown, when participants couldn’t complete their task within their current tool, as probes for innovation and cataloged the strategies they employed to mitigate the breakdowns (see Figure 2). We found that even deceptively simple tasks like constructing and sharing insights encountered multiple breakdowns as data workers tried to stitch together customized narratives and format it for presentation that led participants, most commonly, to switch tools, but also do manual workarounds, and unfortunately, give up when tooling didn’t support their task.
A key finding was that data work practices did not follow a linear model of data analysis. Instead these conversations with data often required moving back and forth between tasks, from constructing a narrative back to enriching the data back to sharing and reconstructing that narrative. Both analysts and data workers alike would return to the dashboard and, when applicable, different analysis phases in iterative cycles of refinement to realize their goals and tasks. However, this iterative cycling was especially problematic for data workers when they encountered breakdowns that prevented them from completing their tasks. Because data tools don’t support the full scope of how data workers need to engage with data, when they tried to achieve their goals with data, it often required manual workarounds, data dumps or requesting assistance from an analyst (if they were lucky enough to have one dedicated to their needs). For data workers, data is not their primary job so they may not have advanced levels of data literacy or bandwidth for these more data-intensive tasks and workarounds. The cost of having to stitch together tools and tasks to achieve their goals with data is so high that it means many will find sub-optimal workarounds or abandon their goal entirely.
Addressing Unmet Needs
By attending to the work practices and challenges of data workers, we identified the top breakdowns and unmet needs of data workers. These represent opportunities for better tooling that directly supports the conversations with, around, and through data. These opportunities lie in developing experiences with data that don’t over-rely on the dashboard, but instead invest in highly interactive and flexible tool ecosystems. Rather than one-way communication tools, these tools need to leverage augmentation to enable more proactive monitoring, fluid asking and answering of questions within their workflows and greater ability to construct insights and stories through and around data. There are opportunities to help people more directly see and manipulate data values and records, which provides an easier on-ramp for people to find their data voice.
This study highlighted a core practice for data workers is content creation as a way to share and construct insights for others. There is an opportunity to recognize the value of this work by finding ways to integrate qualitative and quantitative frames to better reflect the way people actually have conversations through and around data. It is not just the what of these conversations that matter for supporting these conversations, but also the when and where. Integrating insights and analytics into current data worker workflows is an unmet need across many industries and job functions.
More people will find their data voice when our tools and systems support the types of conversations not just with data, but through and around. So let’s get to work!
相关故事

Which Model Speaks Your Data Language? A User-Centered Approach to Evaluating LLMs for Conversational Visual Analytics
 2026/04/14
Rethinking How Data Workers Revisit Analytical Conversations and Communicate Insights
 2026/04/10
Stepping through Charted Territory: Creating Interactive Step-by-Step Dashboards Tours
 2025/06/08