Meet Iron Viz 2024 Finalist Chris Westlake
Chris Westlake fell in love with Tableau from the get-go. “I just got completely hooked on the software,” he says. “It was the fun crossover between data and creativity that I didn’t even realize I was looking for. Six years on, Chris has a shot at the Iron Viz title.
“I wasn’t sure what I wanted to do after studying math and statistics at university, other than data in some form, so I took a year out to delay that very big life decision – finding a full-time job!” An internship using SQL for data extraction put Chris in touch with a team well versed in Tableau. “I got introduced to the platform by them and Neil Richards, who is now a Hall of Fame Visionary.”
Neil piqued the Iron Viz interest within Chris. “I liked the opportunity to dive deep into a topic knowing there were loads of other people doing a very similar thing at the same time. And the excitement it generates around the community as a whole is amazing.” When Iron Viz 2019 rolled around, Chris was already a Student Ambassador, spreading the word about Tableau in the academic space. He threw his hat into the ring and has competed ever since. “The freedom offered by Iron Viz is great. Rather than stakeholders telling you what they want to see, you are very much in the driving seat. I still love Iron Viz the fifth time around as much as I did the first time!”
Love was this year’s qualifier theme. “When the love theme was announced, my mind went straight to three things: rugby, food, and my wife – in no particular order! I’ve visualized rugby a lot in the past and I felt I should do something more people could relate to.”
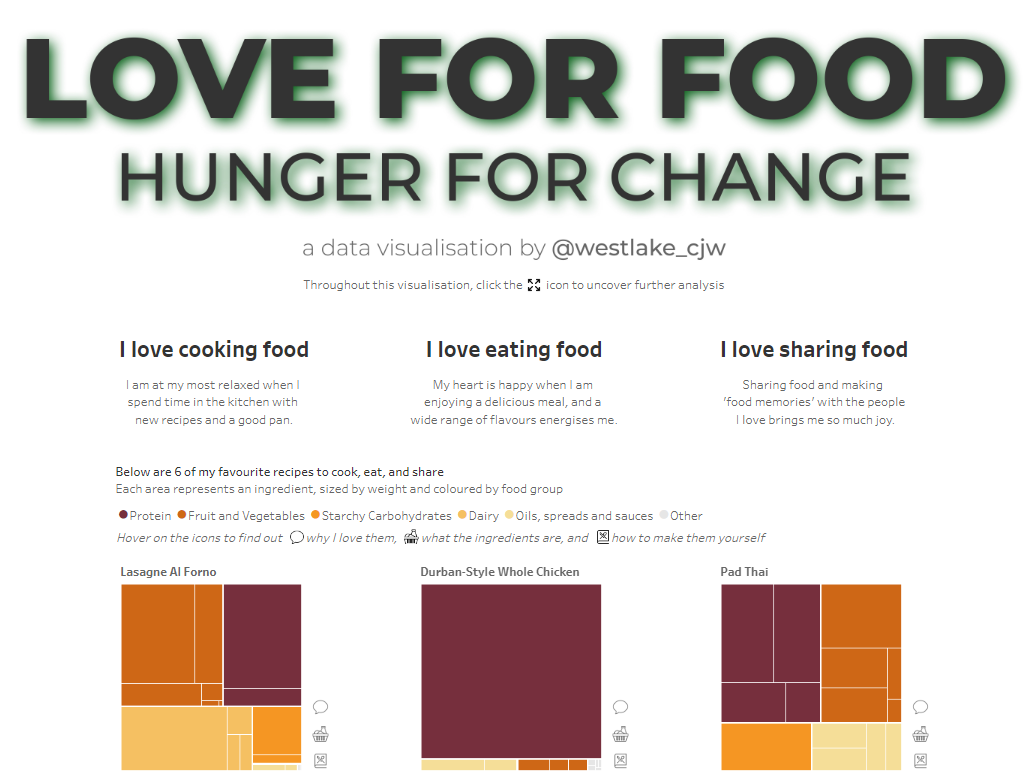
Food was a perfect subject because it is such a universal human experience. Chris called the resulting viz Love for Food, Hunger for Change. “I love food,” he says, “but hate the fact that not everyone has enough to eat. Global hunger is such a big topic, and there’s a lot of reliable data around. The main thing I’d like people to take away from the viz is that hope isn’t lost. We’ve made so much progress over the last 20 years and we can continue to make progress by taking action on inequality. There is a real message of hope.”
The judges gave plenty of love to the viz, praising “a very clever, attractive design which leads you into the story as it gets more serious about the consequences of hunger.”
Clean design is a Westlake hallmark. “My style is very minimalistic,” he observes. “I give the elements a lot of space and use color very deliberately. In my feeder viz there’s only one main color and all the charts are simple because I wanted to use formats that don’t take a lot of time to understand and interpret. It needed to just be there, easily, almost like access to food
needs to be there.”
It takes commitment to reach the level at which data analysis, design, and storytelling come together to produce a viz like Love for Food, Hunger for Change. “When I started, I struggled to come up with original ideas so I’d challenge myself to recreate visualizations I liked on Tableau Public.” Chris would try to reverse-engineer them blind, uncovering the hints and tips only when he got stuck.
Tableau Public was augmented by the teachings of Tableau Dave, aka Big Data Dave. “He was the big one for me when I first got into Tableau,” Chris recalls. “There are probably thousands of people who would say the same thing! Makeover Monday was another big one for me once I took that step of being public about what I was doing and sharing it. Getting feedback on Makeover Monday vizzes was a huge part of my learning. It really is the Community which makes Tableau the amazing software it is.”
To deepen his engagement, Edinburgh-based Chris joined the Tableau Scotland User Group, which he now co-leads. “I love Tableau User Groups! The passion you see from people in the Tableau Community is what makes this something special. It’s a group of people who love data and want to incorporate it into everything they do, and that’s just brilliant to see.”
How is Chris feeling about the upcoming Iron Viz finals? “It’s a big challenge, but one I’m looking forward to. All three finalists get the same data set and have to build a viz in 20 minutes, so I’m going from the 100 hours it took me to build the feeder to 20 minutes to try to pull something of the same quality together, and build it live on stage. Knowing I won’t be up there alone helps. The other finalists are obviously both incredibly talented, and connecting with them is going to be cool.”
“I’m really excited about San Diego! Starting to lose a bit of sleep over it, yes, but looking forward. It’ll be an experience like nothing else I’ve ever done before. The adrenaline rush you must get going out on stage in front of 8,000 people is going to be incredible. And afterwards I can catch up on all the sleep I’m missing out on now!”
