How to Visualize Your Music Data


Music is a daily part of many of our lives and the year is coming to an end. Wouldn’t it be cool if you could see what your music said about you this year? You don’t have to wait for your music streaming service to provide that for you anymore—you can see and learn from your listening data at any point in the year using Tableau. Whether this is your first Tableau visualization or your 100th, let this be a chance to practice and grow your viz-building skills using your own personal data! It doesn’t have to end with this year either—you can even look at your lifetime streaming patterns and see how your music taste has evolved.
If you’re hooked and ready to see how many times you’ve streamed Taylor Swift’s Anti-Hero or Rihanna’s first release in 6 years, keep reading. We’ll teach you how to make a viz with Tableau that provides uniquely personal insights with an easy to understand interface, step-by-step.
Navigating the Tableau Workspace
Before learning any new vocabulary, we should make sure we know what Tableau is first. Tableau is a visual analytics platform that empowers all people and organizations to make the most of their data with an easy-to-navigate interface, no coding skills necessary. We’ve created a glossary of Tableau vocabulary you may encounter that you can reference as you go throughout this project.
| Term | Definition |
|---|---|
| dashboard |
A collection of views shown in a single location where you can compare and monitor a variety of data simultaneously. |
| dimension |
Qualitative values, such as names, dates, or geographical data. Colored blue. |
| filter |
A control on a view that limits the data shown in a view. For example, a filter on Region that only includes the West. |
| mark |
A visual representation of one or more rows in a data source. Mark types can be bar, line, square, and so on. |
| measure |
Numeric, quantitative values that you can measure. Measures can be aggregated. Colored green. |
| pill |
Piece of data. |
| tooltip |
Details that appear when you rest the pointer over one or more marks in the view. |
| union |
A method for combining data by appending rows of one table onto another table. |
| worksheet |
A single view of data. Each worksheet can be connected to a single data source. |
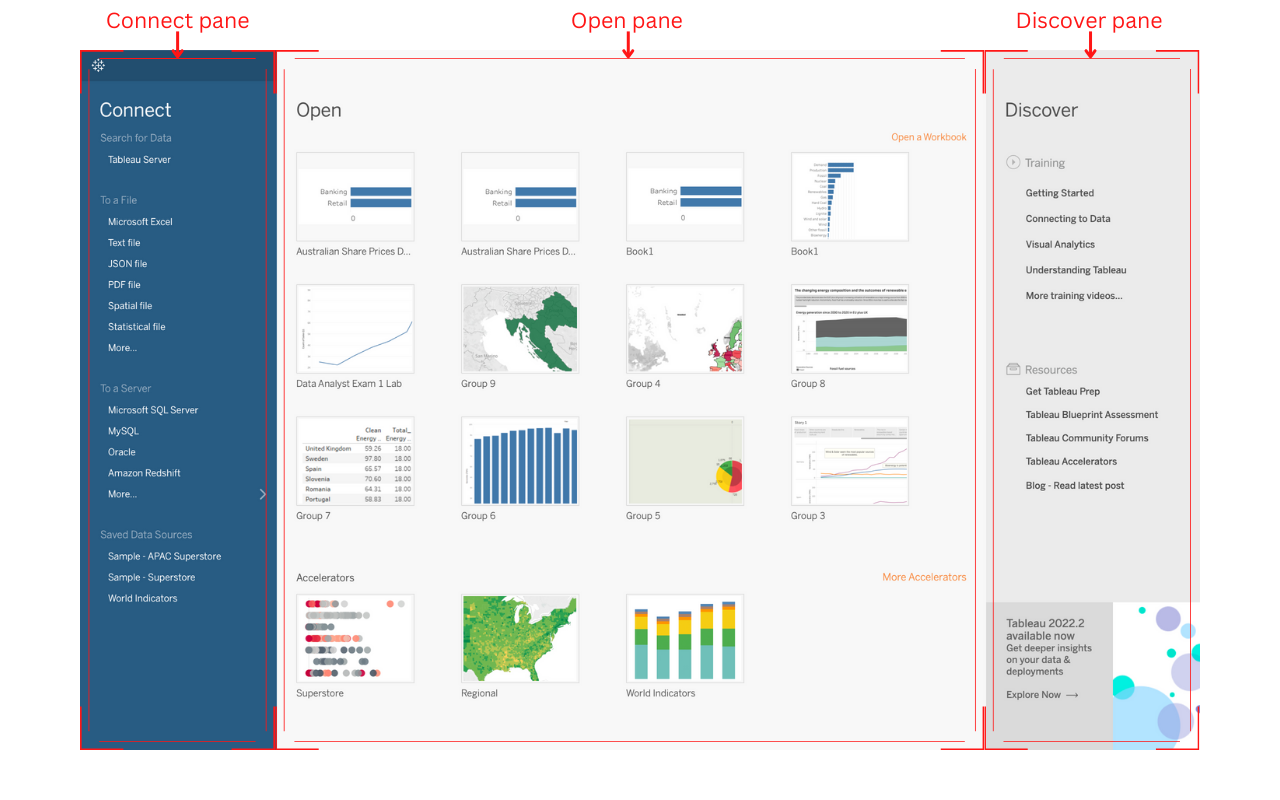
Start Page for Tableau Desktop version 2022.2.1. Image sourced from Tableau Student Ambassador Jason Khu’s The Tableau Desktop Workspace Interface Guide.
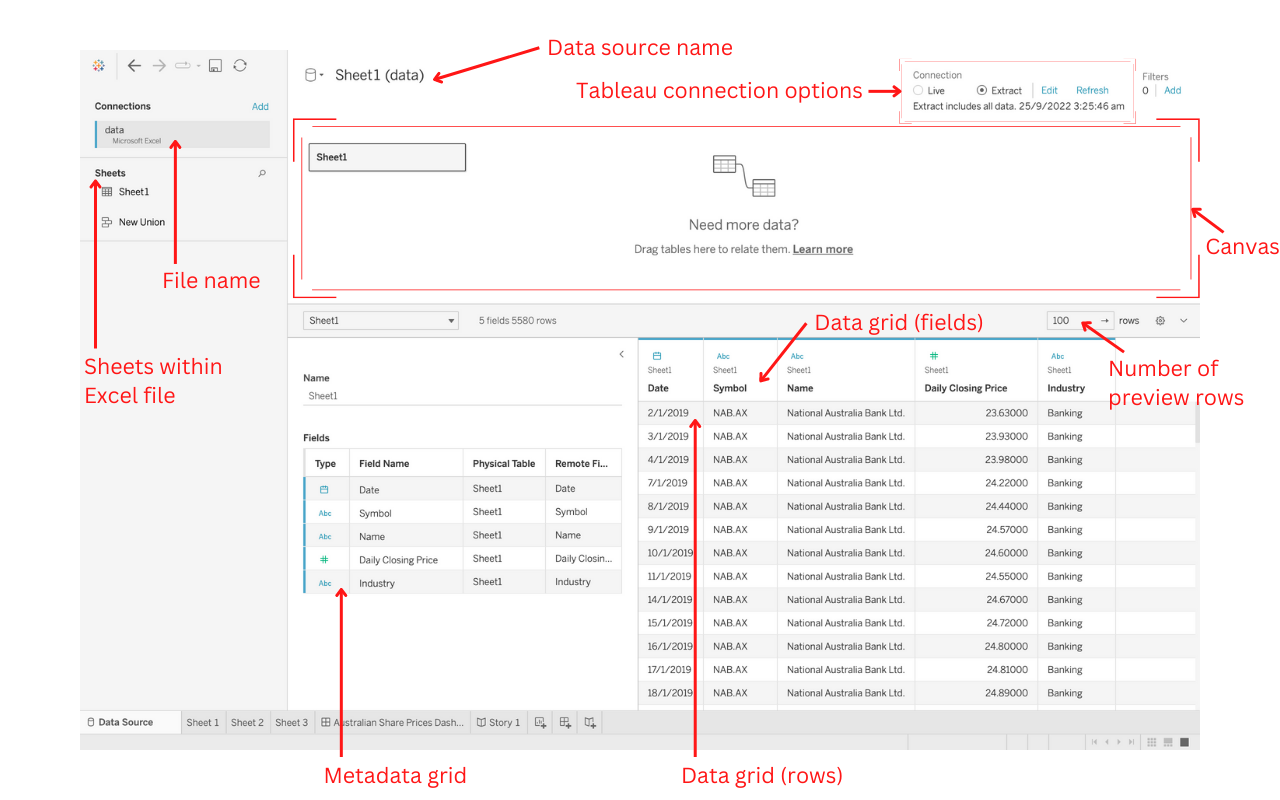
Data Source page for Tableau Desktop version 2022.2.1. Image sourced from Tableau Student Ambassador Jason Khu’s The Tableau Desktop Workspace Interface Guide.
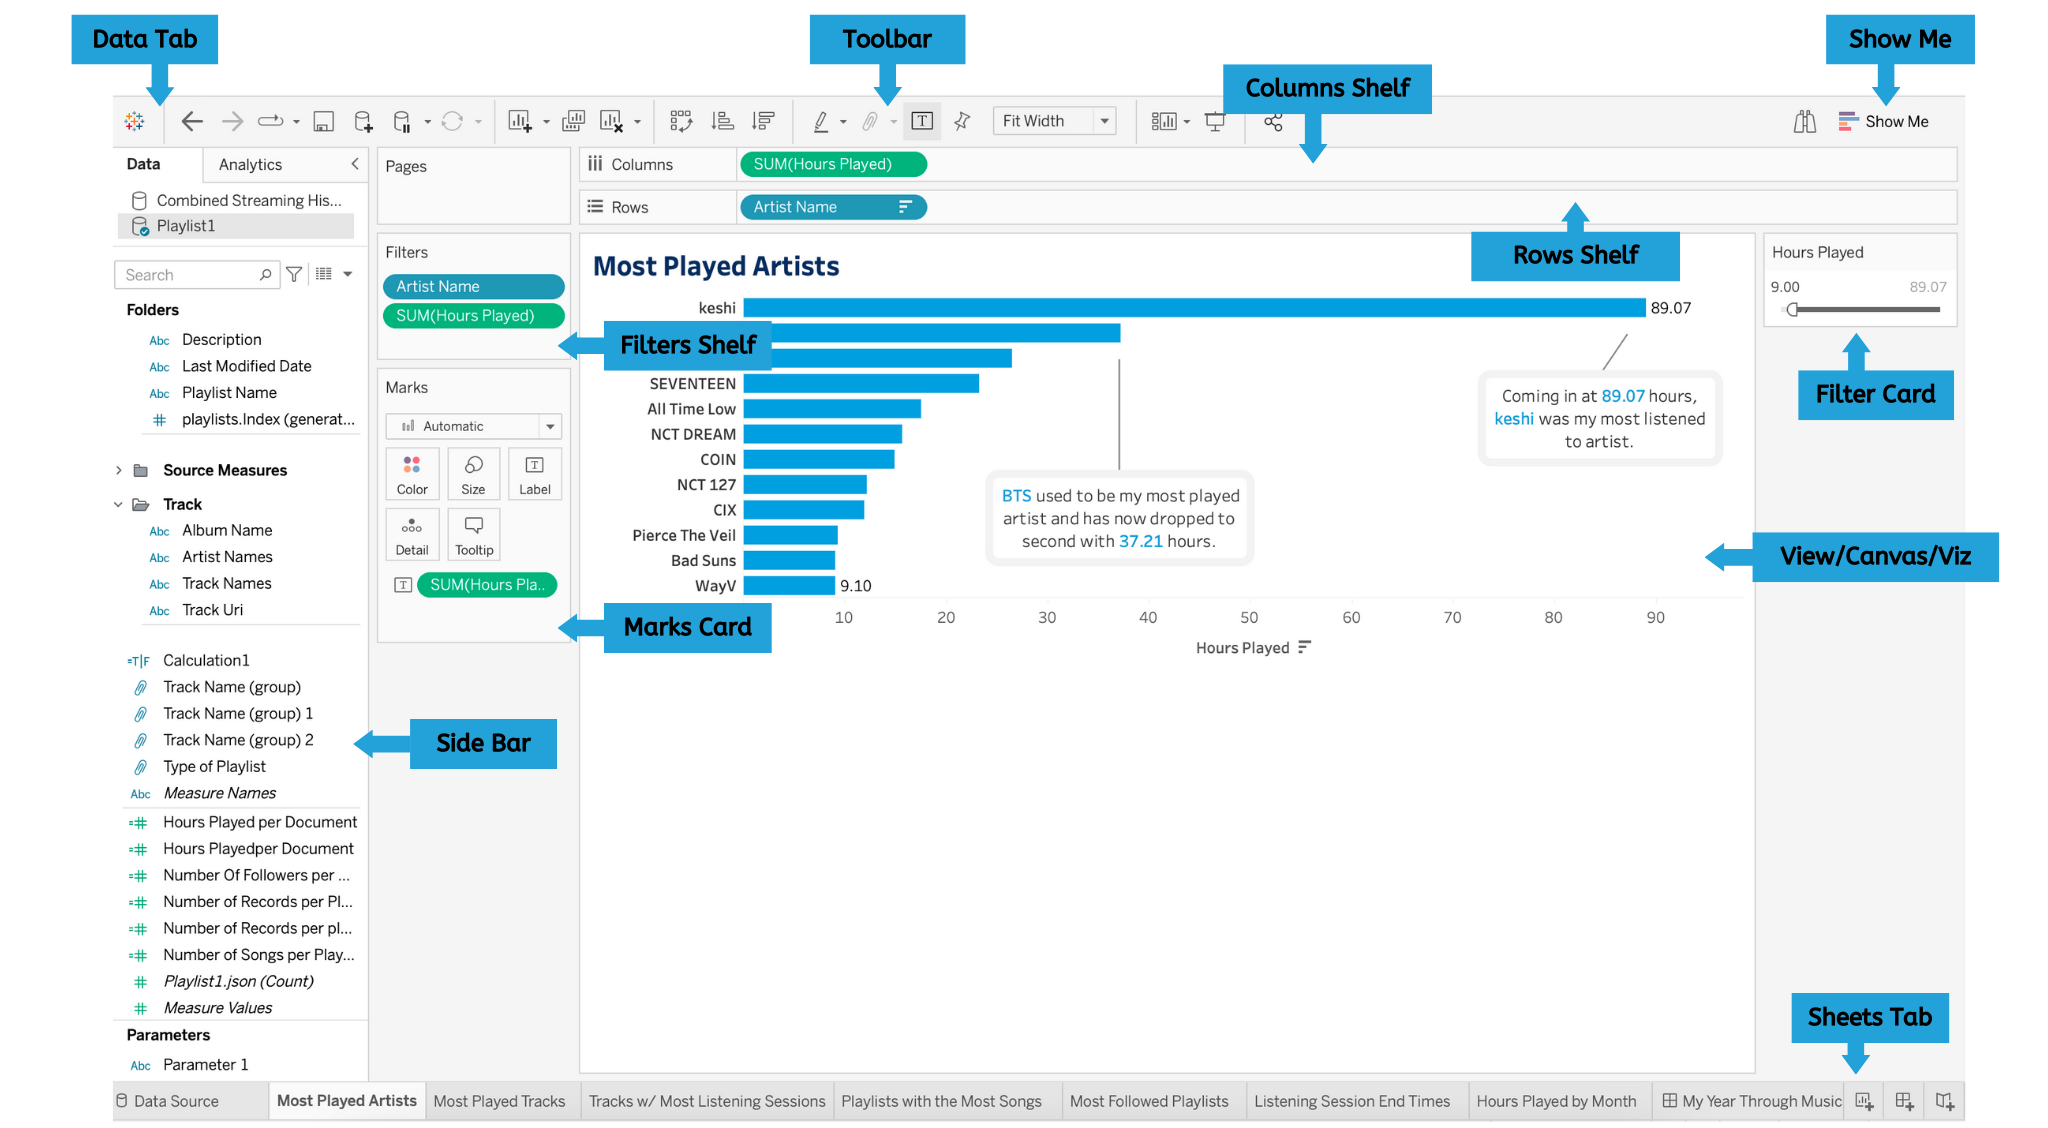
Sheet view from Tableau Desktop 2022.2.3.
Access Tableau
Don’t already have Tableau on your machine? Here are a few ways to get access and start creating.
Option 1: Access a Tableau for Students License
If you are a current student at an accredited institution, head on over to the Tableau for Students webpage and click on “Get Tableau for Free.” You can fill out your information and, once you’re verified, you’ll get a product key to activate your Tableau software.
Option 2: Use Tableau Public
If you aren’t a current student, you can either use the online version or download Tableau Public onto your machine for free. Tableau Public is a free platform to explore, create, and publicly share data visualizations online. Head to this blog post to learn how to access either Tableau Desktop Public Edition or Web Authoring.
Depending on where you listen to your music and podcasts, how you get your data may differ. Instructions for getting Spotify and Apple Music data are below. If you use neither music application or are having trouble accessing your data, feel free to follow along with this sample data.
For Spotify
For Apple Music
Plug Your Worksheets into a Dashboard and Decorate
Now that we’ve created all of the different worksheets we want in our final dashboard, we can bring everything together! To create a new dashboard, hover over the “Dashboard” setting and click “New Dashboard.” You can also click on the button in the sheets tab next to “New Worksheet.” Here, you can drag and drop any worksheets you’ve made from the Dashboard Pane on the left of the program. You can even import images, add text, and reformat through horizontal or vertical sections in your dashboard.
Feel free to add context to your dashboard by right clicking a specific worksheet, hovering over “annotate,” and clicking on “point” or “area”. This allows you to add text onto your worksheets that explain points or your chart. Make filters visible and interactive by clicking on a worksheet, and heading to the “More Options” arrow and hovering over “Filter.”
Decorating a dashboard can be intimidating, so we’ve also created a template that you can feel free to plug your own worksheets into! Just download this Tableau Public dashboard as a workbook template and plug in your data to the included dashboard. You’ll want to make sure to update the data that’s being accessed.
Upload Your Wrap-Up to Tableau Public with #MyYearThroughMusic
The final step is to share your amazing insights and Tableau dashboard with the world! You can upload your viz to your Tableau Public account and tag it with #MyYearThroughMusic to show off what your year through music looked like. Depending on what version of Tableau you used, how you upload your viz may vary. By tagging your viz, you’re making your viz searchable by others who are making their own music visualizations. You can also take a look at theirs by searching for the tag directly in Tableau Public or clicking on the tag from your own viz.
Exporting from Tableau Desktop
- In the menu, select “Server,” then “Tableau Public,” then click “Save to Tableau Public.”
- Sign in using your Tableau Public account or create one if you don’t have one.
- Type a title for your workbook and click “save.” You should be redirected to the Tableau Public website.
- Hover over your viz and click “view,” then select edit details and make sure to include #MyYearThroughMusic in your viz’s description. Your viz is now published and ready to show the world!

Exporting from Tableau Desktop Public Edition
- Go to the “File” menu and click “Save to Tableau Public As…”
- Sign in using your Tableau Public account or create one if you don’t have one.
- Type a title for your workbook and click “save.” You should be redirected to the Tableau Public website.
- Hover over your viz and click “view,” then select edit details and make sure to include #MyYearThroughMusic in your viz’s description. Your viz is now published.
Exporting from Tableau Public Web Authoring
- Click “Publish As…” in the top right of the screen, name your workbook, then click “Publish.” You should be redirected to the Tableau Public website.
- Hover over your viz and click “view,” then select edit details and make sure to include #MyYearThroughMusic in your viz’s description. Your viz is now published.
Congratulations, now you know how to visualize your music data
You did it! You’ve made an amazing viz that tells the story of your year and found insights that matter to you. It doesn’t have to end with this viz—your music wrap-up can be something that you return to every year, season, or month. You can continue to work those creative juices with your Tableau for Student license or over on Tableau Public. Take a minute to look over some other ways that our DataFam has looked at music data in the past through our Data + Music stories. If you’re looking to work more with music data, you can get involved in the monthly #DataPlusMusic Tableau Community project founded by Tableau Visionary Sean Miller. We’ve included some resources below too that could be helpful along your Tableau journey. Who knows? Maybe your next challenge could be Iron Viz: Student Edition which will be opening for submissions soon.
Resources
関連ストーリー

Iron Viz 2026: Read Between the Data
 2026/05/28

Tableau's Iron Viz Winners

2026 年 Iron Viz 応募作品のご紹介
 2025/12/15