Tableau Desktop
Explorez, modélisez et visualisez les données à tout moment, même hors ligne.
Version d'évaluation gratuite Acheter
Regarder maintenantModélisation et analyse des données en libre-service
Identifiez rapidement les informations pertinentes grâce à de puissantes fonctionnalités combinant flexibilité et contrôle. Capicité à relier de multiples faits, thèmes personnalisés, extensions de visualisation, accessibilité améliorée, Tableau Desktop vous permet d’exercer un meilleur contrôle et facilite la prise de décisions efficientes sur la base de vos données.

Obtenir une licence Tableau Creator
Tableau Desktop et Tableau Prep sont disponibles via les licences Tableau Creator. Renseignez-vous sur Tableau+ pour découvrir comment accélérer vos analyses grâce à une solution IA fiable.
Fonctionnalités clés
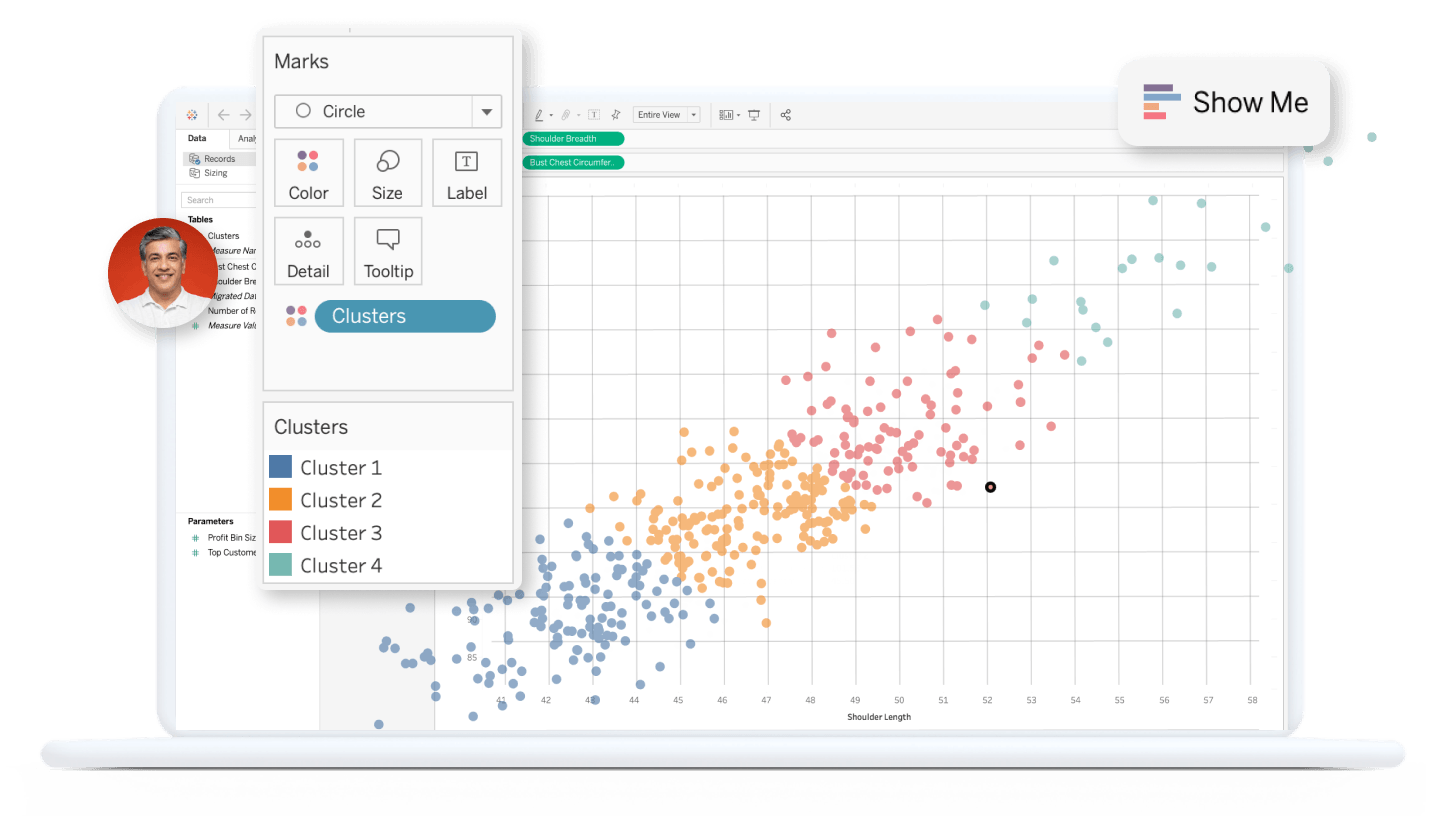
Simplifiez l'exploration illimitée des données
De la préparation des données à leur utilisation, Tableau Desktop vous offre tous les outils nécessaires pour générer des insights en temps réel. Il vous suffit de vous connecter à vos données, où que vous soyez, pour pouvoir les combiner et les nettoyer en quelques clics, sans code. Posez des questions inédites, détectez les tendances, identifiez les opportunités et prenez en toute confiance des décisions fondées sur les données.
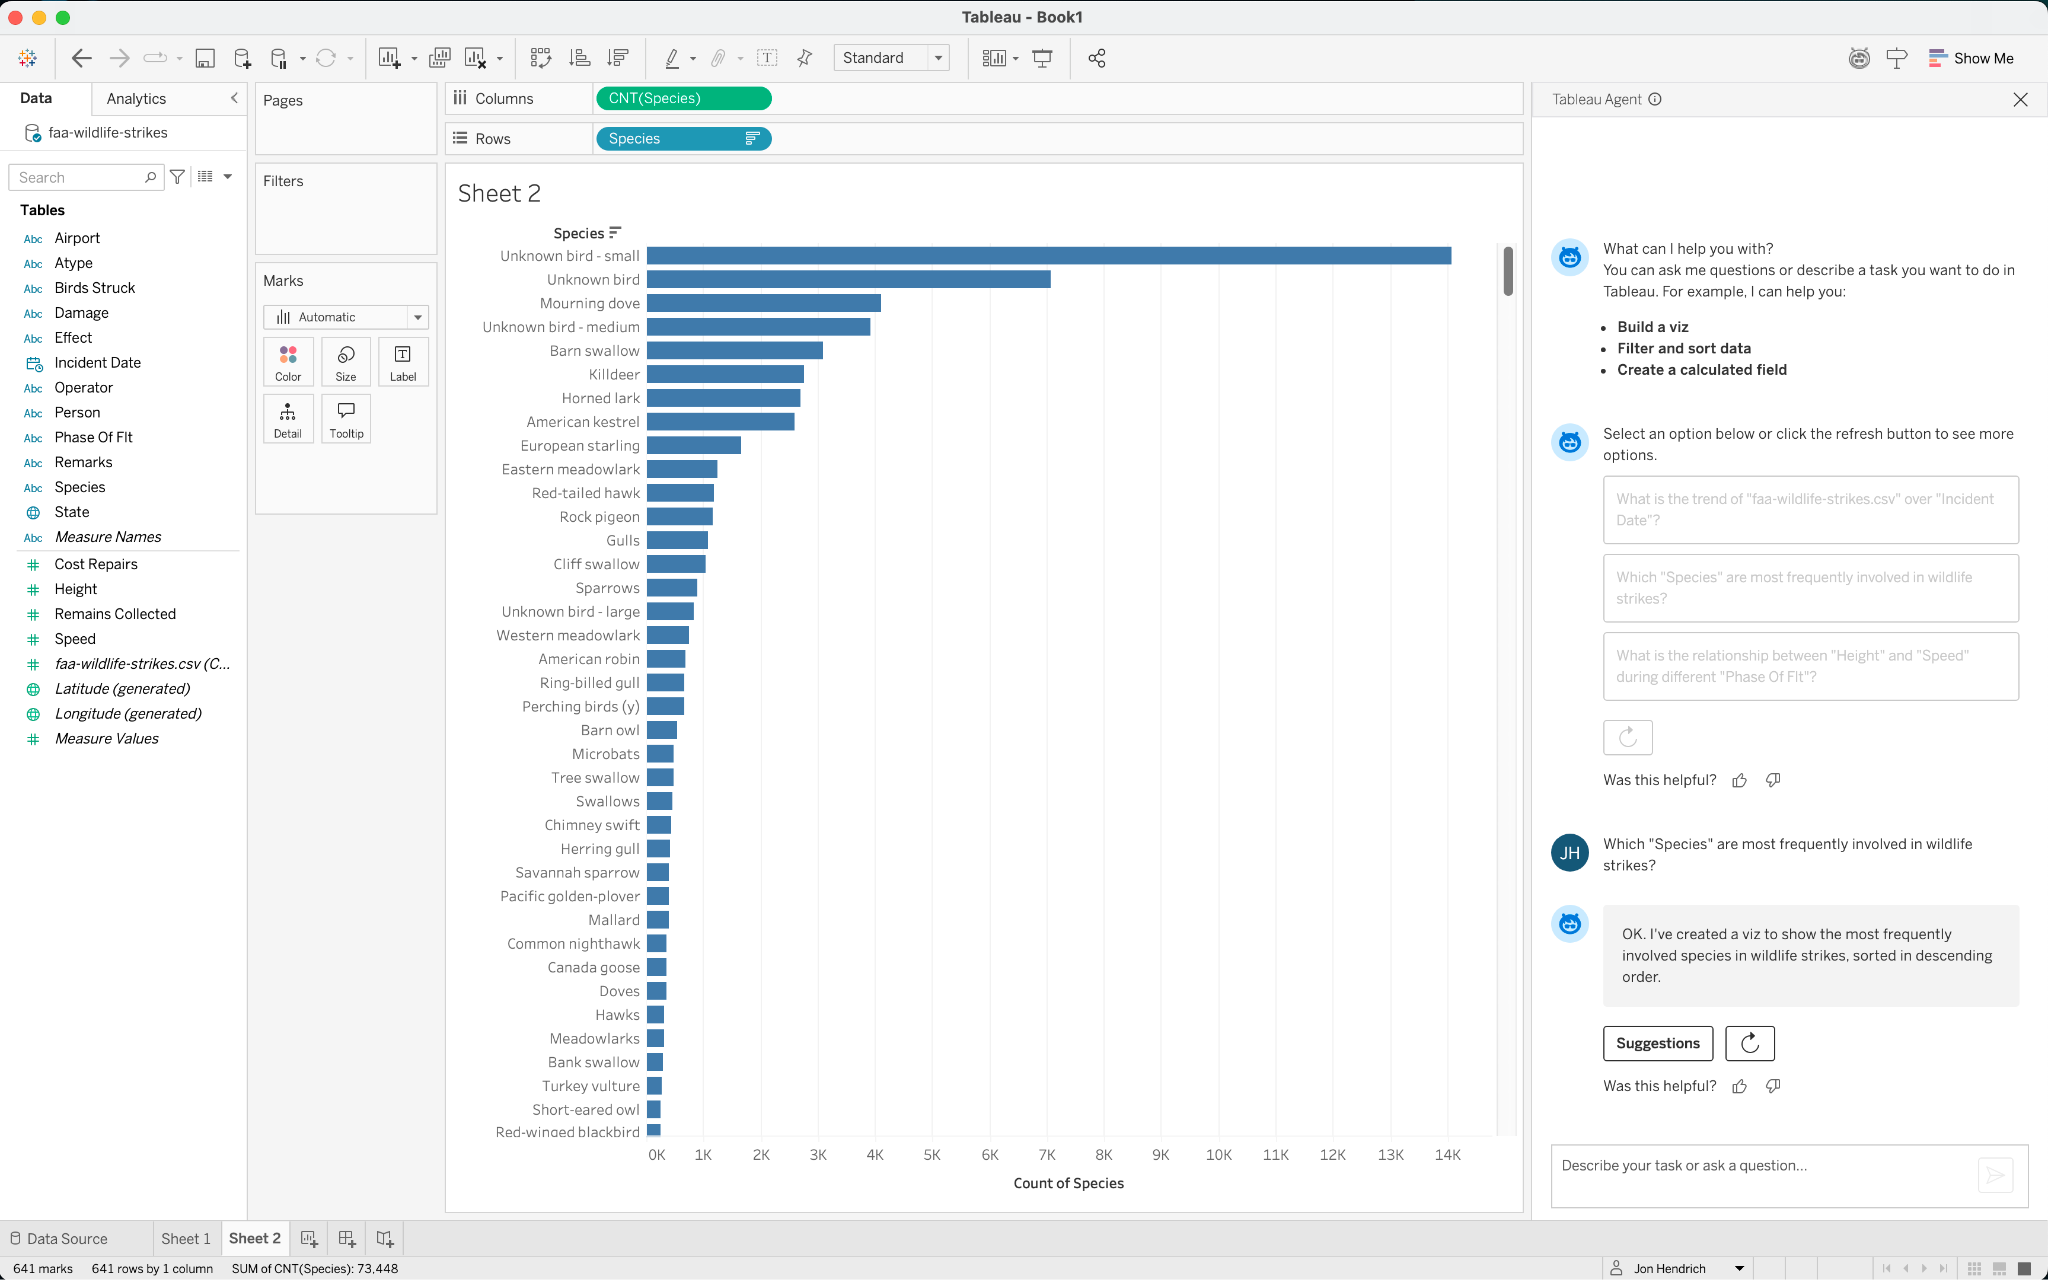
Prenez des décisions plus intelligentes grâce à l'IA
Accélérez votre valeur commerciale grâce à l’obtention d’informations intelligentes et fiables. Des fonctionnalités transparentes à base d’agents sont intégrées à la plate-forme pour démocratiser la planification de scénarios hypothétiques, la création de modèles guidés, les prédictions basées sur l'IA et d'autres techniques de science des données. Intégrez R, Python, MATLAB et d'autres extensions pour visualiser les résultats en temps réel et déployer des analyses avancées qui transformeront votre entreprise.
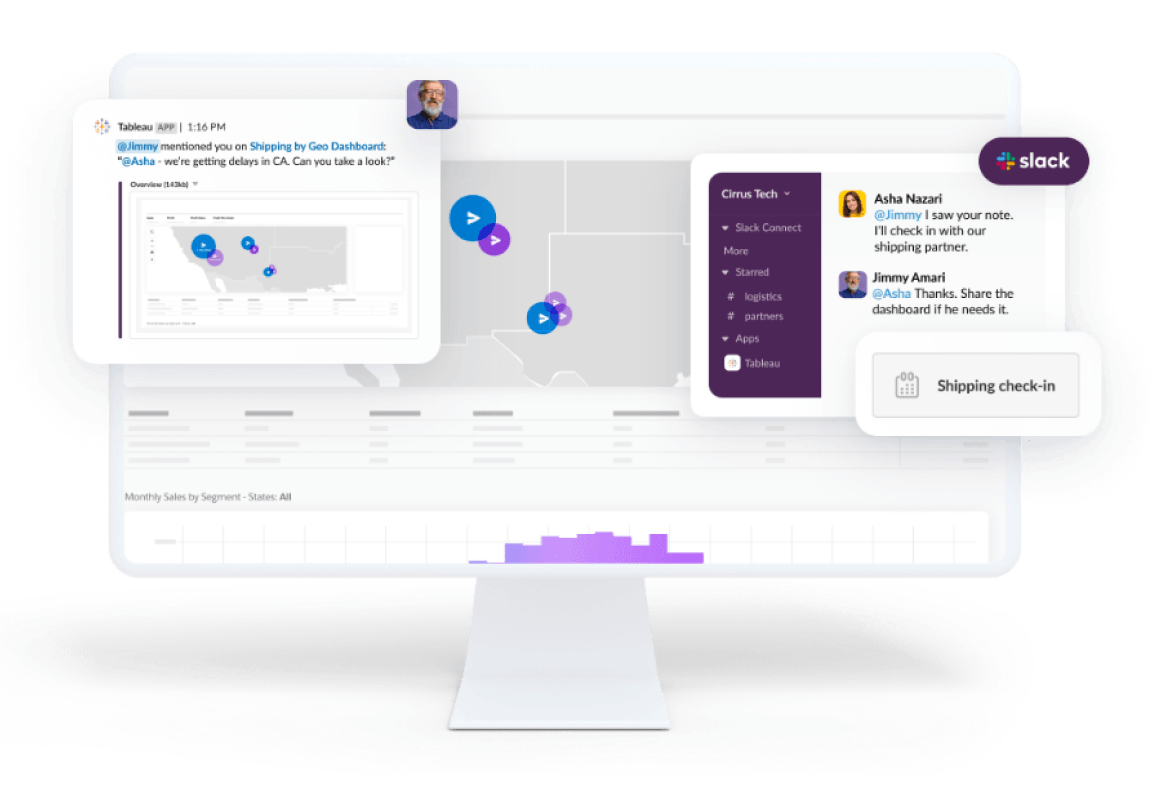
Collaboration et partage
Tableau offre un environnement flexible et gouverné pour aider les équipes à collaborer sur la base de données fiables. Grâce à l’intégration de Google Workspace, Microsoft Teams, Slack et bien d'autres outils, vous pouvez recevoir des notifications, poser des questions complémentaires et décloisonner les processus pour stimuler votre entreprise. Boostez votre productivité grâce à des expériences basées sur l'IA et le Machine Learning qui offrent des réponses pertinentes et facilement compréhensibles.

Grâce aux outils Tableau, nous sommes en mesure de toucher un large public en bénéficiant de nombreuses informations, ce qu'auparavant nous ne pouvions pas faire sans l'aide d'une très nombreuse équipe
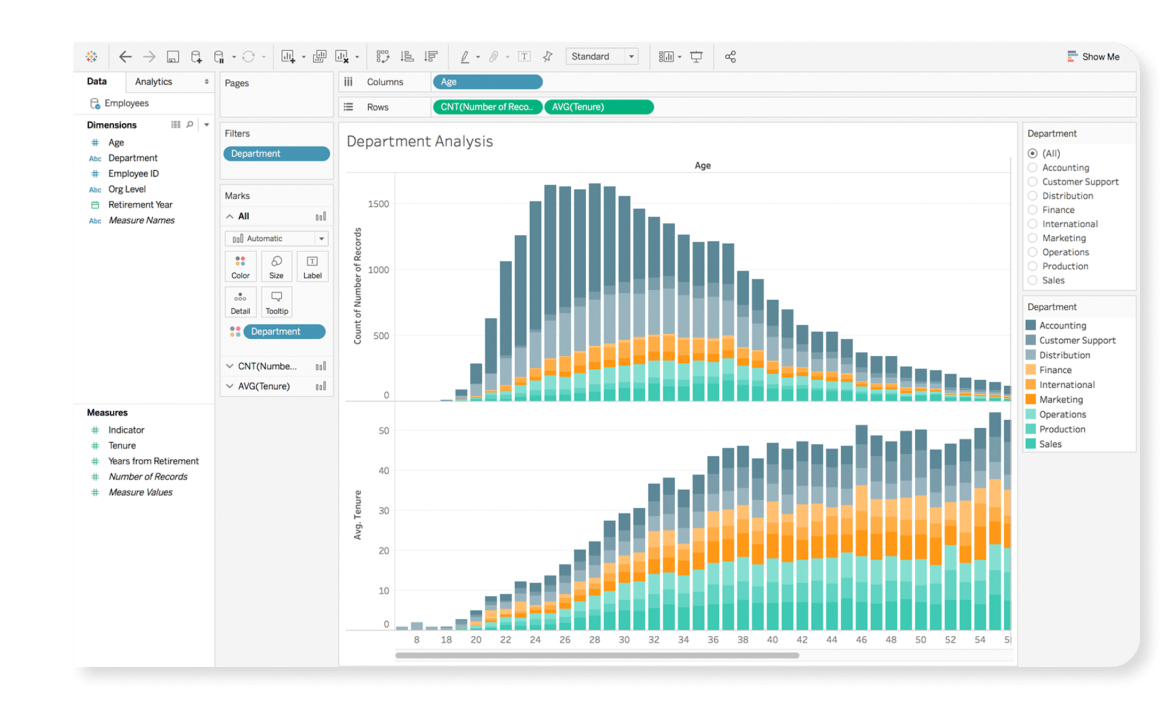
Analytique augmentée
Nous investissons dans des capacités analytiques qui offrent des réponses et révèlent des informations cachées plus rapidement grâce à l’IA, au Machine Learning, aux statistiques et au langage naturel.
Disponible maintenant : Tableau Agent pour Tableau Desktop
Découvrir Tableau Agent pour Tableau DesktopPour bien démarrer votre analyse

Tableau Exchange vous donne accès à des ressources fiables, conçues par Tableau et par des partenaires tiers, pour vous aider à gagner du temps, trouver des solutions adaptées à divers cas d'utilisation et maximiser la valeur de votre investissement.
Accélérateurs
Créez rapidement des tableaux de bord robustes et adaptés à votre secteur ou aux services de votre entreprise, le tout avec vos données.
Extensions de tableau de bord
Ajoutez des fonctionnalités à vos tableaux de bord avec des applications Web.
Connecteurs
Accédez à des bases de données et applications supplémentaires grâce à Tableau.

Vidéos de formation
Regardez des vidéos de formation Tableau gratuites pour bien démarrer et vous perfectionner.

Apprenez à votre façon
Accédez à des ressources adaptées à votre utilisation (actuelle ou future) de Tableau Desktop.

Rejoignez la DataFam
Apprenez, partagez et échangez avec d’autres passionnés des données.

Assistance Tableau Desktop
Vous avez besoin d'aide ? Notre équipe d'experts se tient à votre disposition.