How Tableau Pulse powered by Tableau AI is Reimagining the Data Experience


The analytics age we find ourselves in today is unique, powered by technologies like generative AI, the Internet of Things (IoT), and automation that are changing the analytics landscape. Underpinning these technologies is data—and how we engage with it is changing too. The accelerating pace of these new technologies means that businesses and organizations worldwide face a critical inflection point, a do-or-die moment. Businesses must embrace data-driven decision making if they want to stay competitive and build stronger customer relationships, because the performance gap between organizations who successfully use data and those that don’t is poised to grow exponentially. Those who can’t capitalize on their data will be left behind—perhaps faster than anticipated.
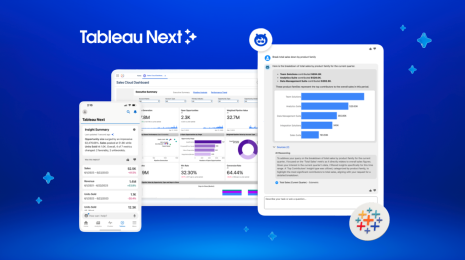
Tableau Pulse is a reimagined data experience that makes data more accessible to everyone regardless of their expertise with data visualization tools. Tableau Pulse is available for Tableau Cloud users, and leverages the power of Tableau AI to deliver data in ways that are more personalized, contextual, and smart.
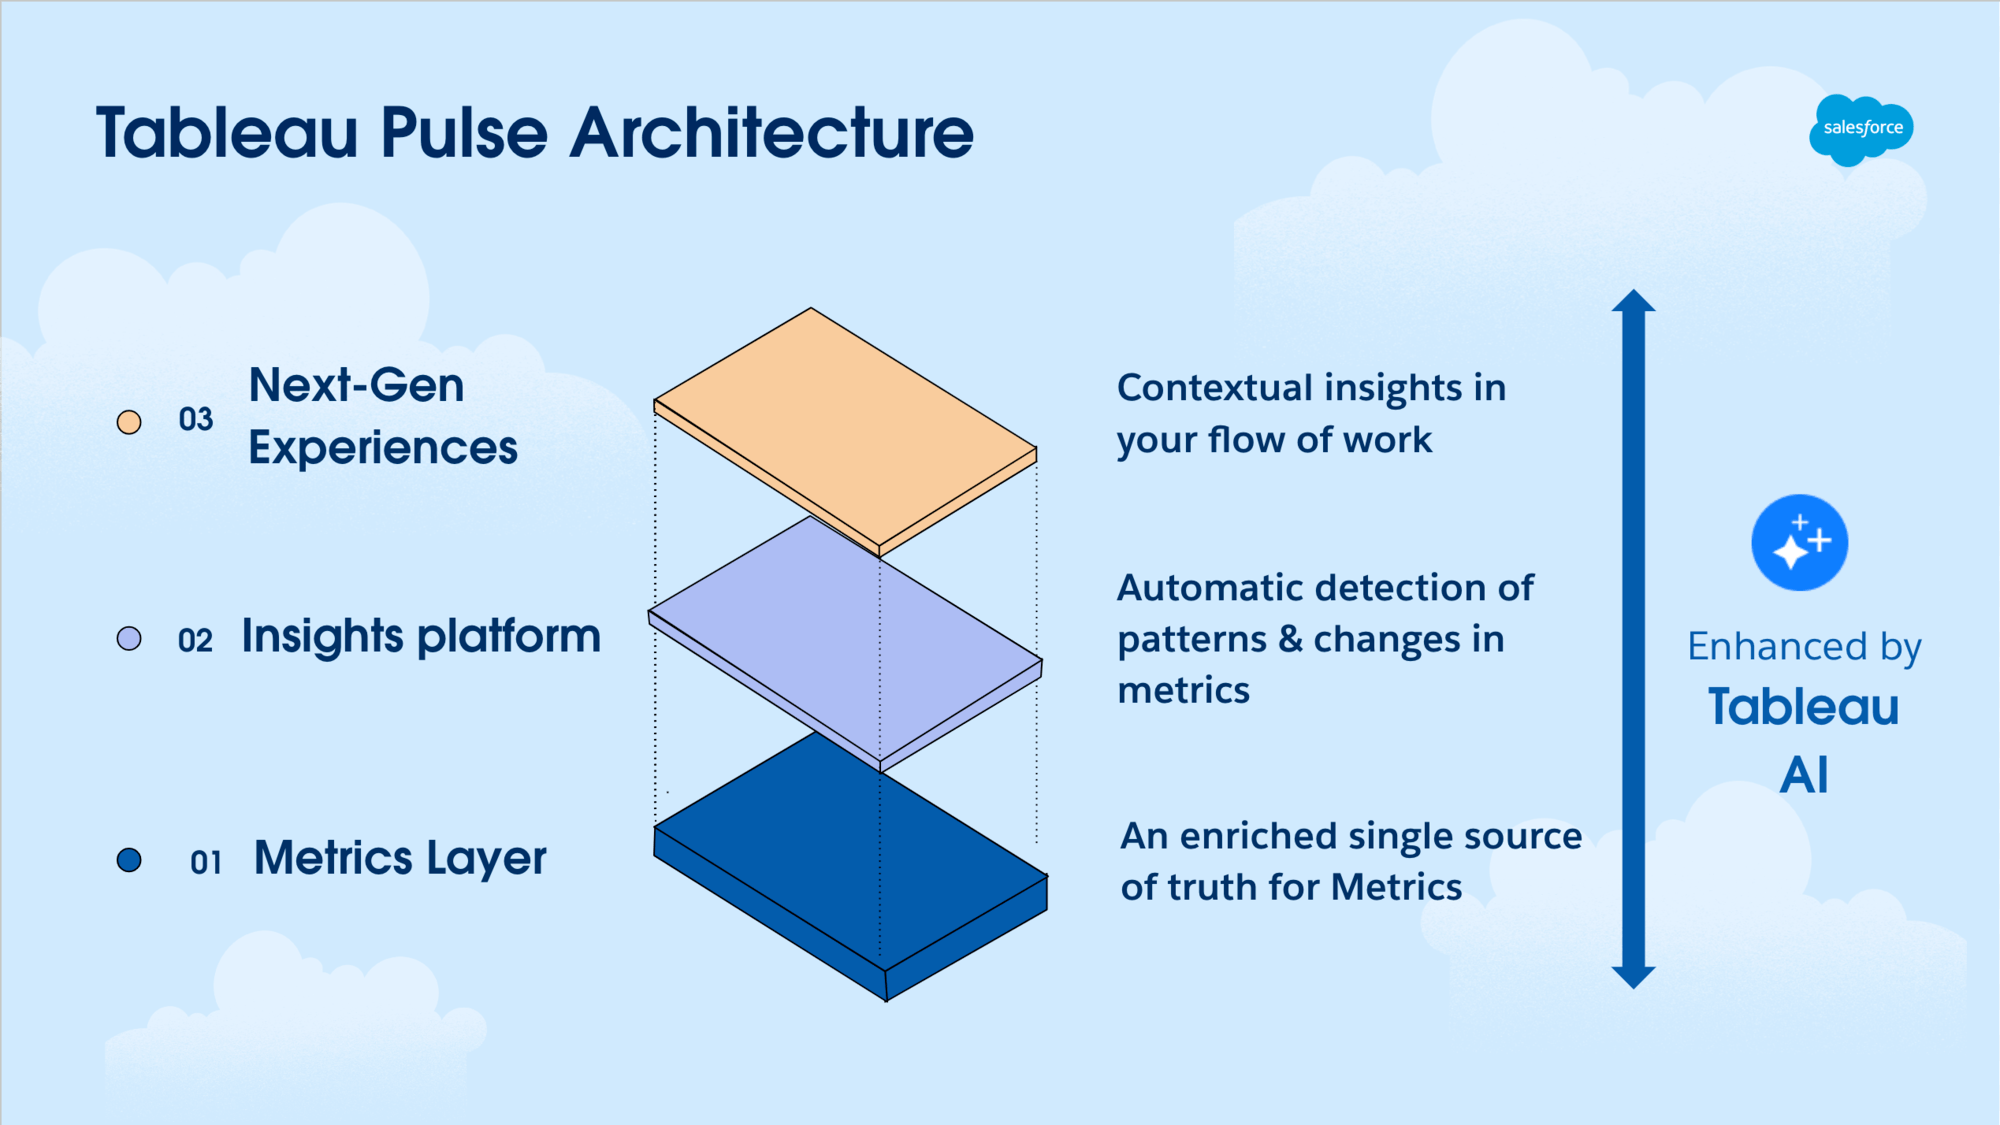
Tableau Pulse brings the power and flexibility of a Metrics Layer, also known as a headless BI—to Tableau’s platform, enabling metrics and KPIs to be defined once and then used across the organization. This not only saves analysts time but ensures teams are aligning to the same trusted numbers thanks to a single source of truth.
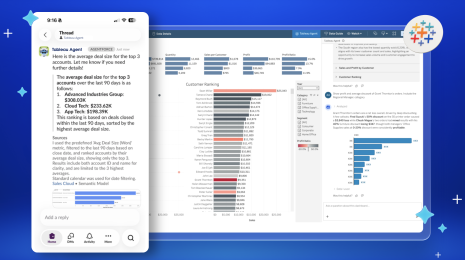
An Insights platform runs on top of the Metrics Layer, which is a statistical service that automatically generates insights about the Metrics that have been defined, ranks these insights, and then summarizes them in natural language using generative AI. The service also enables users to engage with insights and dive deeper into their data through guided follow-up questions that are proactively surfaced and based on the data’s context.
Finally, Tableau Pulse also provides a Next-Gen Experiences by presenting data using intuitive, consumer-friendly metrics that are delivered directly to users in their flow of work in Slack, email, Tableau web app, etc., and that can be quickly scaled across the business as users discover, follow, and share relevant metrics much like they would social media content. Generative AI-powered insight summaries help users focus on the data headlines, ensuring that important patterns, trends, outliers, and changes in the data are noticed.
Generative AI enhances each layer of Tableau Pulse, making it easier for all users to discover relevant metrics, create metrics from existing content, understand insights, ask questions, conduct root cause analysis, and tie data to a real-world context.
We're regularly introducing new capabilities to Tableau Pulse—check out all the latest features.
Tableau Pulse: bringing analytics to life for everyone
Generative AI, automation, sensors, and other technologies that rely heavily on data are fundamentally changing today’s business landscape. The accelerating pace of these technologies means that companies worldwide face a critical inflection point, a do-or-die moment, because the performance gap between those who successfully use data and those who don’t is poised to grow exponentially. Companies that can’t capitalize on their data will be left behind—perhaps sooner than anticipated.
For businesses to truly capitalize on their data, they need to embrace it as a critical tool for decision-making. Empowering every employee with data who could benefit from it can ultimately help companies succeed, enabling them to be more profitable, resilient, and competitive. Tableau Pulse is a reimagined data experience for analytics consumers that will empower every employee with smart, personalized, and contextual insights delivered directly in their flow of work. It will especially help users who don’t have time to learn new tools, need data at their fingertips to make decisions quickly, and who want to go beyond the “how” and “what” of data to understand the “why.”
Here’s how Tableau Pulse will make all of your interactions with data personalized, contextual, and smart.
Personalized: Focus on what matters with metrics relevant to you
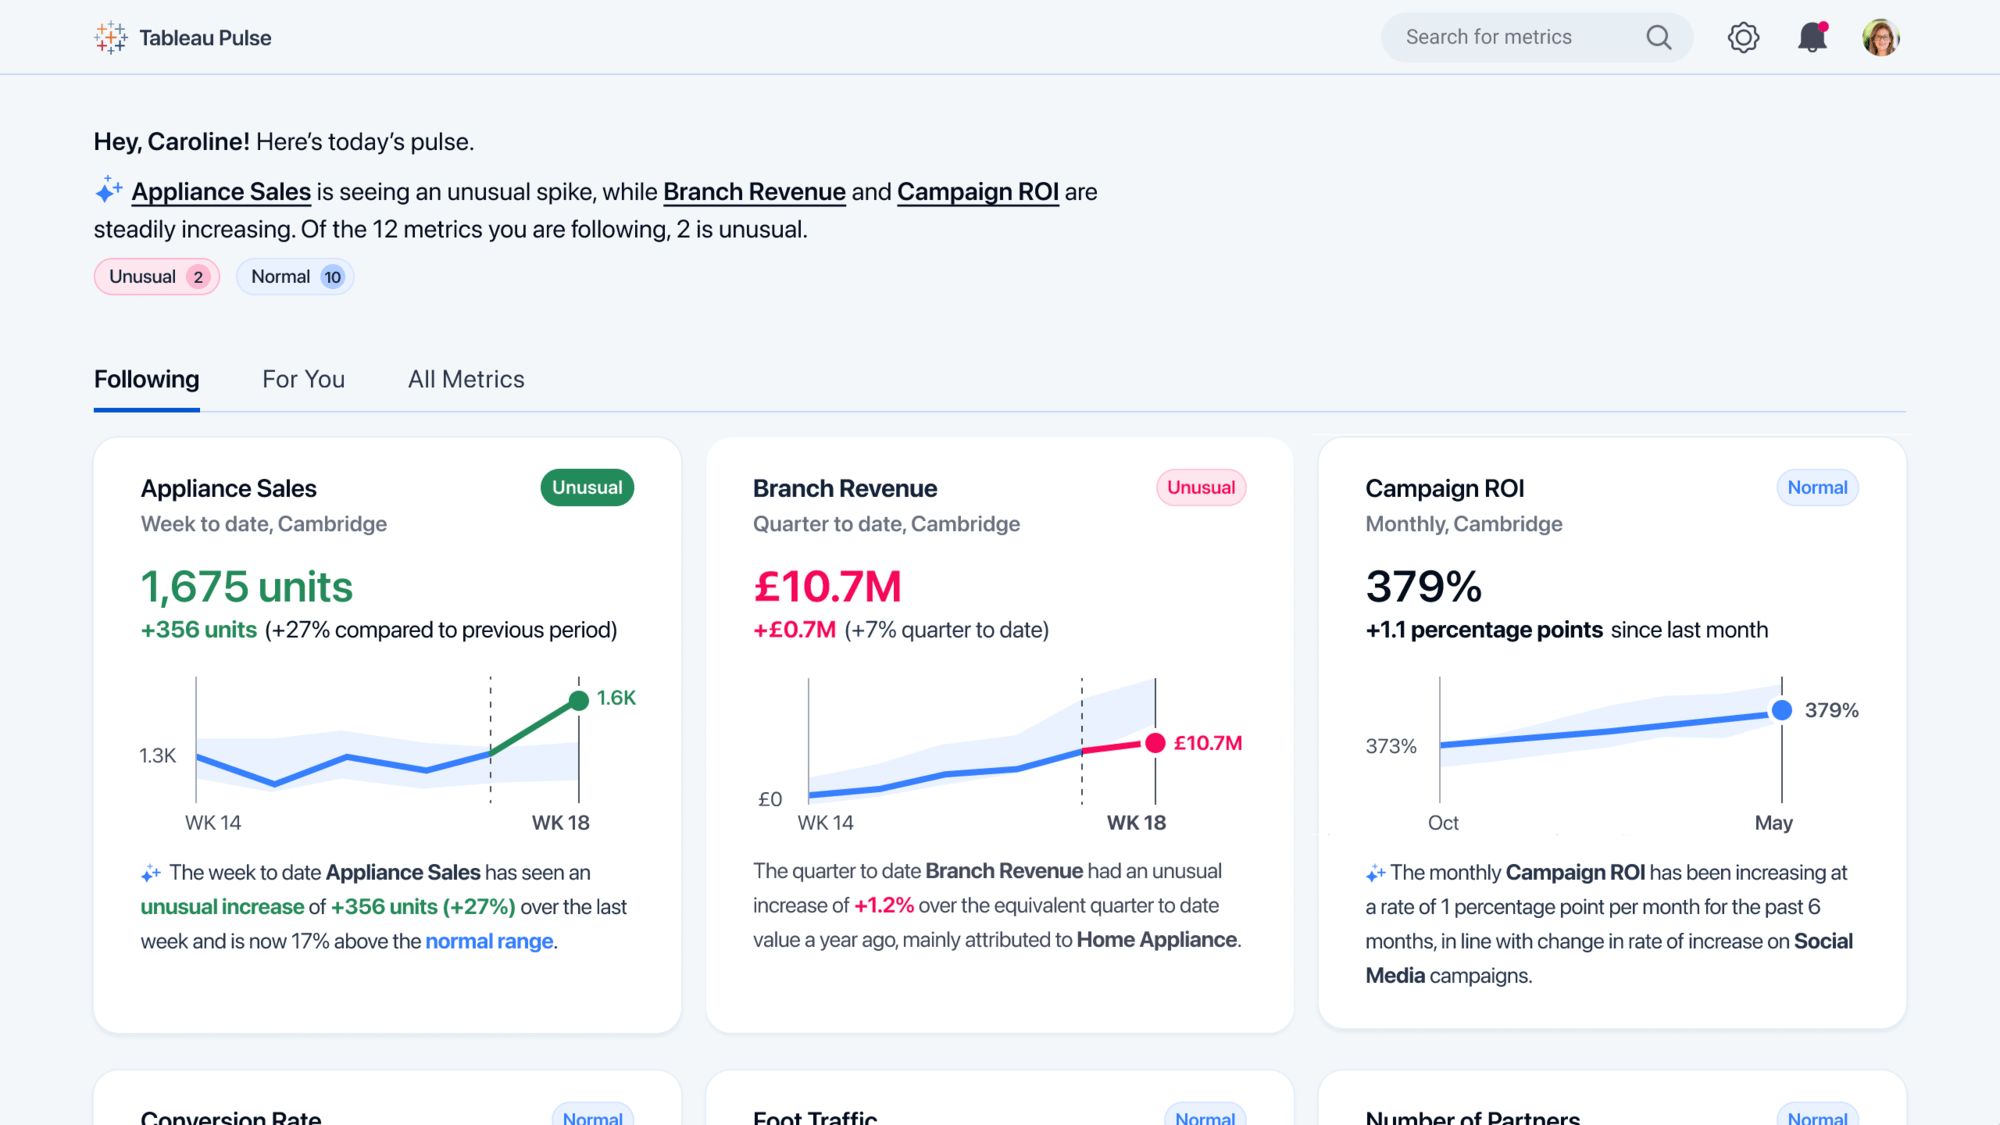
Today, the amount of data businesses contend with can be overwhelming, and reports are often presented in a one-size-fits-all way to serve many different teams at once. This helps bandwidth-strapped analysts—who don’t have time to create ad-hoc reports for everyone—but users are left sifting through the data to find what's relevant to them, which can be both time-consuming and frustrating.
Tableau Pulse changes this by providing data digests in your flow of work and an intuitive, personalized metrics homepage that you can tailor to your needs. Gone are the days of filtering five different ways in a dashboard to find the numbers you care about—now you can have a simple, curated, ‘newsfeed’-like experience of key KPIs that you select. Over time, this experience will return more personalized results as Pulse learns what insights you care most about.
Contextual: Infuse relevant data into your flow of work
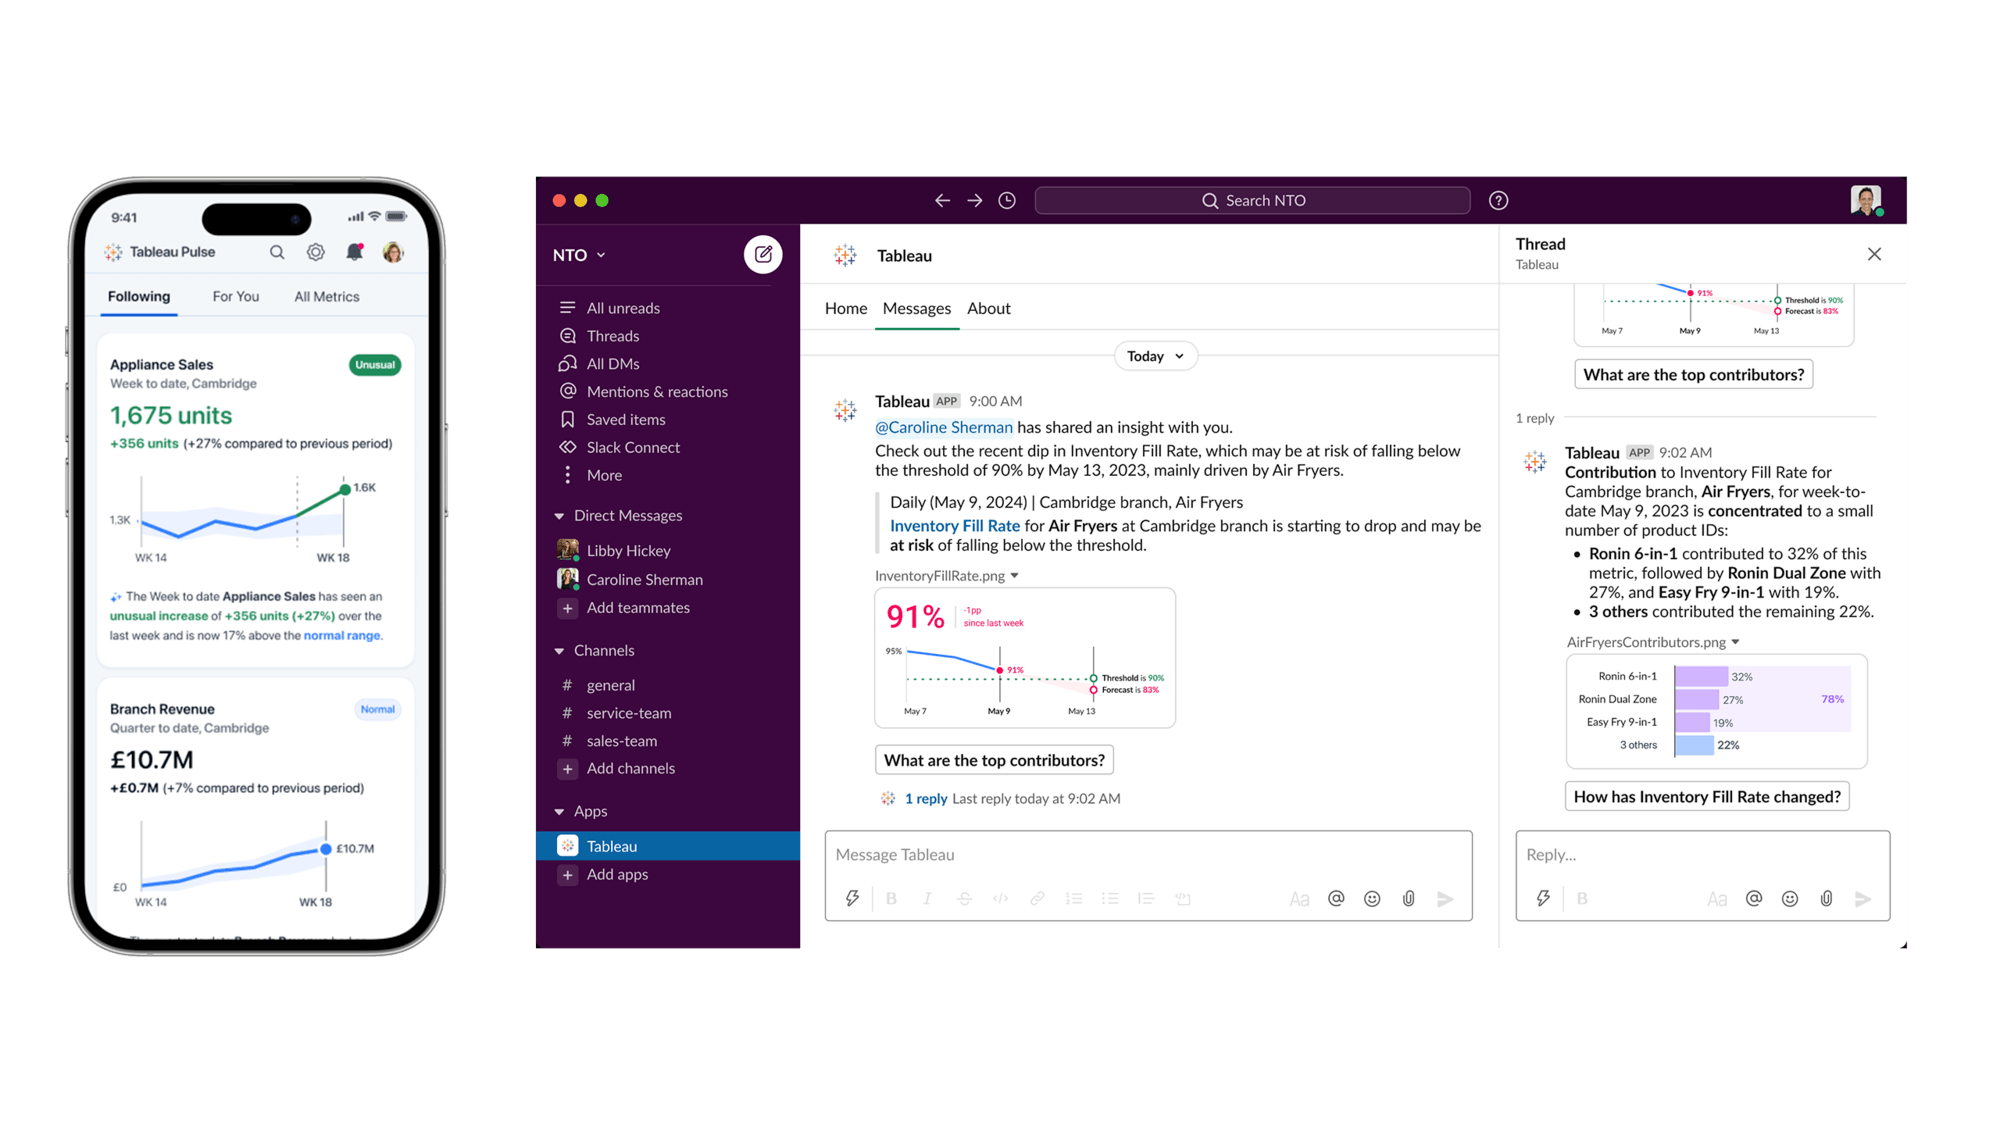
Today, people use a variety of applications to do their work, making it difficult to keep track of where you saw an important KPI. It’s easy to miss a critical insight if you weren’t logged into the right tool at the right time. Switching between different tools and applications to access data can also be time-consuming and disruptive to your workflow. Worst of all: fragmented data tools make it harder to share insights, knowledge, and best practices across teams—hampering your company’s ability to remain agile in the face of uncertainty.
Tableau Pulse changes this by delivering relevant data to users inside the tools they're already using. This means data can be decoupled from dashboards, ensuring that you can get the metrics you need without interrupting your workflow, have insights captured in the tools you spend the most time in, and won’t miss an important insight because you weren’t logged into the right tool at the right time. Best of all, you can now easily scale insights across your business: making seeing, sharing, and collaborating on data simply a matter of using the tools everyone in your organization already is.
Smart: Identify and communicate insights with Tableau AI
Today, making sense of data can be a time-consuming and manual process. Users might spend several minutes analyzing data to identify trends and insights, and it can be hard to know what questions to ask of your data. All of this can slow down decision making and hinder productivity.
Tableau Pulse enables a smarter use of data by helping organizations automate analysis and communicate insights in easy-to-understand ways—that is, in natural language. First, Tableau Pulse does the heavy lifting for you, helping you go beyond the “what” to get to the “why.” Pulse automatically detects and generates insights, anticipates questions you might ask, and even suggests questions you might not have thought of. From there, Tableau AI summarizes those insights conversationally. This will help you make better decisions faster, without having to spend time manually analyzing data.
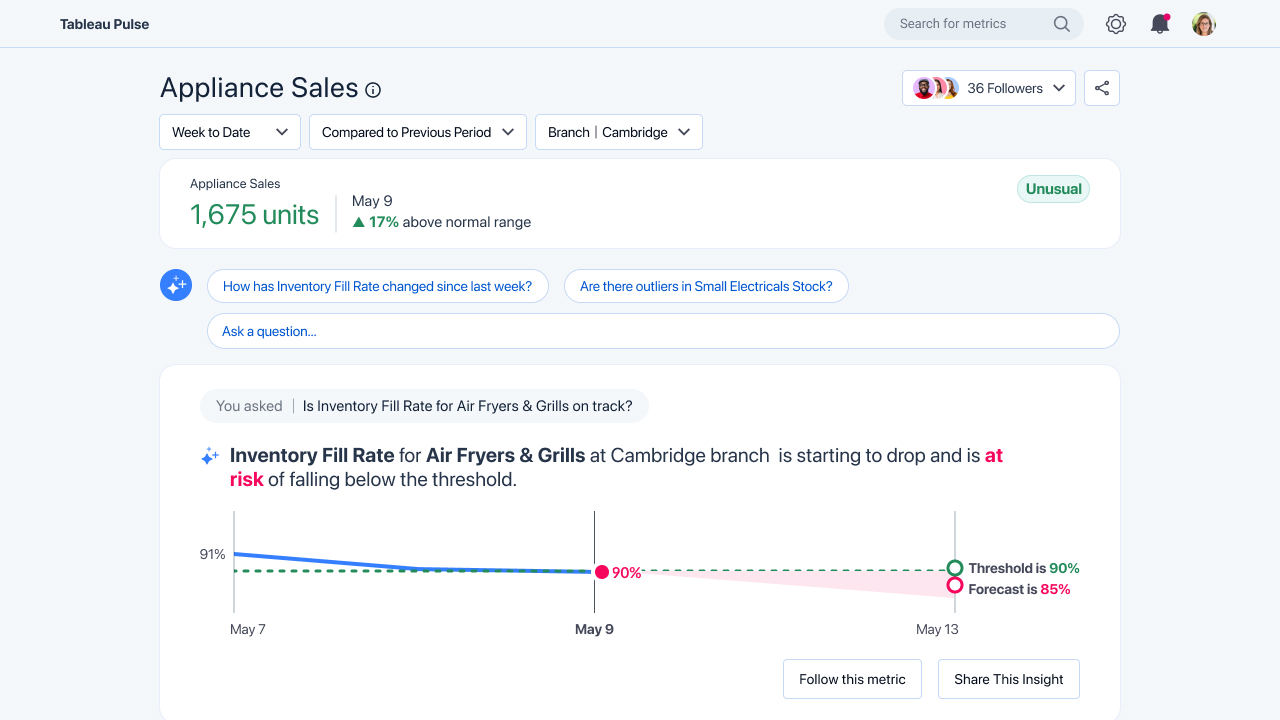
Tableau AI lowers the barrier to data with generative AI
With the arrival of mainstream generative AI, we can now respond to complex questions with equally complex answers that sound as if a human wrote them. Tableau AI leverages generative AI technology to help everyone increase their data culture and reach the nearly 70% of employees not using data tools to make data-driven decisions today. Tableau AI does this while considering the trust concerns customers are raising. In fact, for the last six years, Salesforce’s had an AI ethics group establishing principles for the ethical use of AI technology.
Tableau AI is a suite of capabilities that brings trusted predictive and generative AI to the entire Tableau Platform to simplify and democratize data analysis and insight consumption at scale. This accelerates time to value and reduces repetitive tasks for the data analyst with smart suggestions and in-product guidance. And because Tableau AI is built on the Einstein Trust Layer, it allows administrators to enable trusted, ethical, and open GPT-powered experiences without compromising data security and privacy. Tableau AI also empowers business users with smart, personalized, and contextualized insights in the flow of work.
Twenty years ago, Tableau completely transformed analytics by reimagining how millions of people could easily see and understand their data. With Tableau Pulse powered by Tableau AI, we’re going to transform the industry yet again with a brand new experience focused on the analytics consumer, one that will empower everyone to become truly data-driven in this new era of analytics.
Want to learn more? Watch the demo to see how Tableau Pulse powered by Tableau AI comes to life and request to activate Tableau Pulse on your Tableau Cloud site.
Related stories
Trusted Knowledge Drives Smarter Decisions—How Tableau Approaches Agentic AI Differently
 5 May, 2026
What is Tableau Next?
12 March, 2026