From ‘Here’ to ‘There’: Exploring Proximity Semantics in Multimodal Data Exploration


Modern data exploration tools often struggle with a basic problem: people typically know the pattern they are looking for, but cannot easily express it through SQL, filters, or natural language alone.
In this project, we built a multimodal research prototype that lets users search data using sketches, annotations, and natural language together within the same interaction space. Users form queries by sketching trends or spatial paths and then augment them with annotations and analytical directives, e.g. “Show me all the baby names that were popular here.”
Why this work matters for modern analytics
This is interesting for a couple of reasons. First, data analytics is no longer confined to SQL programmers and data specialists; in many ways driven by Tableau, data analysis has become both democratized and commoditized, making analytical fluency a baseline expectation for many people in decision-making roles. As a result, we can no longer assume a high degree of technical expertise from users; instead, we need to meet people where they are. To support this shift, our research prototype lets people interact with data using basic natural concepts and gestures like sketching, arrows, circling, scratching out, and natural language.
The second reason why this work is interesting is because it attempts to formalize the semantic constructs that underpin these natural concepts. To this end, we introduce the term proximity semantics (PS), a construct for reasoning about how spatial relationships and visual cues convey meaning. For example, PS helps explain why marks such as arrows naturally communicate reference and intent.
While related ideas have long been studied across philosophy, linguistics, and semiotics, PS attempts to unify these perspectives into a single conceptual framework for analyzing multimodal analytical interaction.
Inside the prototype: How the multimodal system works
For this project, we developed a multimodal data-search design probe, shown below in Figure 1. The system supports time-series data shown either as geospatial traces (top image) or line plots (middle & bottom images). It supports trend search (top image, purple line) and free-form annotations (top & middle images, black lines):
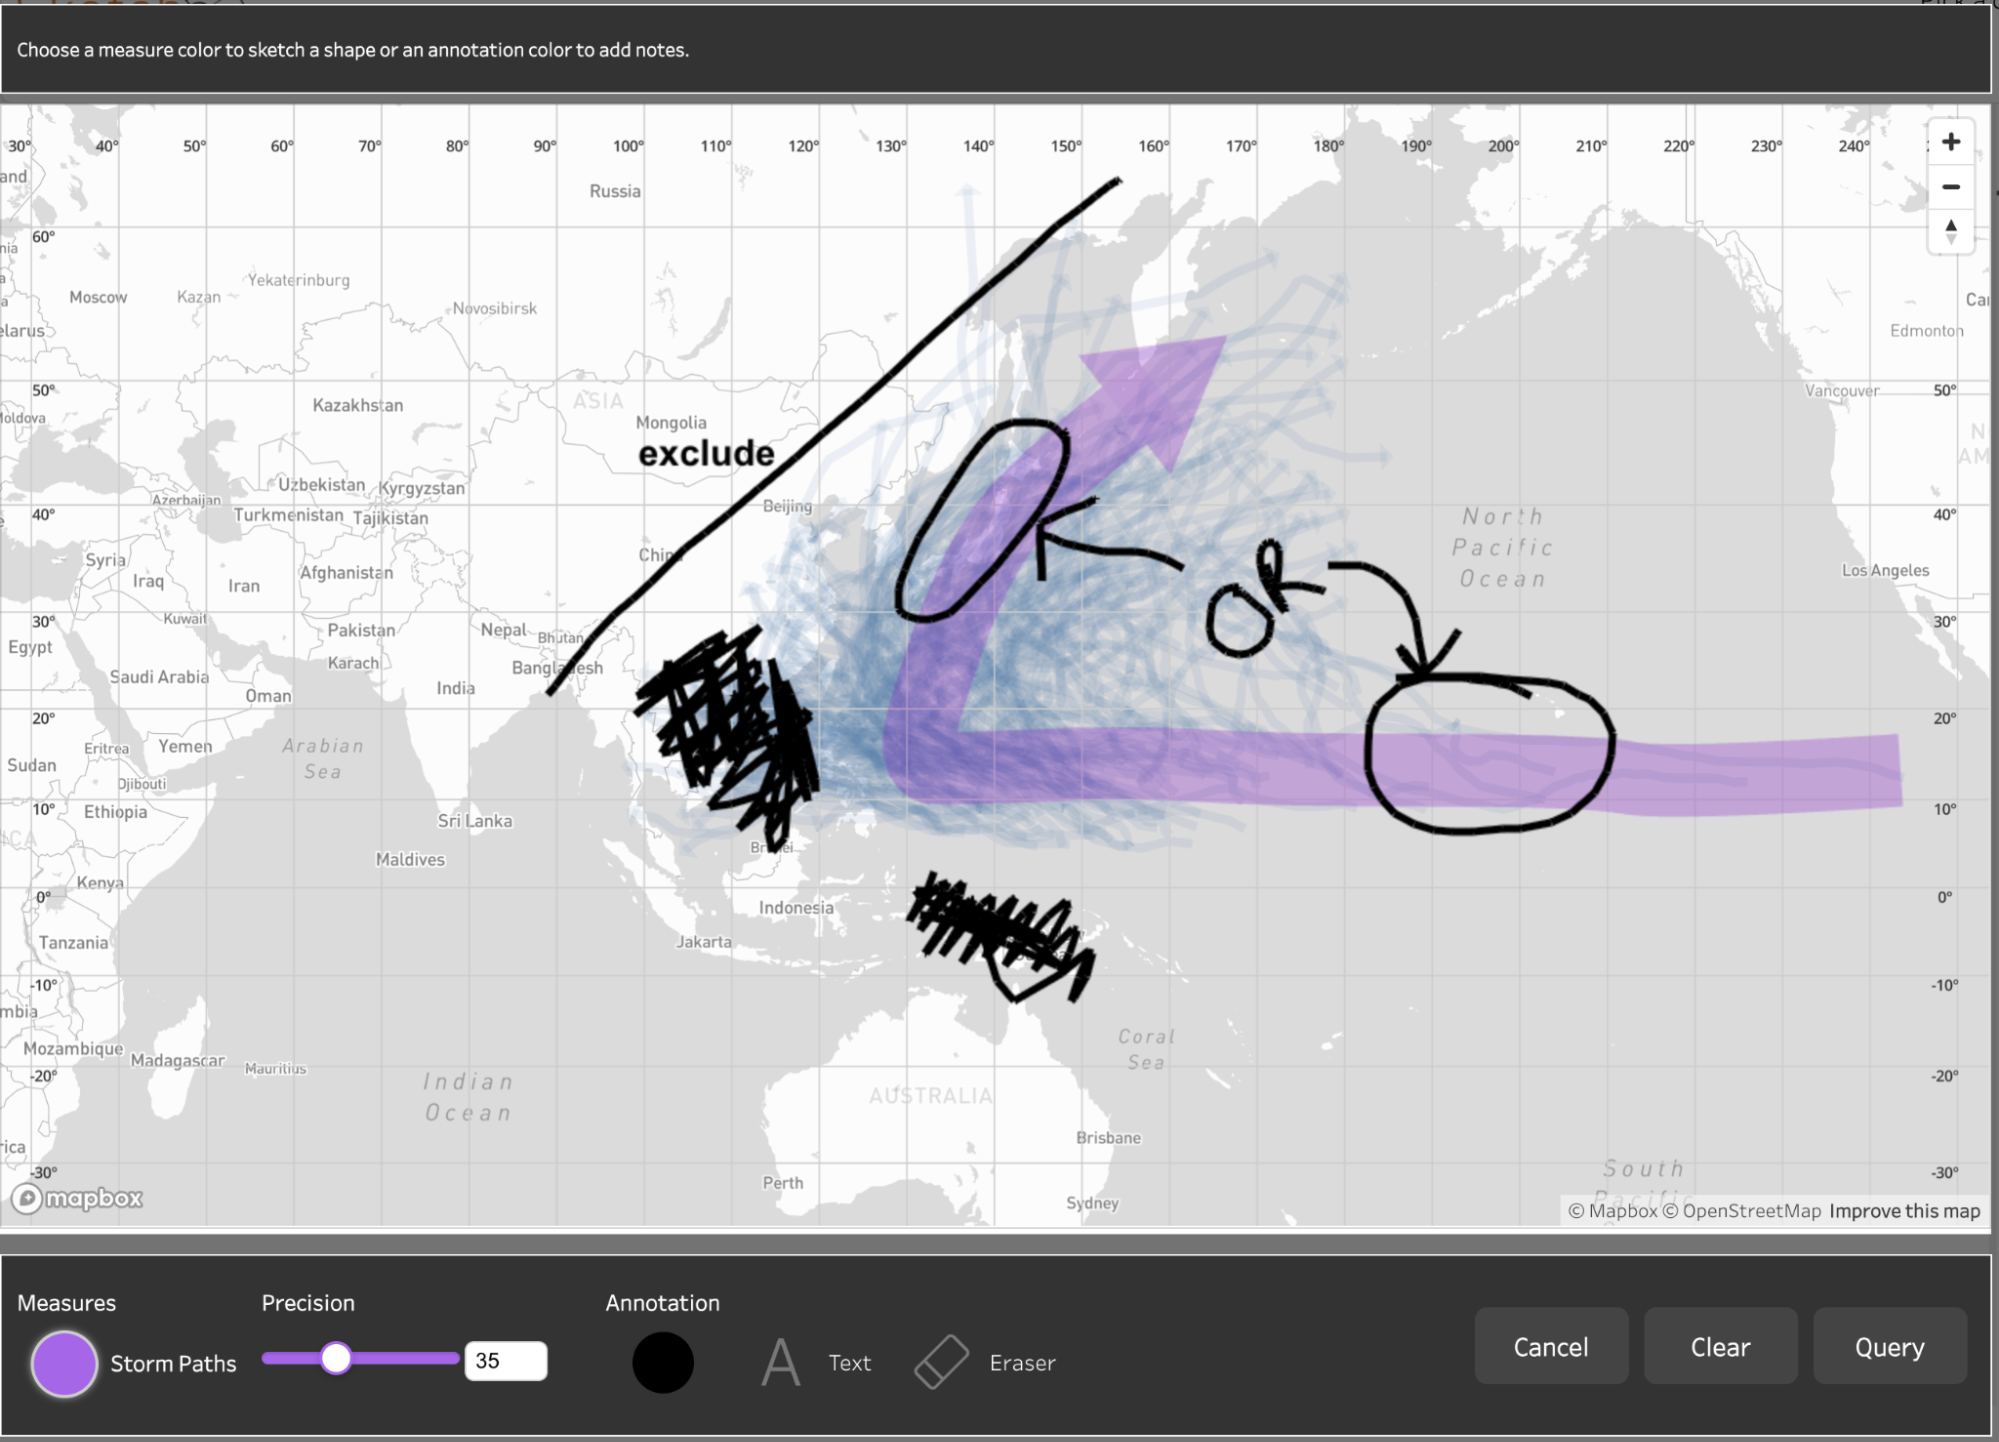
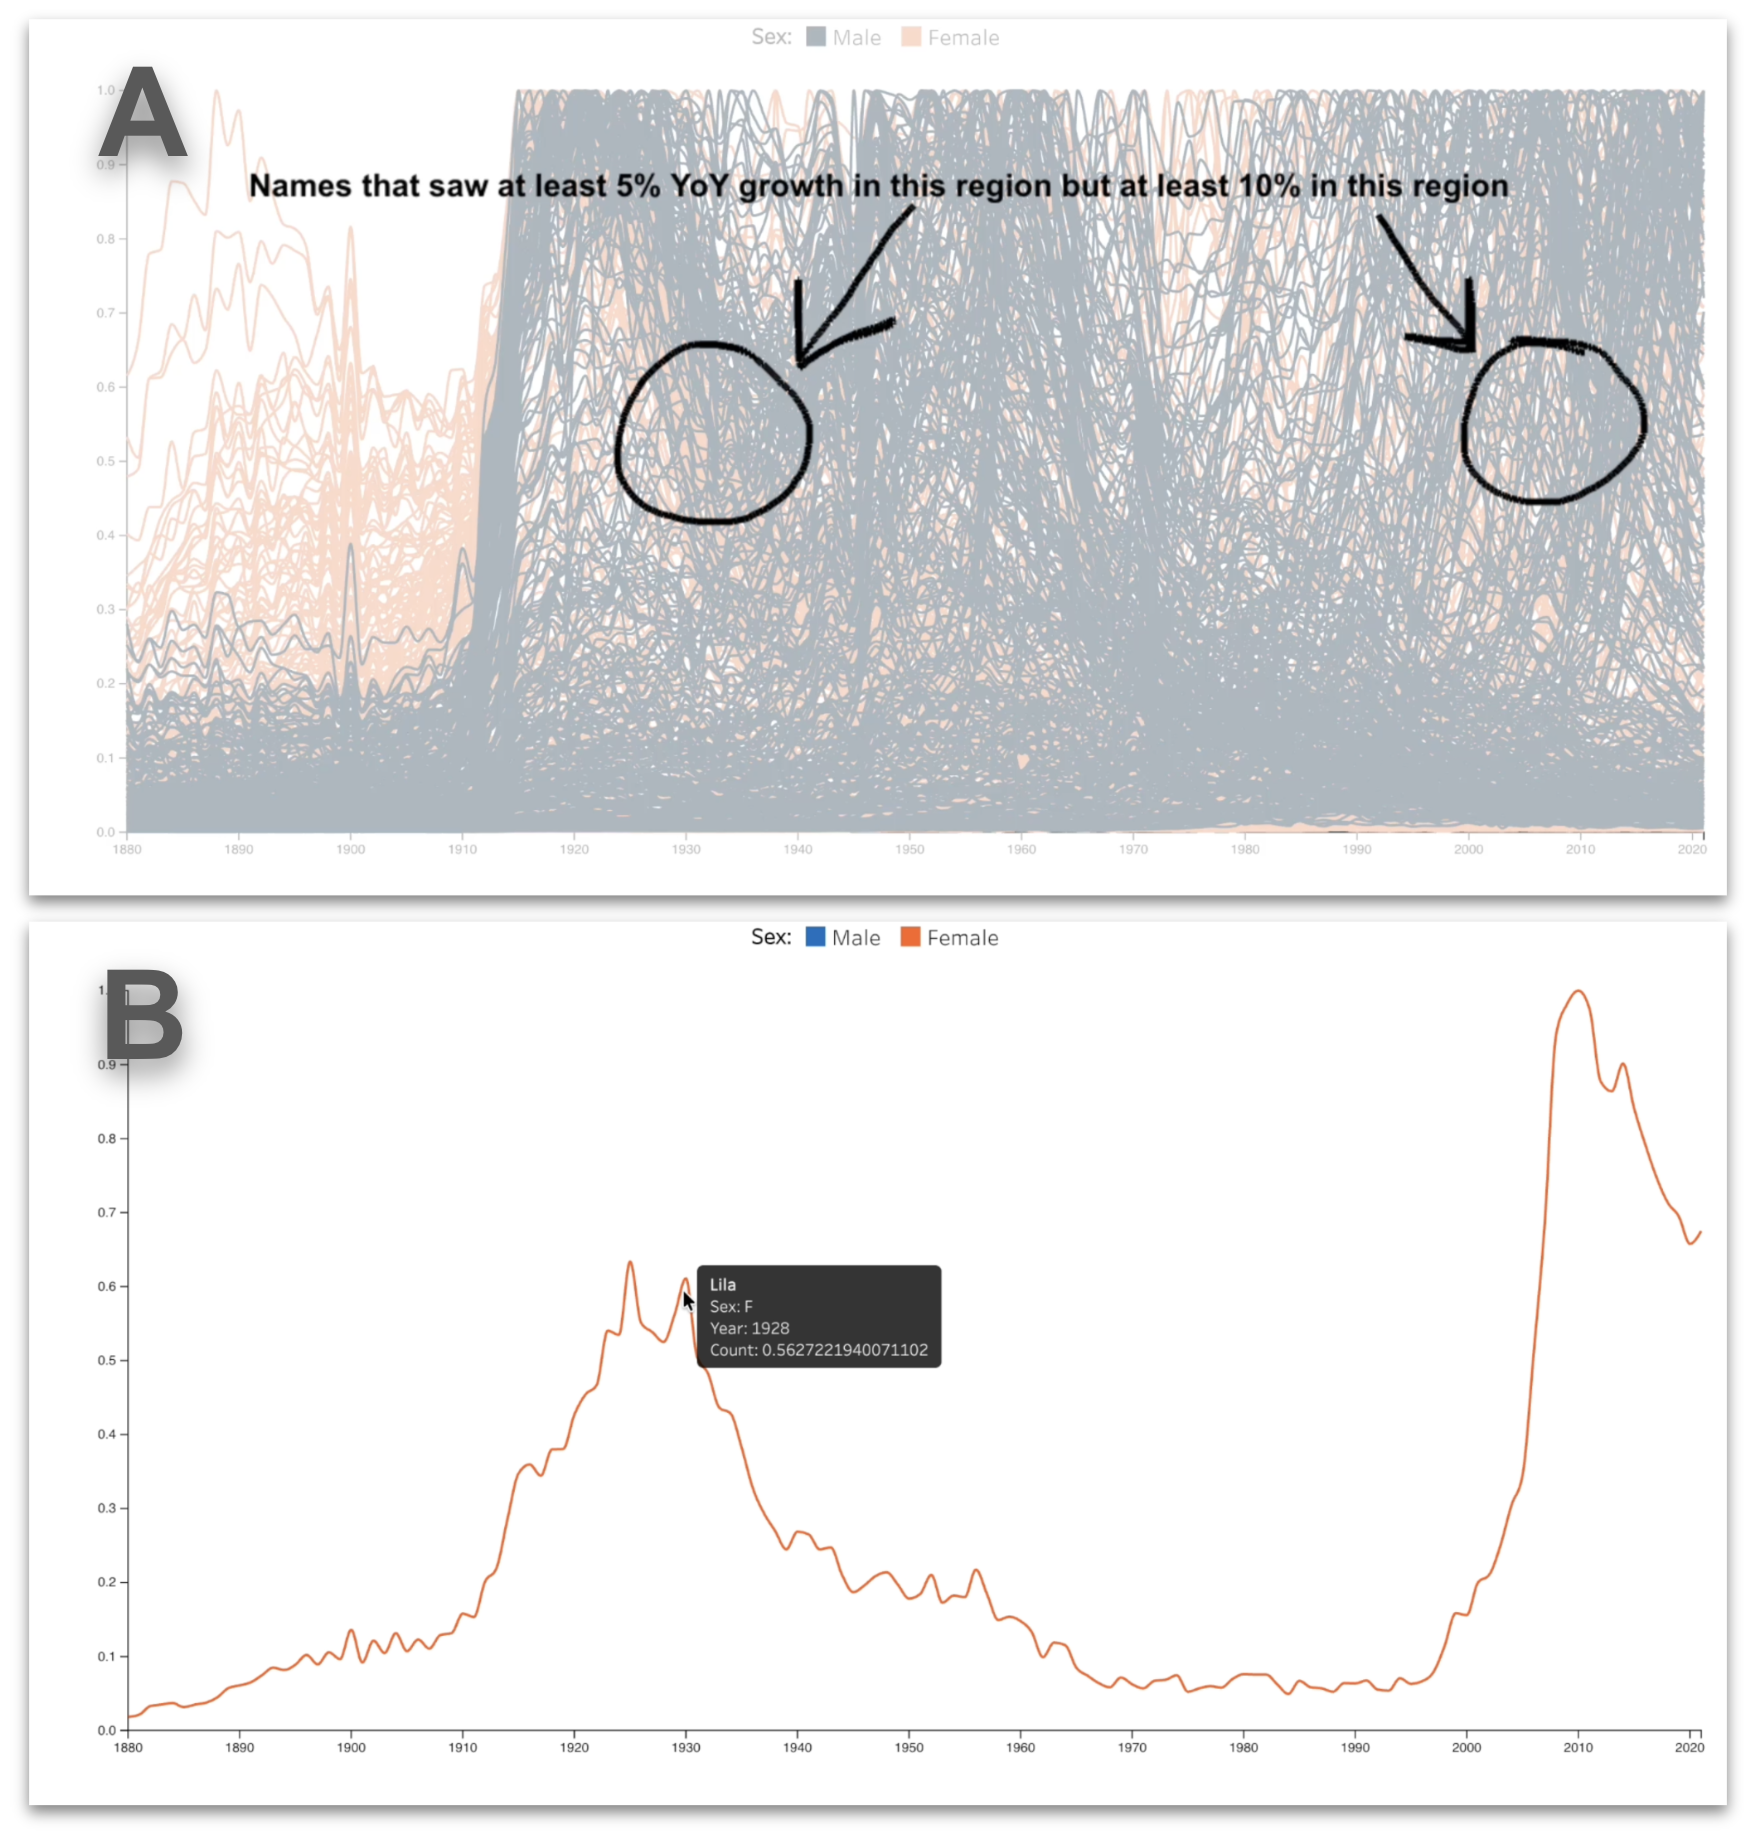
Figure 1 shows our design probe in action. (Top, middle) Users can sketch trends directly over visualizations, annotate regions using arrows, circles, or cross-outs, and combine these with natural language instructions like “show storms that pass near Japan but avoid this region.” (Bottom) The system combines geometric trend matching with annotation interpretation to return matching results.
Users can perform trend search by sketching, “show me paths that look like this.” Users can also control how strictly the sketch should be interpreted. For example, should the system match the overall shape regardless of scale? Should it preserve relative position, or ignore location entirely? Additional controls allow users to tune the tolerance and interpretation of the sketch in several ways.
The black annotation lines also let you specify search parameters. Rather than indicate specific geometric matches, the lines can be anything—they are completely free form. You can circle things you want to keep, scratch out stuff you don’t, write natural language instructions, you name it.
You can even write SQL out longhand. One study participant, for example, labeled regions “1” and “2” and later referred to them by handwritten notes. While we did not anticipate many of these behaviors, they worked out anyway—that’s the beauty of a flexible model.
This raises an important question though: if annotations can express almost anything, why separate trend sketches from annotations at all? The reason is precision. LLMs can feel almost magical, but at the end of the day, when you need three-decimal-place precision, you want deterministic math rather than probabilistic LLMs. Hence the separation.
At the end of all of this, the system intersects the results found by the trend search with the results inferred from the annotations, and shows the combined result to the user.
Proximity semantics: How proximity creates meaning
As we were looking at results from a user study with 20 participants, we became increasingly interested in how participants used labeling, arrows, sketches, and spatial placement to communicate meaning. Look at Figure 1A; the arrows indicate which parts of the data the sentence is referring to. Moreover, the sentence is giving analytical instructions that cannot be resolved without resolving which ‘this’ refers to the region over there and which ‘this’ refers to the other region over there.
All of this ultimately concerns semantics, i.e., how meaning is established and interpreted. More specifically, it relates to semiotics: the mechanisms through which symbols, marks, and spatial arrangements acquire meaning. We noticed that participants frequently expressed meaning through proximity; they placed labels near regions of interest, positioned annotations adjacent to specific visual elements, and used arrows whose endpoints connected text to referents across space.
In these cases, meaning did not arise from any single modality alone, but from the spatial relationships among words, glyphs, and visualized data. This led us to ask: how can we more formally characterize the role of proximity in multimodal analytical interaction?
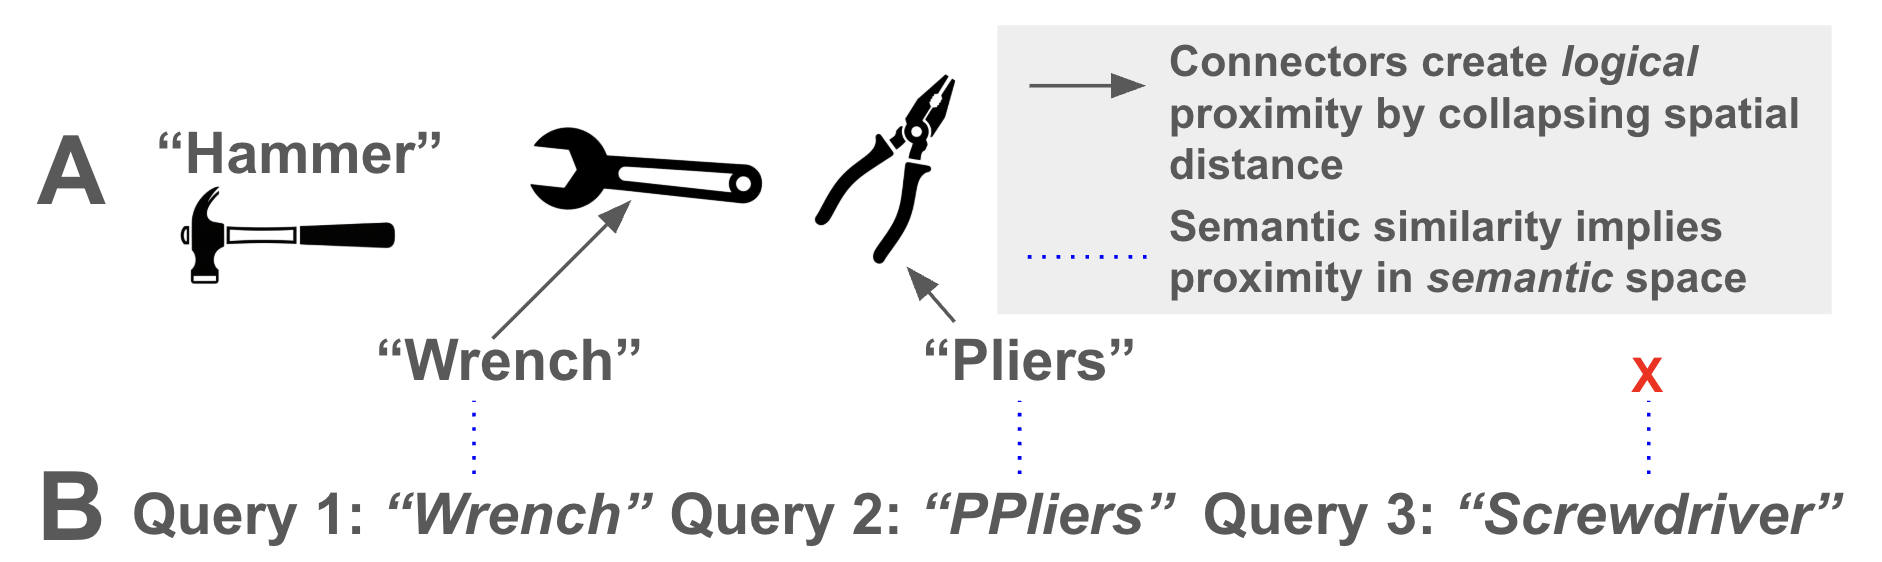
Figure 2. (A) PS examples; the hammer is labeled by simple proximity but the wrench and pliers are labeled via arrows. (B) PS queries.
The key concept behind proximity semantics is the notion that objects can be proximal in many different spaces, e.g. two RGBA color tuples might be proximal in color space while two words might be proximal in semantic or lexical space.
For example, in Figure 2A, we see three tools: a hammer, a wrench, and a pair of pliers. The hammer and its label “Hammer” are proximal to one another in canvas space—their measured distance in the figure lies within some acceptable threshold for us to believe that they are semantically connected (they are “close enough”). Thus, we believe that that tool is called a “Hammer.
Now let’s look at the wrench. Its label “Wrench” is actually closer to the picture of the hammer, so why do we believe that “Wrench” is associated with the wrench? Because of the arrow. But what is the semiotic role of the arrow? How does it achieve the function of labeling the indicated object?
In PS, we formalized the notion of a connector (e.g. an arrow) that short-cuts measured space, i.e. we can pretend as if the space traversed by the connector doesn’t really exist. In this model, the wrench and the label “Wrench” are now right on top of each other! Within the PS formalism, the wrench and its label are now logically proximal. From there, we are back to the same simple proximity analysis that we used to label the hammer. We see this same arrow-proximity effect with the pliers as well.
Now let’s look at Figure 2B. These are queries. Assume we are searching for the tools in Figure 2A. The first query “Wrench” is semantically and lexically identical to the label “Wrench”—thus the query and the label are proximal in those two measurable spaces. And we know that the arrow between the wrench’s label and the wrench itself collapses that space. So the end result is a proximity chain that places the query “Wrench” proximal to the wrench itself, completing the query.
We see a similar chain happening with the pliers, but here the query is misspelled. However, the distance between the query “PPLiers” and the label “Pliers” in lexical space is still “close enough” for us to consider them proximal. From there we arrow-link to the pliers themselves and we have again connected the query to the object.
Finally, we can consider the query for “Screwdriver.” That query is too far in semantic and lexical space from the available labels for us to believe there is a connection. Thus, no chain forms and no object is proximal to the query; thus, that query has no result.
So, in summary, PS has three basic primitives: 1) measurable spaces, 2) connectors that short-cut those measurable spaces, and 3) chains of proximity-connected objects. Taken together, we can build semantic chains that explain the propagation of semantic meaning.
The broader impact of proximity semantics
Ok, first—this is cool, right? At a conceptual level, we find this exciting because it suggests that many seemingly different interaction techniques may share a common underlying structure. Footnotes, for example, establish meaning through proximity in symbol space. Visualization legends rely on proximity in color and spatial space. Even gestures such as “look at that one!” depend on establishing referential relationships between language, motion, and visual context.
Second—it’s useful! A single overarching formalism lets us build integrated tools and have cogent conversations about seemingly disparate scenarios. Look at Tableau’s VizQL formalism—part of Tableau founder Chris Stolte’s original PhD thesis that was and is the central driving engine behind Tableau. Formalisms are important because they clarify our thinking so we can make useful things.
Thank you for taking the time to read about our work here at Tableau Research.
Interested in learning more?
- We will be presenting this work at EuroVis 2026 in Nottingham, UK (yes, that Nottingham) June 8–12.
- Also, please check out the paper—we would love to know your thoughts!
- For information on more of our projects, please visit the Tableau Research web page, or visit us at various Tableau User Group talks around the community—hope to see you soon!
Related stories

AI Can Draw the Chart. Tableau Defines the Truth.
 27 March, 2026

Stop Trying to DIY Your Way to Conversational Analytics
 5 March, 2026
Ending Semantic Drift: The First Unified Business Logic Foundation for AI and BI
27 January, 2026