"Chuting" for Speed: A Dad's Quest for Answers


After about an hour and a half of one particularly tedious game, I realized that I could write a program to simulate Chutes and Ladders and answer the key question for parents: How long does a typical game take?
I figured I would write my own quick-and-dirty simulation, save the results of every move by every player in every game, and feed those results into Tableau's data visualization software to get the answers I wanted. Those of you who have used the Tableau Software product before won't be surprised to hear that I got much more information than I initially expected.
(By the way, I'll defer discussion of the technical details of Chutes and Ladders -- and my simulations of it -- to a second post.)
First, a quick recap of the game rules: The board has 100 squares; the first player to advance to square #100 is the winner. Normally players move 1-6 squares at a time, based on the result of spinning a spinner; but landing on certain squares forces the player to move upward (via a "ladder") or downward (via a "chute"). One other twist: if your "spin" takes you past the end of the board (eg you're on square #99 and you spin a 3), you have to stay where you are.
So after playing around with my game-simulation data in Tableau, here's what I found. First off:
- If you're budgeting time for a Chutes and Ladders game, plan on about 30-40 moves per player for a 3-player game. So if there's less than an hour until bedtime, consider bringing out a different game.
To see why, take a look at the statistics that Tableau came up with, using data from 32,000 3-player game simulations. To get this result, I filtered out all moves except the ones that had endpoint 100 (the winning square), then took statistics on my database records.
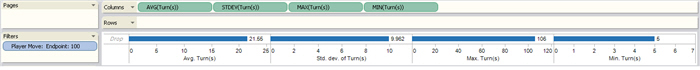
The average game is about 20 moves -- much shorter than I expected. But the large standard deviation (~ 10 moves) shows that it's really difficult to talk about a "typical" game because they vary so widely. As a parent, it’s best to plan for the longer games and play it safe. About 95% of 3-player games will finish within 40 moves (mean + 2 SD’s).
To see more details on this, take a look at the histogram of game length -- that is, the number of games that took (n) turns, plotted against (n) -- which Tableau generated for me:
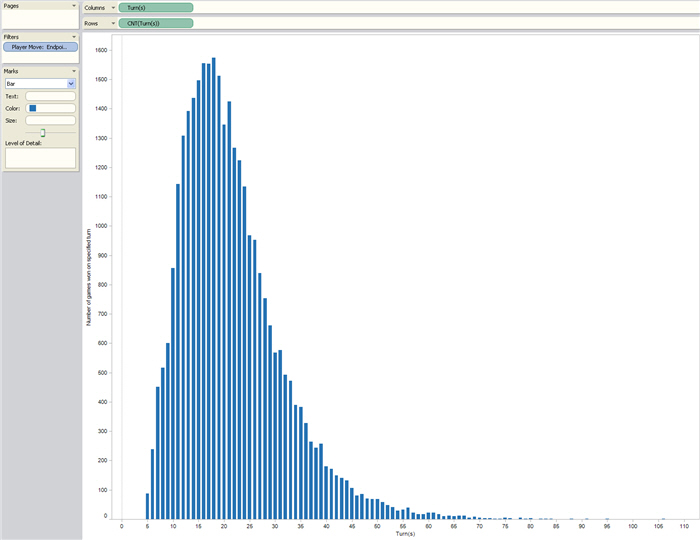
As you can see, there are a lot of relatively short games, but there's a nontrivial "tail" of rather long games. So to reinforce the point above:
- Once you get past 40 moves in a game, don’t assume you’re "almost" done. There is a substantial probability that you’re not. Instead, just call it a tie and pack it up.
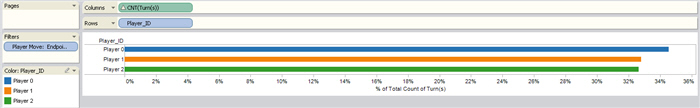
So now we have an idea of how long it takes to win. That brings up another question: Who usually wins? Is there an advantage to going first? I’ll put it this way:
- The official Chutes and Ladders rules from Hasbro specify that the youngest player goes first -- make sure you follow that rule.
Why? Because there is a slight advantage to the first mover. Here's a plot of winning percentage for each player in a 3-player game:
Now that I had the information I wanted about game lengths and winners, I was curious about how the game (on average) evolves over time. Using the Pages shelf in Tableau is ideal for visualizing time-dependent processes like this. I used it to make a movie of the distribution of player position.
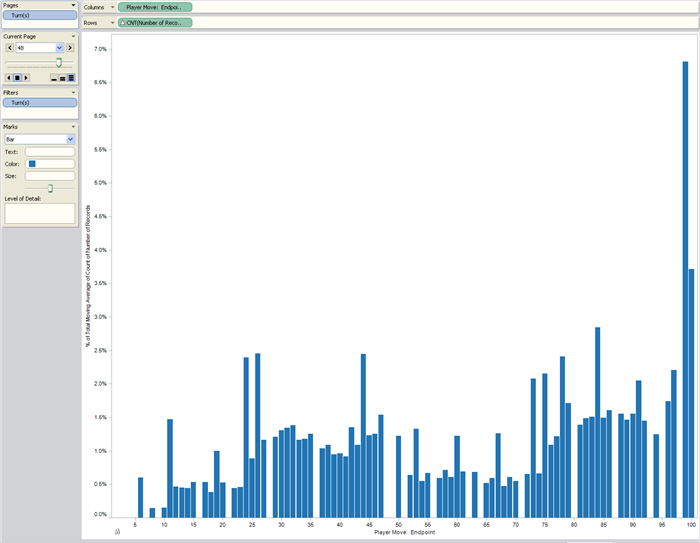
Here, each bar represents a square, and the height of the bar represents how likely it is for a player to be on that square. (Disclosure notice: I’ve used a moving average and filter to smooth the animation easier to interpret; it makes things a little smoother, but doesn’t change the conclusion.)
As you can see, this distribution actually reaches a sort of steady state. Even though players are moving back and forth across the board, the likelihood of a square being occupied (given that the game hasn’t ended yet) is fairly constant. Why does this happen? It’s an interesting linear-algebra question which I’ll leave for my next post.
My final advice for parents:
- If your kids are insisting on Chutes and Ladders and it’s close to bedtime, show them the movie above. They may forget about playing a real game.
Like any interesting analysis, this brings up at least as many questions as it answers. What happens if you modify the board? What if you modify the rules? What if you add occasional random moves (representing accidental piece knockdowns or toddler intervention) – do positive and negative random events cancel out?
I'll talk about all that in my next post, as well as how this Chutes and Ladders simulation turned out to be related to software testing, conditional probabilities, Markov Chains, search-engine rankings, leaky water buckets, and other such things.
And as for the children in our family? Well, they're not sure why I did all this data analysis. They enjoyed watching the Pages shelf animation of Chutes and Ladders and asked me to play it many times. But now they're into Connect Four -- a much harder simulation!
If you'd like to play around with a smaller version of this data set, you can download the packaged workbook. You'll need Tableau Desktop 3.5 or higher, or the free Tableau Reader. Your views will look a little different and your statistics won’t be quite so clean – with the full data set the workbook would have been a 2 GB download.
Related stories

5 Ways to Use Tableau Public to Achieve Your Goals
 11 January, 2025

World Mental Health Day: Elevating Awareness Through Data Visualization
 10 October, 2024

From TV Screens to Tableau: Visualize Your Favorite Shows with IMDb
 31 August, 2024