An introduction to data prep: What is an aggregate function and how do you combine aggregated data?


What is an aggregate function?
Data is generated and analysed at many different levels of granularity. Granularity is the level of detail of the data. For example, when looking at graduation data, granularity would describe whether a row in the data set represents a single person or the graduating class of a university.
But what if you wanted to take a data set of student information and identify a value for the graduating class as a whole – that is, decrease the granularity? Aggregation and granularity are complementary concepts. Aggregation is a mathematical operation that takes multiple values and returns a single value: operations like sum, average, count or minimum. This changes the data to a lower granularity (aka a higher level of detail).
Understanding aggregations can sometimes depend on what you’re trying to accomplish. Skip ahead to understand how to combine aggregated data or visit the online help to learn how to aggregate values in Tableau Prep.
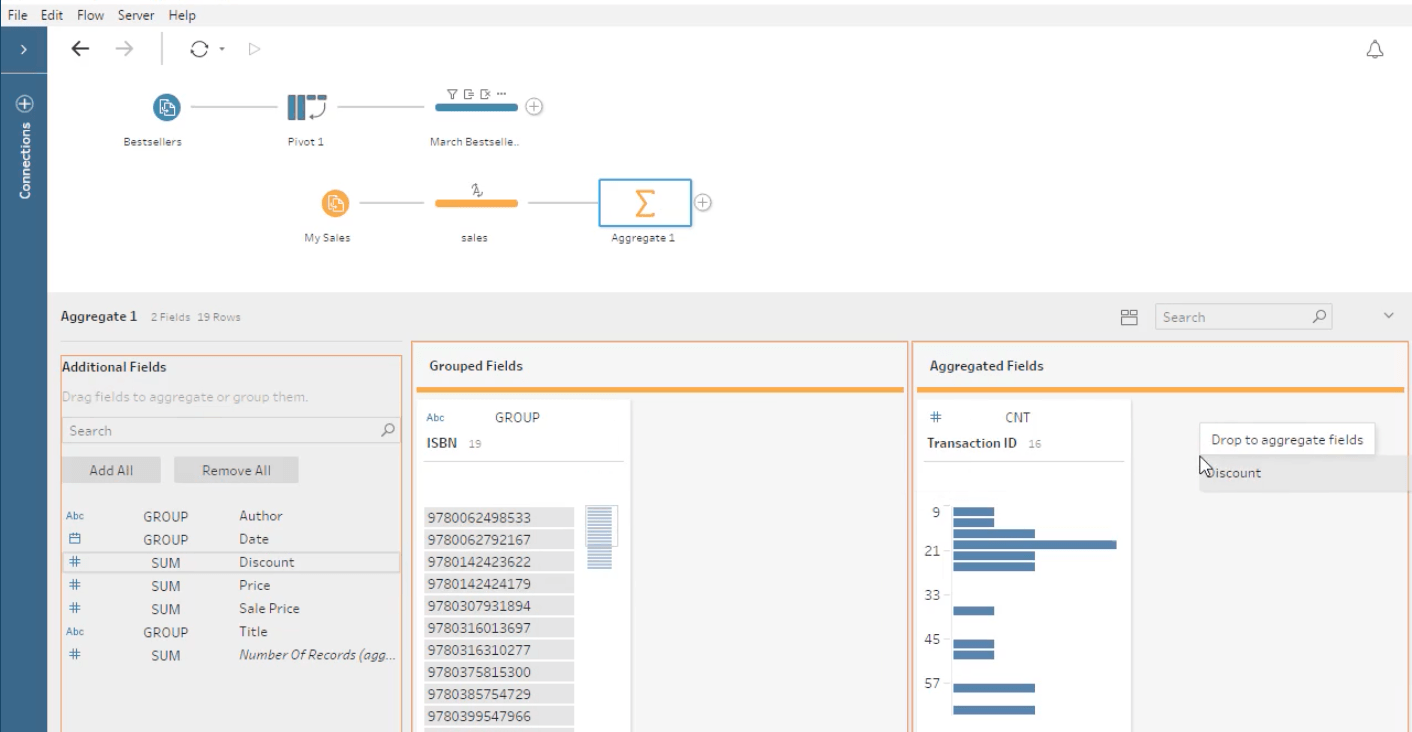 Watch a free training video on the Aggregate step in Tableau Prep.
How aggregations are constructed
If your analysis requires aggregation, you need to consider two things:
- How the outcome will be structured: Consider the new granularity – that is, what a row represents. If we’re looking at voter turnout, is it at the level of political party? Political party and voting district? Political party, voting district, age bracket and gender? The field or fields that determine what makes up a row are the grouping fields (in Tableau Prep).
- How we aggregate multiple values down to a single value: For example, are we summing the number of shirts of each colour for a total number of shirts? Are we taking the maximum hourly temperature reading over the course of a day and providing the daily max? Are we doing a count distinct of IP addresses to hit a web page and measuring the unique pageviews?
Numeric fields can be aggregated by various mathematical operations depending on the desired outcome. See the full list here. This includes:
- Sum
- Average or median
- Count or count distinct
- Minimum or maximum
- Or various statistical operations can be performed such as variance or standard deviation.
Dates and text-based fields can be aggregated as count, count distinct, maximum or minimum (for text, maximum and minimum are based on sort order).
Combining aggregated data
Oftentimes, data at different levels of granularity needs to be combined. For example, to give a comprehensive view for geospatial analysis, city-level data often needs to be combined with country-level data.
Joins are a common way to combine data. But if we perform a join across different levels of granularity, we will inevitably introduce issues of data replication or loss.
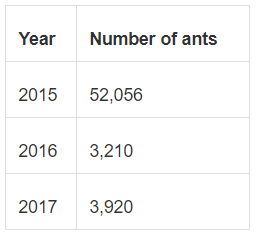
Let's say we have two tables of data, one with the observed number of picnic blankets in various colours per year, and another with the number of ants seen in a year. Here’s how the data looks:

If we join the tables, we’ll either:
- Repeat the number of ants seen for every blanket colour OR
- Lose the colour-level information
If we don't like either of the options above, we can choose to not join the tables and perform the analyses with the two tables independently.
1. Repeat the number of ants seen for every blanket colour: If we were to join these tables, we could simply replicate the number of ants seen in a given year for each row in the blanket table. And the resulting data would look like this:

Structuring the data this way isn’t perfect because we have the number of ants repeated for each year. This means that, in analysis, if we simply brought out Year and Number of Ants (as a sum) we’d quadruple the number of ants. To get around this, we’d need to use a different aggregation (such as average or min), or use an LOD expression to fix the number of ants per year, thus preventing accidental over-counting: {FIXED [Year] : MIN([Number of ants])}.
Data structured like the table above is also potentially misleading because it would be easy to assume that, as there were 18 grey blankets in 2015, there were 52,056 ants seen on those 18 grey blankets. Most data sets with this appearance are structured so each row is an independent observation, which could lead to misinterpretation if that’s not the case.
2. Lose the colour-level information: To get around that, we can aggregate the number of blankets, dropping the colour information before the join, resulting in a single data set with yearly information about ants and blankets.
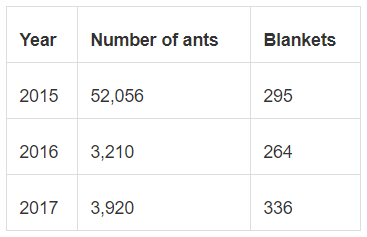
Now the data is neither replicated nor likely to be misinterpreted, but we’ve lost the colour breakdown entirely. Hint: Remember that changes in the level of detail can only ever be towards more aggregation, never more granularity. If we do this, we lose the colour information entirely.
The last alternative is to not join the data and keep each table separate, performing analysis on blanket colour or on ants, but not together as a single data set.
Conclusion
Now that we can identify why aggregation matters, we can choose to aggregate, combine and structure our data appropriately for our analysis. To see how to perform an aggregation in Tableau Prep, check out the free training video on the Aggregate step.
Tableau Prep helps everyone quickly and confidently combine, shape and clean their data for analysis. Learn more about Tableau Prep or try it for free.
Related stories

VizQL Data Service from Tableau: Use Your Data, Your Way
 8 August, 2024

When and How to Use Multi-fact Relationships in Tableau
 1 August, 2024

Top data books of 2021
 12 December, 2021