Inside the Release: Tableau 2022.2 for Analysts and Business Users


The Tableau 2022.2 release includes features that speed up and streamline your data preparation and analysis. Let’s dive into the capabilities that will help you make better and faster decisions.
Automate dashboard insights with Data Stories
If you've ever written an executive summary of a dashboard, you know it’s time consuming to distill the “so what” of the data. In addition to deciding what to include and how it’s communicated, it takes a lot of effort to keep the key takeaways updated as the data changes. Stop the endless cycle of write and rewrite. With Data Stories, you can automate customizable dashboard summaries instead.
To get started, add a Data Story object to your dashboard. Select which dimensions and measures to focus the analysis on, and choose the desired story type. Then, configure and edit your story so it's tailored to your needs. You can set characteristics to give context to your data, customize how your story is displayed, and even add notes, a header and footer, functions, conditions, and context variables.
Once set up, your Data Story serves as the perfect accompaniment to your visualizations, describing insights from your data in plain language. The augmented experience generates automated narratives in seconds, replacing manual reporting and speeding up analysis.
For business users, Data Stories provide an approachable way to consume data. They summarize key insights that anyone can read in a bulleted list or paragraph format. These dynamic stories automatically update with data refreshes and dashboard interactions, such as mark selection and filtering.
These automated, plain-language explanations are available now in Tableau Cloud and coming soon to Tableau Server (currently in English only).
To learn more, read Create a Tableau Data Story in Tableau Help.
Autosave your progress in web authoring
Have you ever been deep in work only to lose it all due to network connection issues? This painful experience is all too common. And when it occurs, it can set you back significantly.
With autosave in the browser, author online with confidence. As you work, your progress is automatically saved in an unpublished draft. Return to your work at any time with the option to continue editing or revert to the latest published version. And once you're ready to commit and share your changes, just click the Publish button.
Autosave makes web authoring more reliable than ever and balances convenience and control. Stay in the flow of work instead of worrying about the last time you saved. Additionally, autosave helps you maintain tight control over what other consumers see, and when.
To learn more, read Autosave Workbooks in Tableau Help.
Prepare data with more flexibility
It can be daunting to deal with the growing amount of data that exists. But, proper data preparation pays off in dividends. As we all know, good data analysis starts with data preparation. Tableau Prep makes this process easy, helping you reduce time spent on data preparation by 60%.
To enhance your data preparation, leverage the expanded Wildcard Union filters. At an input step, select your folders and subfolders then apply filters (file name, file size, date created, and date modified). These enhancements give you the granularity needed to automatically input files.
Additionally, data doesn't always come in the order you expect, especially when joining many different sources. To address this, use field list view to quickly reorder fields. Select one or many as you drag and drop columns. Your specified order is then maintained throughout the entire flow, ensuring your data is delivered in the way you expect and helping you get oriented quickly.
To learn more, read Add More Data in the Input Step and Examine Your Data in Tableau Help.
Find content faster with the reimagined Quick Search
The amount of content in your analytics environment can be overwhelming. As a result, it's often challenging to find—or rediscover—the content that’s relevant to you, unless you venture beyond the first page of search results.
That's why the new Quick Search experience puts your previous queries at the top, so you can quickly return to your favorite content. Below past queries, you'll find suggested content (spanning all content types) ordered by relevance. The same great Quick Search experience is also available from any page so you can discover relevant content faster.
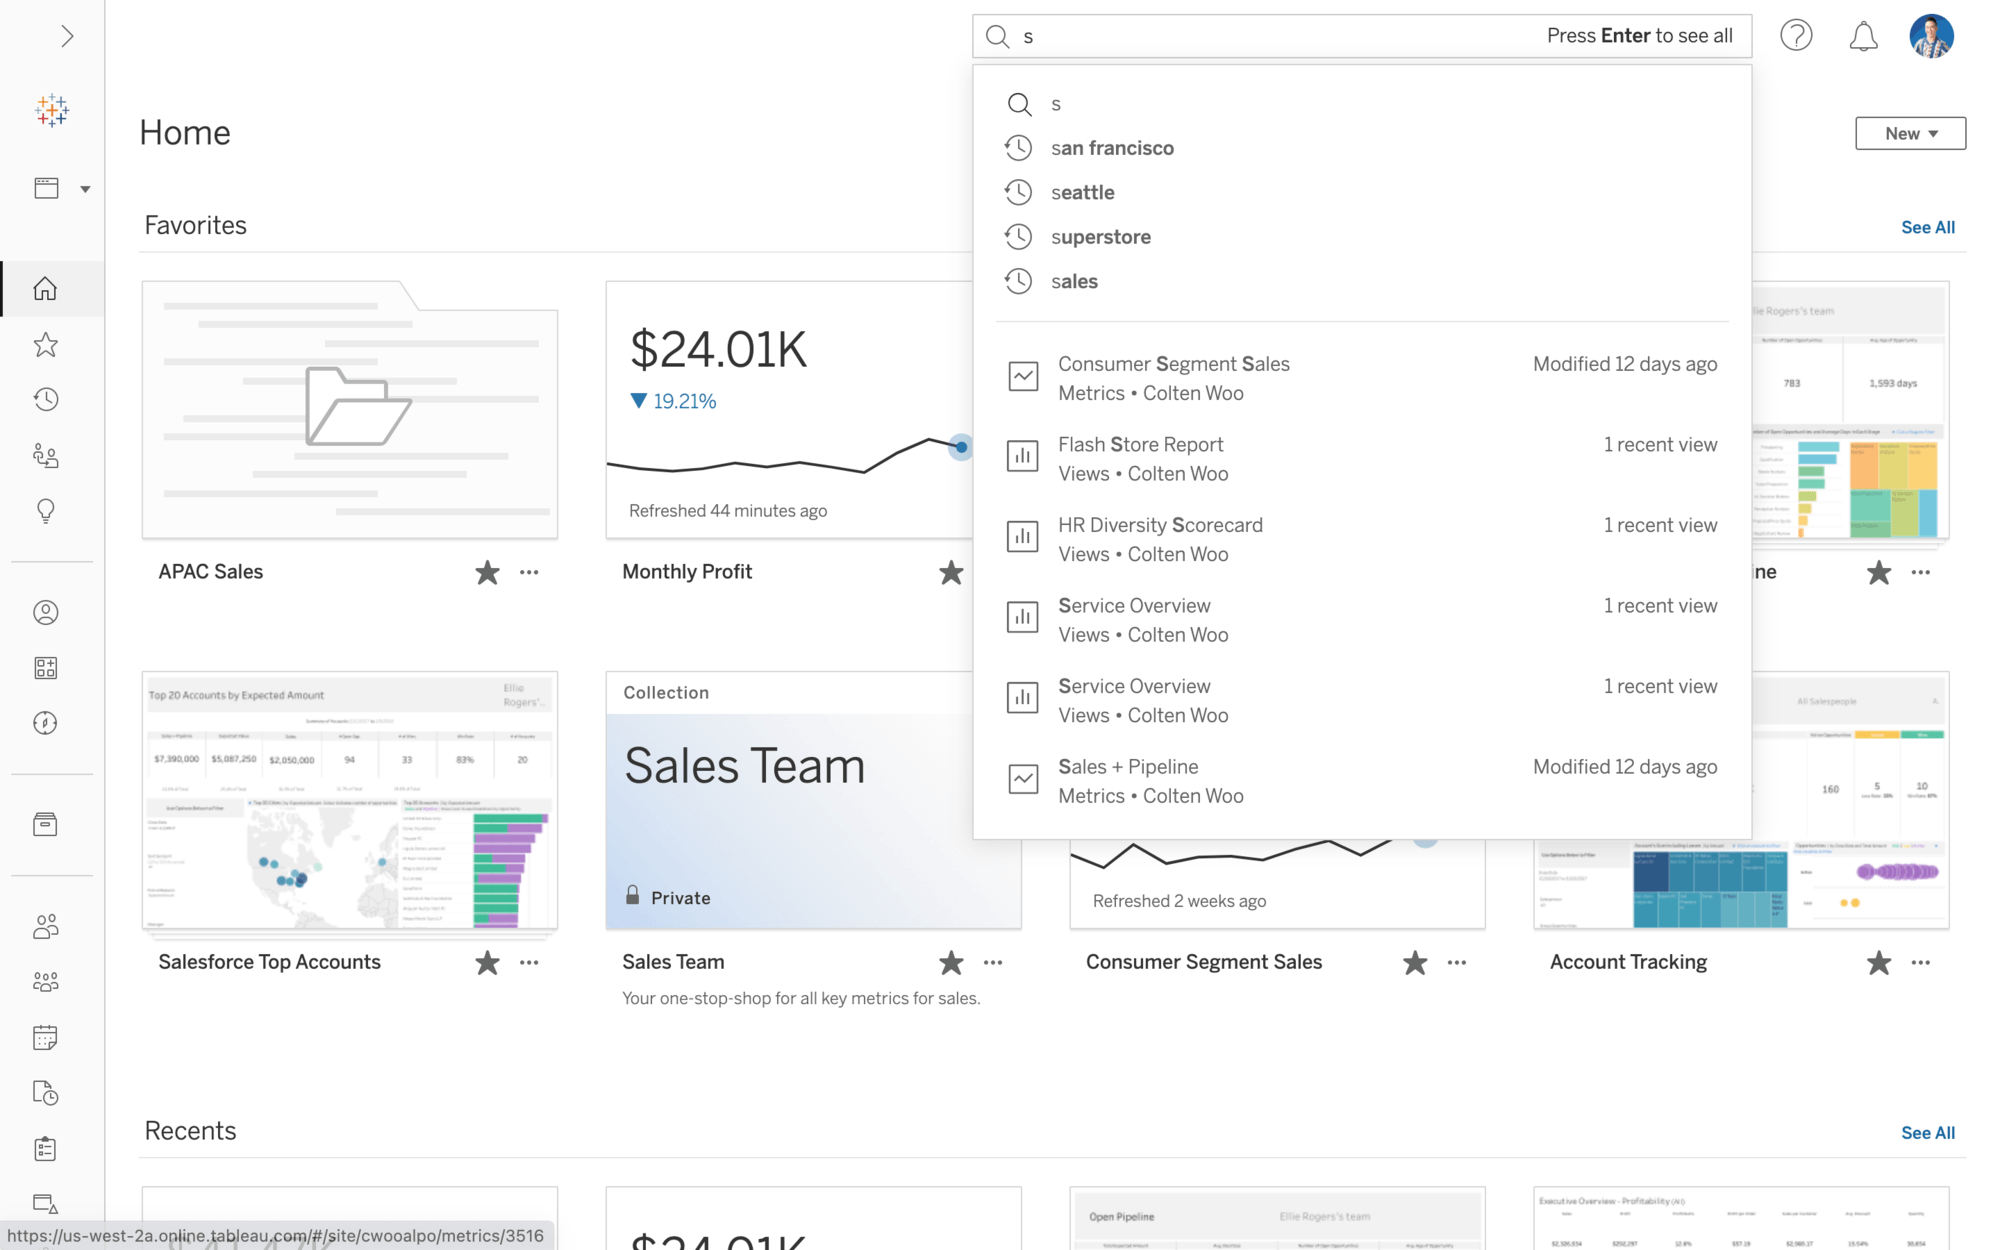
The new Quick Search experience is available now in Tableau Cloud and coming soon in Tableau Server.
To learn more, read Search Your Tableau Site in Tableau Help.
Configure Metrics to track your data at a glance
Business goals are constantly evolving as the amount of information you need to track grows. So how can you easily keep up to date with your most important data?
Metrics give you a streamlined view of your KPIs. Whether you're at your desk or on the go, you can track your data at a glance. And now, Metrics are configurable.
When viewing an existing Metric, hover over "configuration" and click the pencil icon. From there, edit the date range, comparison type, and comparison period. You can also adjust the date window switcher to view different date ranges without editing.
Use Metrics when you need answers fast. If you need more context, drill down into connected views to get a more holistic look at your data.
To learn more, read Create and Troubleshoot Metrics in Tableau Help.
Author on the web without compromise
You deal with disjointed workflows and an overwhelming number of applications. But Tableau Cloud solves for this by consolidating data preparation, analysis, and collaboration all in one place. What's more is you don't have to sacrifice capabilities for convenience.
Now, when you author on the web, you have more formatting options. Adjust the color and opacity of reference bands, and use custom formatting for labels. Additionally, you can format headers, panes, and table borders and dividers. You can also adjust the height of caption boxes via context menus.
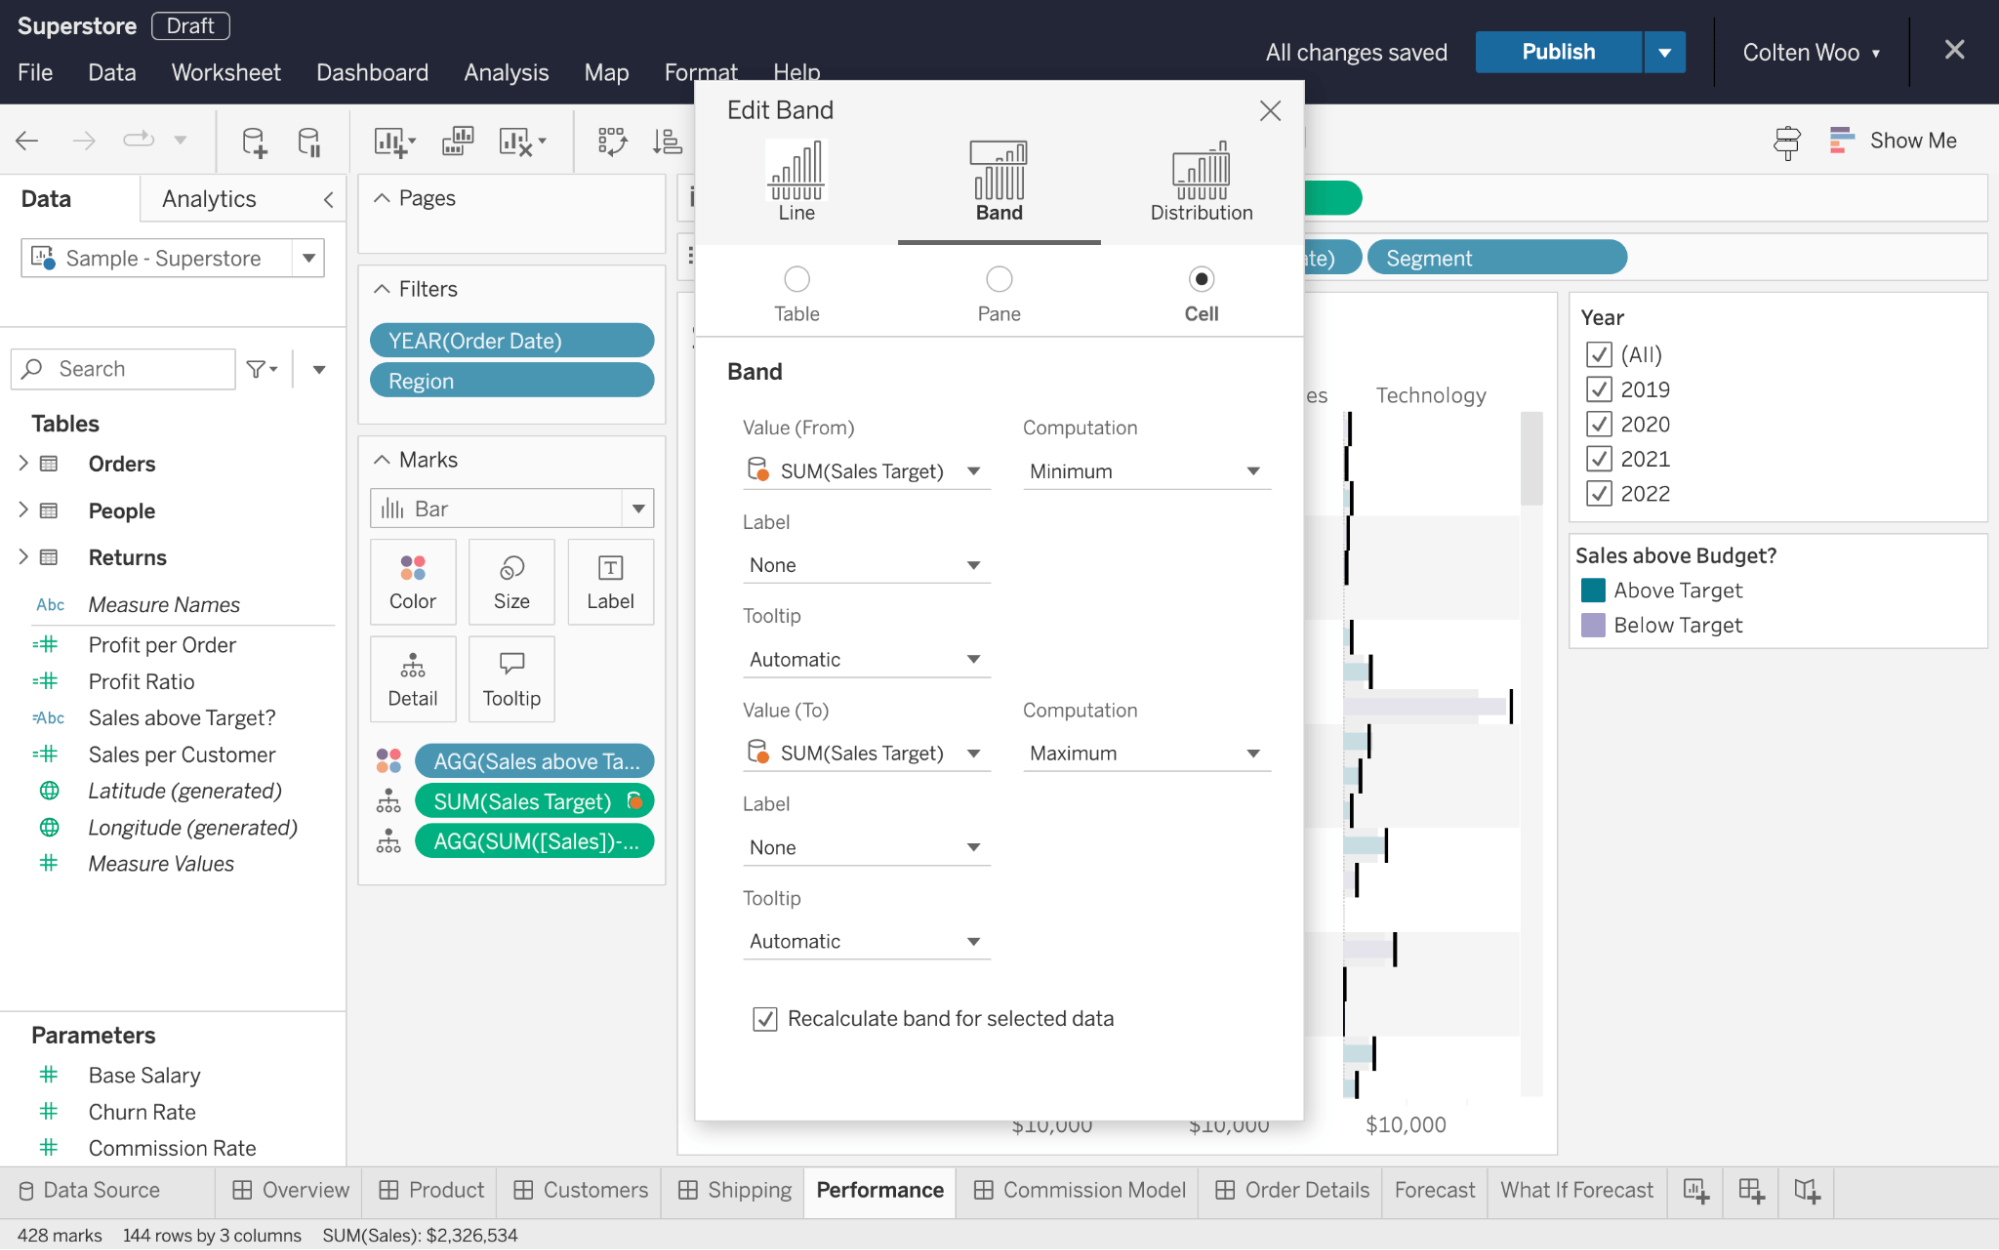
Your dashboards are even more customizable with these web formatting improvements, available now in Tableau Cloud and coming soon to Tableau Server.
Print from your browser without hassle
Presenting on a screen to a room full of people may only get you so far. Sometimes it's helpful to have handouts so everyone has a copy they can see up close and mark up.
Now you can print your Tableau visualization like any other document using your browser's native printing capabilities. It’s as simple as selecting the proper layout and scale.
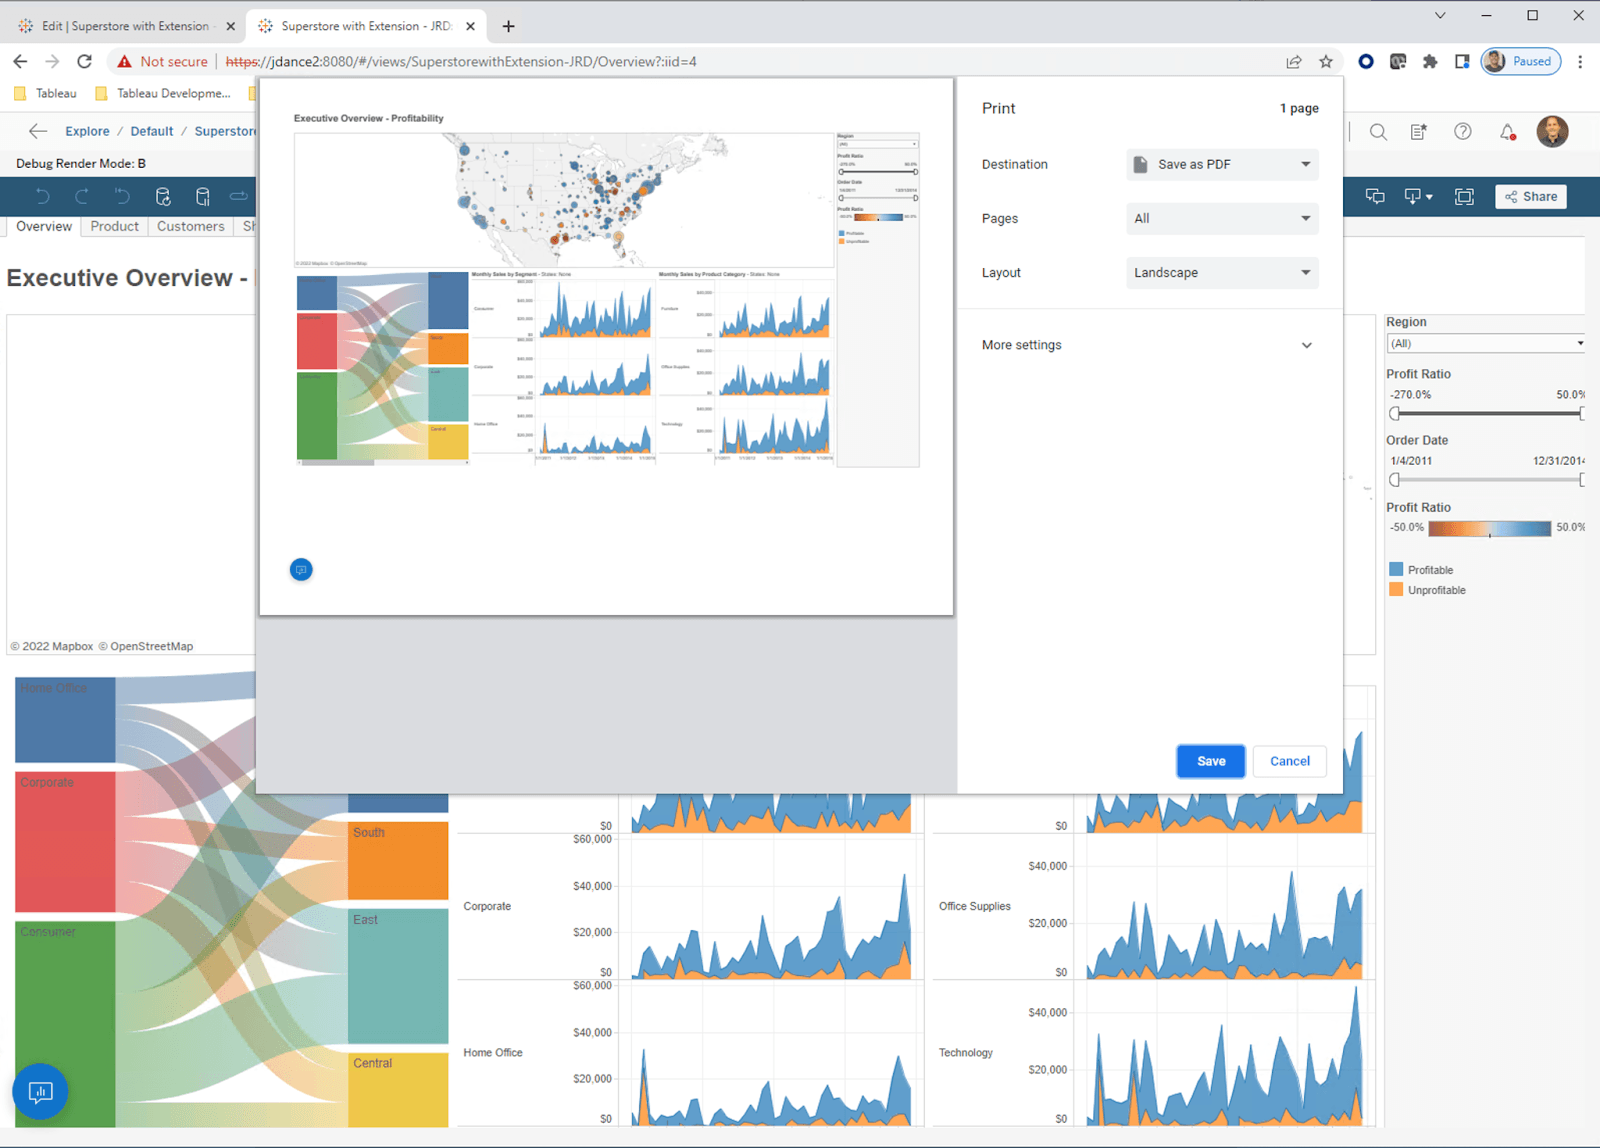
Bring Tableau with you wherever you go using this fast and intuitive process. This exporting method works especially well in embedded environments.
Seamlessly browse and use pre-built offerings with the in-product Exchange
Transforming a blank screen into a robust dashboard can feel daunting when you don’t know where to begin. So, why not start with a pre-built solution?
Tableau Accelerators are built by experts, come ready-to-use, and are fully customizable. And now, you can access Accelerators directly in Tableau Desktop to jumpstart your analysis. Click "More Accelerators" and use search and filter to find offerings tailored to your use case.
Accelerators are only one type of offering from the Tableau Exchange. Connectors give you access to more databases and applications, while Dashboard Extensions allow you to add unique functionality. Leverage more than 400 trusted offerings from the Tableau Exchange to jumpstart and accelerate your analytics journey.
Experience more flexibility when building dashboards with Ask Data
Using Ask Data, anyone can build visualizations with natural language. Just type a question, or point and click to build your query. Now, we’ve expanded support so you can add Ask Data to dashboards in Tableau Desktop. You can also choose to show or hide the Ask Data configuration toolbar.
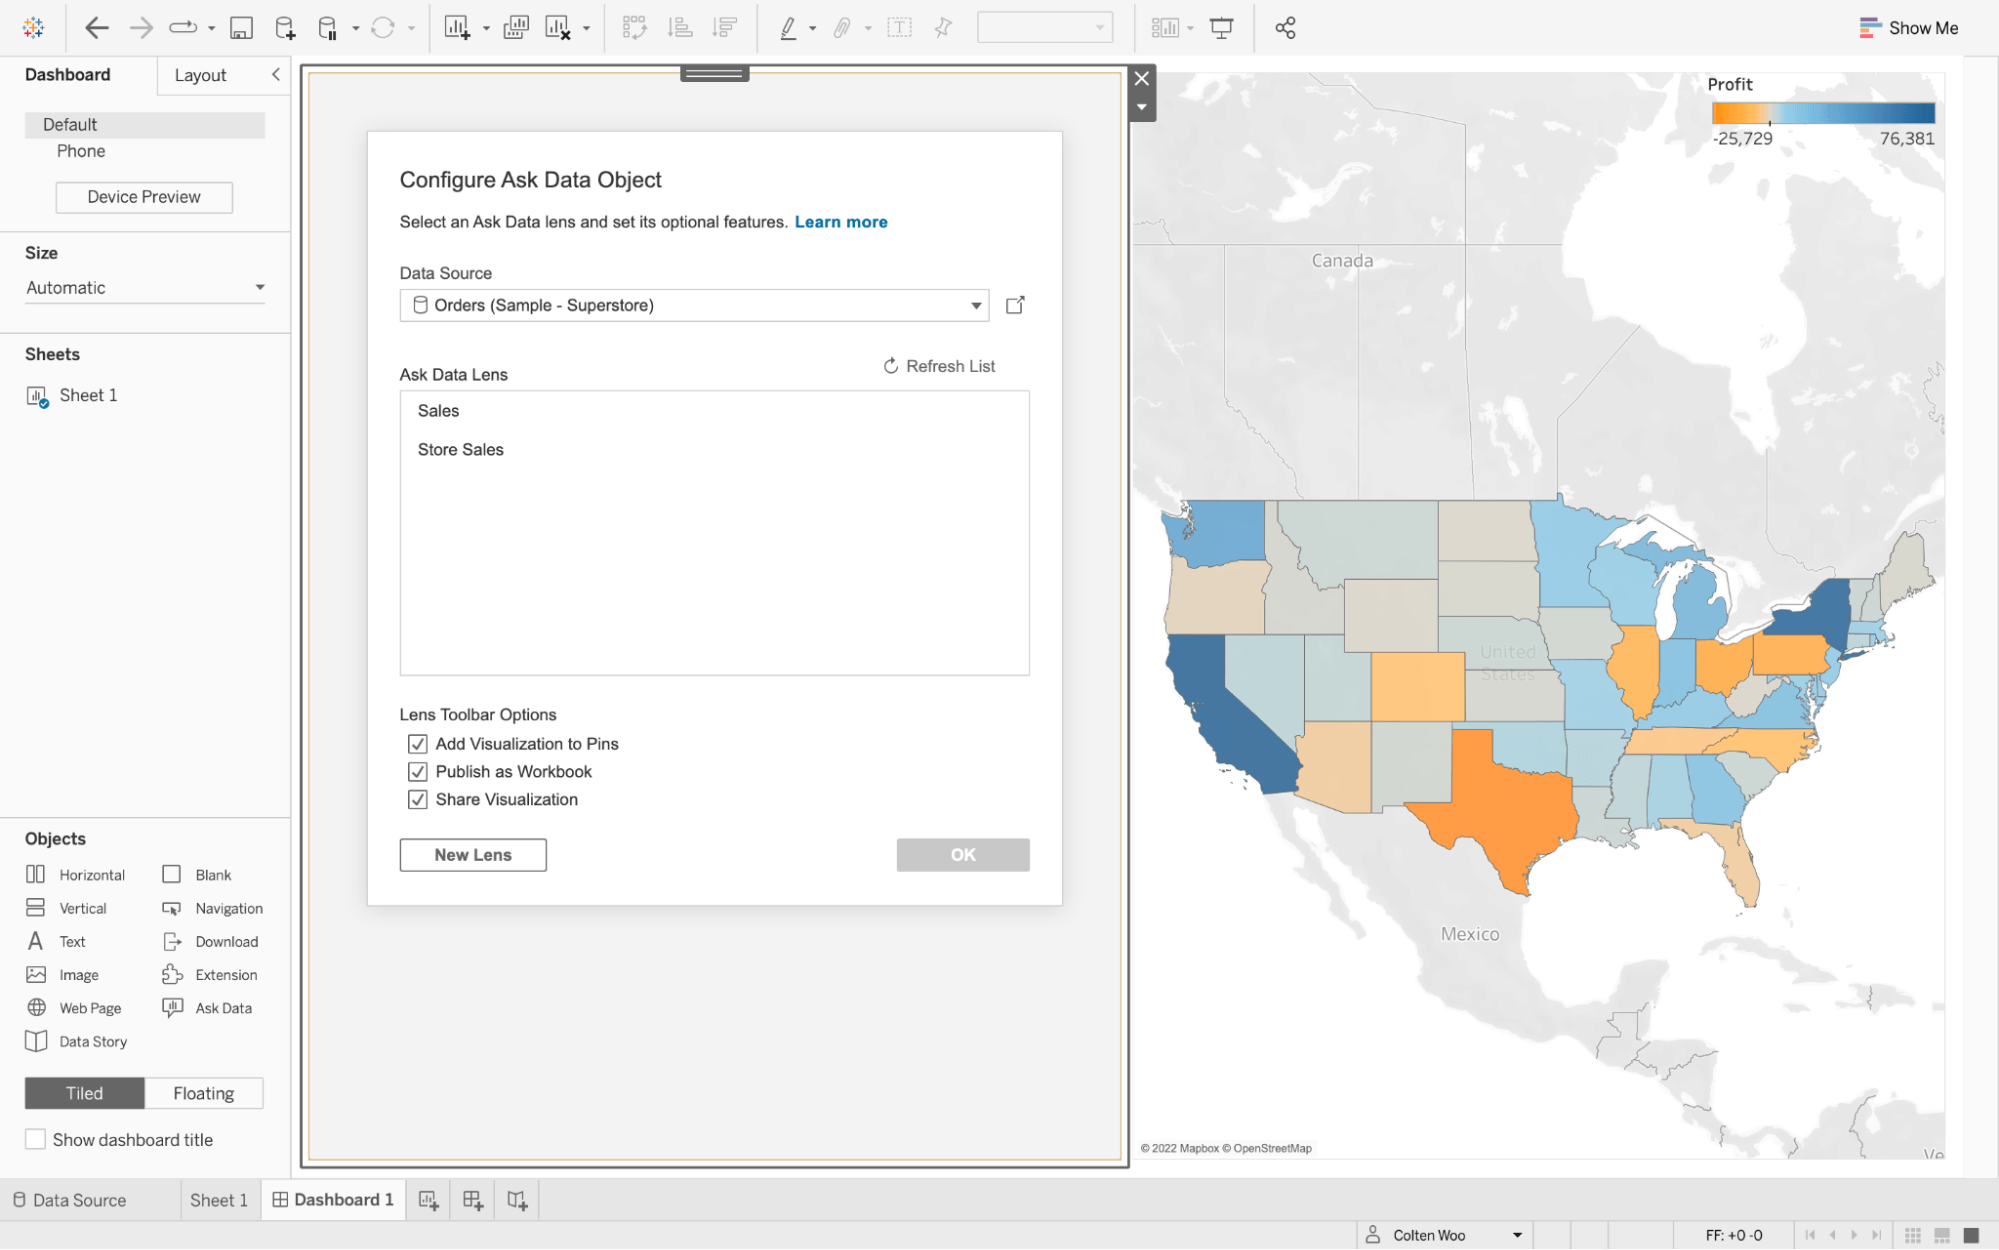
Create your dashboards end-to-end in Tableau Desktop. With Ask Data in your dashboards, people can use natural language to ask questions when and where they arise.
To learn more, read Automatically Build Views with Ask Data in Tableau Help.
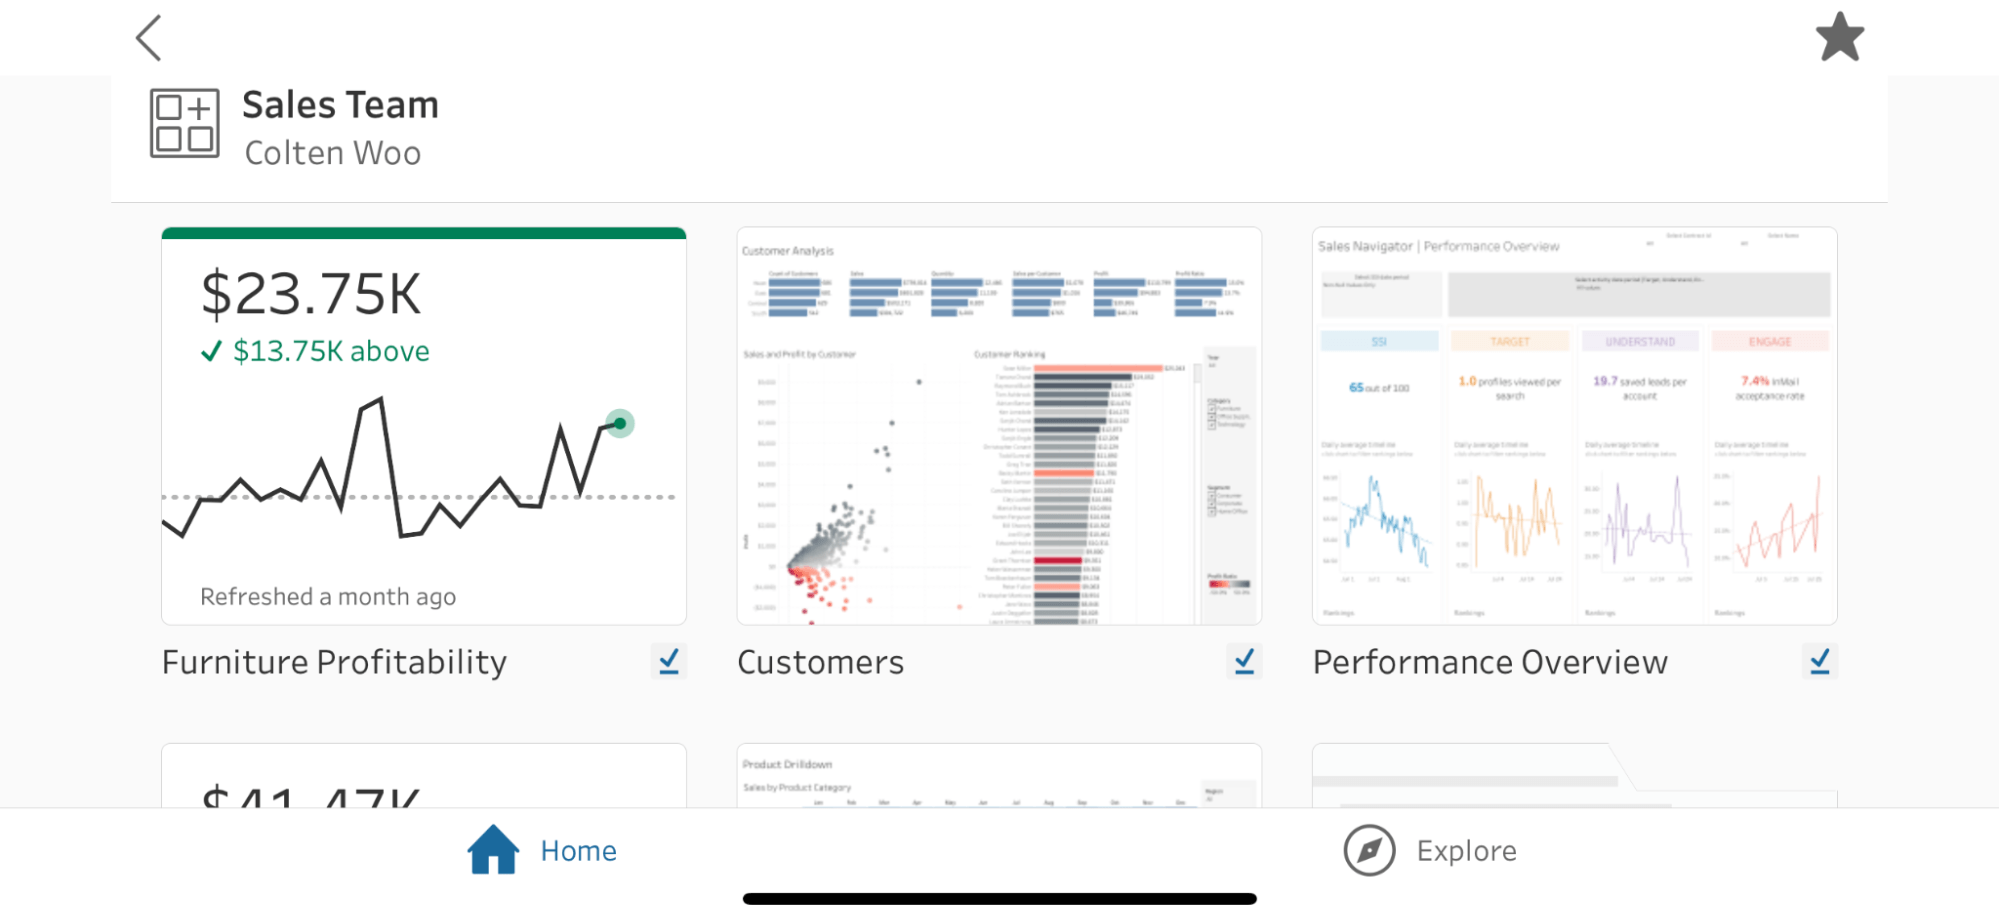
Access insights from anywhere, anytime with Tableau Mobile
To make timely data-driven decisions, you need access to your data wherever and whenever—even when you’re on the go. Tableau Mobile is our enterprise-ready solution that helps you stay in sync with your data from your phone or tablet.
We've redesigned the Tableau Mobile app so you can more readily access content. Also, content within favorited Collections and start pages is locally cached. This provides offline access to your most important data. The experience is optimized for mobile, so you can view and interact with your data on any device, without compromise.
To learn more, read Interact with Data on Tableau Mobile in Tableau Help.
Want more?
- Upgrade Tableau today to take advantage of these capabilities and many more.
- See the full list of new features from our latest releases, or get the highlights from Tableau 2022.2 in our release announcement.
- Watch this recorded webinar for demos of the Tableau 2022.2 features.
- Visit the Ideas forum and let us know what you want to see next in the Tableau platform.
- Explore the Tableau Release Navigator to find out which version of Tableau has the mix of features your organization needs.
相關文章
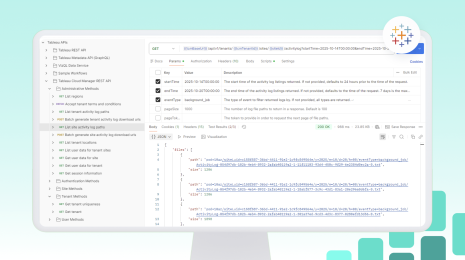
Monitor Tableau Cloud Deployments of Any Size with the Platform Data API
 2026/01/02

Tableau New Features Released in 2025 from Community Ideas
 2025/12/30

Get Interactive with Dynamic Spatial Parameters in Tableau
 2025/07/31