DataFam Roundup: June 19 - 23, 2023


Welcome! Dig into this week's DataFam Roundup—a weekly blog that brings together community content all in one post. As always, we invite you to send us your content—and the DataFam content from your peers that have inspired you! Find the content submission form here.
Data Pride
#DataPride today, and every day. We’re almost halfway through Pride Month, and there are still plenty of ways to celebrate our diverse community. Join us!
Explore the Tableau Public Pride Viz Gallery which highlights visualizations that honor, recognize, and tell the stories and experiences of the LGBTQ+ community through data.
Attend our Data + Diversity event on Thursday, June 29th at 9am PT as we examine the intersection of data and human rights and celebrate our LGBTQ+ community.
Participate in a Tableau Community challenge:
- Back 2 Viz Basics has 2 recent data viz challenges in collaboration with the Data Pride Tableau User Group.
- Analyze the locations of the “YOU ARE LOVED” billboards through a map challenge. These billboards were first created by Rae Senarighi for FairWisconsin and GSafe, two Wisconsin organizations working for LGBTQ+ rights throughout the state. Today, they are spread across 300 locations.
- Build a table using Lambda Literary Awards Finalists & Winners. The Lambda Literary Awards, also known as the “Lammys,” are prestigious literary awards that recognize and celebrate outstanding works of literature that explore LGBTQ+ themes, experiences, and identities across various genres, including fiction, non-fiction, poetry, and more.
- Diversity in Data is visualizing LGBTQ+ representation in film this month using a number of smaller data sets which includes a breakdown of sex and ethnicity.
Add your pronouns to your Tableau Public profile: Make your Tableau Public profile shine by adding your pronouns.
Community Highlight
To recognize new and consistent Tableau contributors—we’re excited to have a section within the weekly DataFam Roundup called the Tableau Community Highlight. Find out how to get involved.

Colleen Hayes, Senior Data Consultant at Continuus Technologies
Milwaukee, Wisconsin
Colleen Hayes is a Senior Data Consultant at Continuus Technologies. She is passionate about sharing her knowledge with others and does so by being an active member and presenter at the Milwaukee and Madison Tableau User Groups.
After being limited in her resources for learning Tableau, Colleen began getting involved in the Tableau Community. She was inspired by the depth and breadth of solutions available. If she ran into a problem she couldn’t solve, she knew someone had already found a solution to it. She has also been guided in her work by Tableau Public, some of her best work has been inspired from vizzes that she has seen published by other authors.
One of Colleen’s personal goals is to publish at least one viz per month on Tableau Public this year. Her goal is inspired by her desire to keep challenging herself to learn new things and she plans to pull from her “viz ideas list” to visualize things that relate to her hobbies and interests like her beer check-ins on Untappd. Follow along with Colleen on Tableau Public.
Connect with Colleen on Linkedin, Twitter, and Tableau Public.
DataFam content
Dive into content created by the Tableau Community:
-
Prasann Prem: What it means to be a Tableau Ambassador?
-
Adam Korengold: Ikigai and the concept of holistic happiness
-
Steve Wexler, Data Revelations: Don't do this on your dashboards
-
Don Wise: Tableau Prep 2023.2 – Leverage the New LOOKUP() Expression
-
The Data Leadership Collaborative: AI + the Data Renaissance
-
Rafael Simancas and Dan Bunker, Playfair Data: Introducing Pilula (aka Dr. Mario) Charts in Tableau
-
Kevin Wee: Dashboard Design Tips: Creative Ways to Use Images | Tableau Conference 2023
Team Tableau
-
2023 Tableau Ambassador nominations and applications are open
-
Celebrate diversity by adding pronouns to your Tableau Public profile
Upcoming events and community participation
-
Michelle Frayman, Zak Geis and Nicole Klassen: Viz Feedback Office Hours
-
Data + Diversity: Using Data for Human Rights Advocacy: Virtual Event - Join us for our Data + Diversity event as we examine the intersection of data and human rights advocacy and celebrate our diverse community.
-
Data Book Club: This spring we'll be reading Avoiding Data Pitfalls: How to Steer Clear of Common Blunders When Working with Data and Presenting Analysis and Visualizations by Ben Jones.
-
TrailblazerDX ’23 Tableau Quest: Leverage the power of data with the world’s leading analytics platform to drive better business decisions.
-
Community Calendar and Upcoming Events: stay up-to-date on the latest Women in Dataviz events and other data visualization-related events. If you'd like to submit an event to the calendar, please fill out this form.
Vizzes
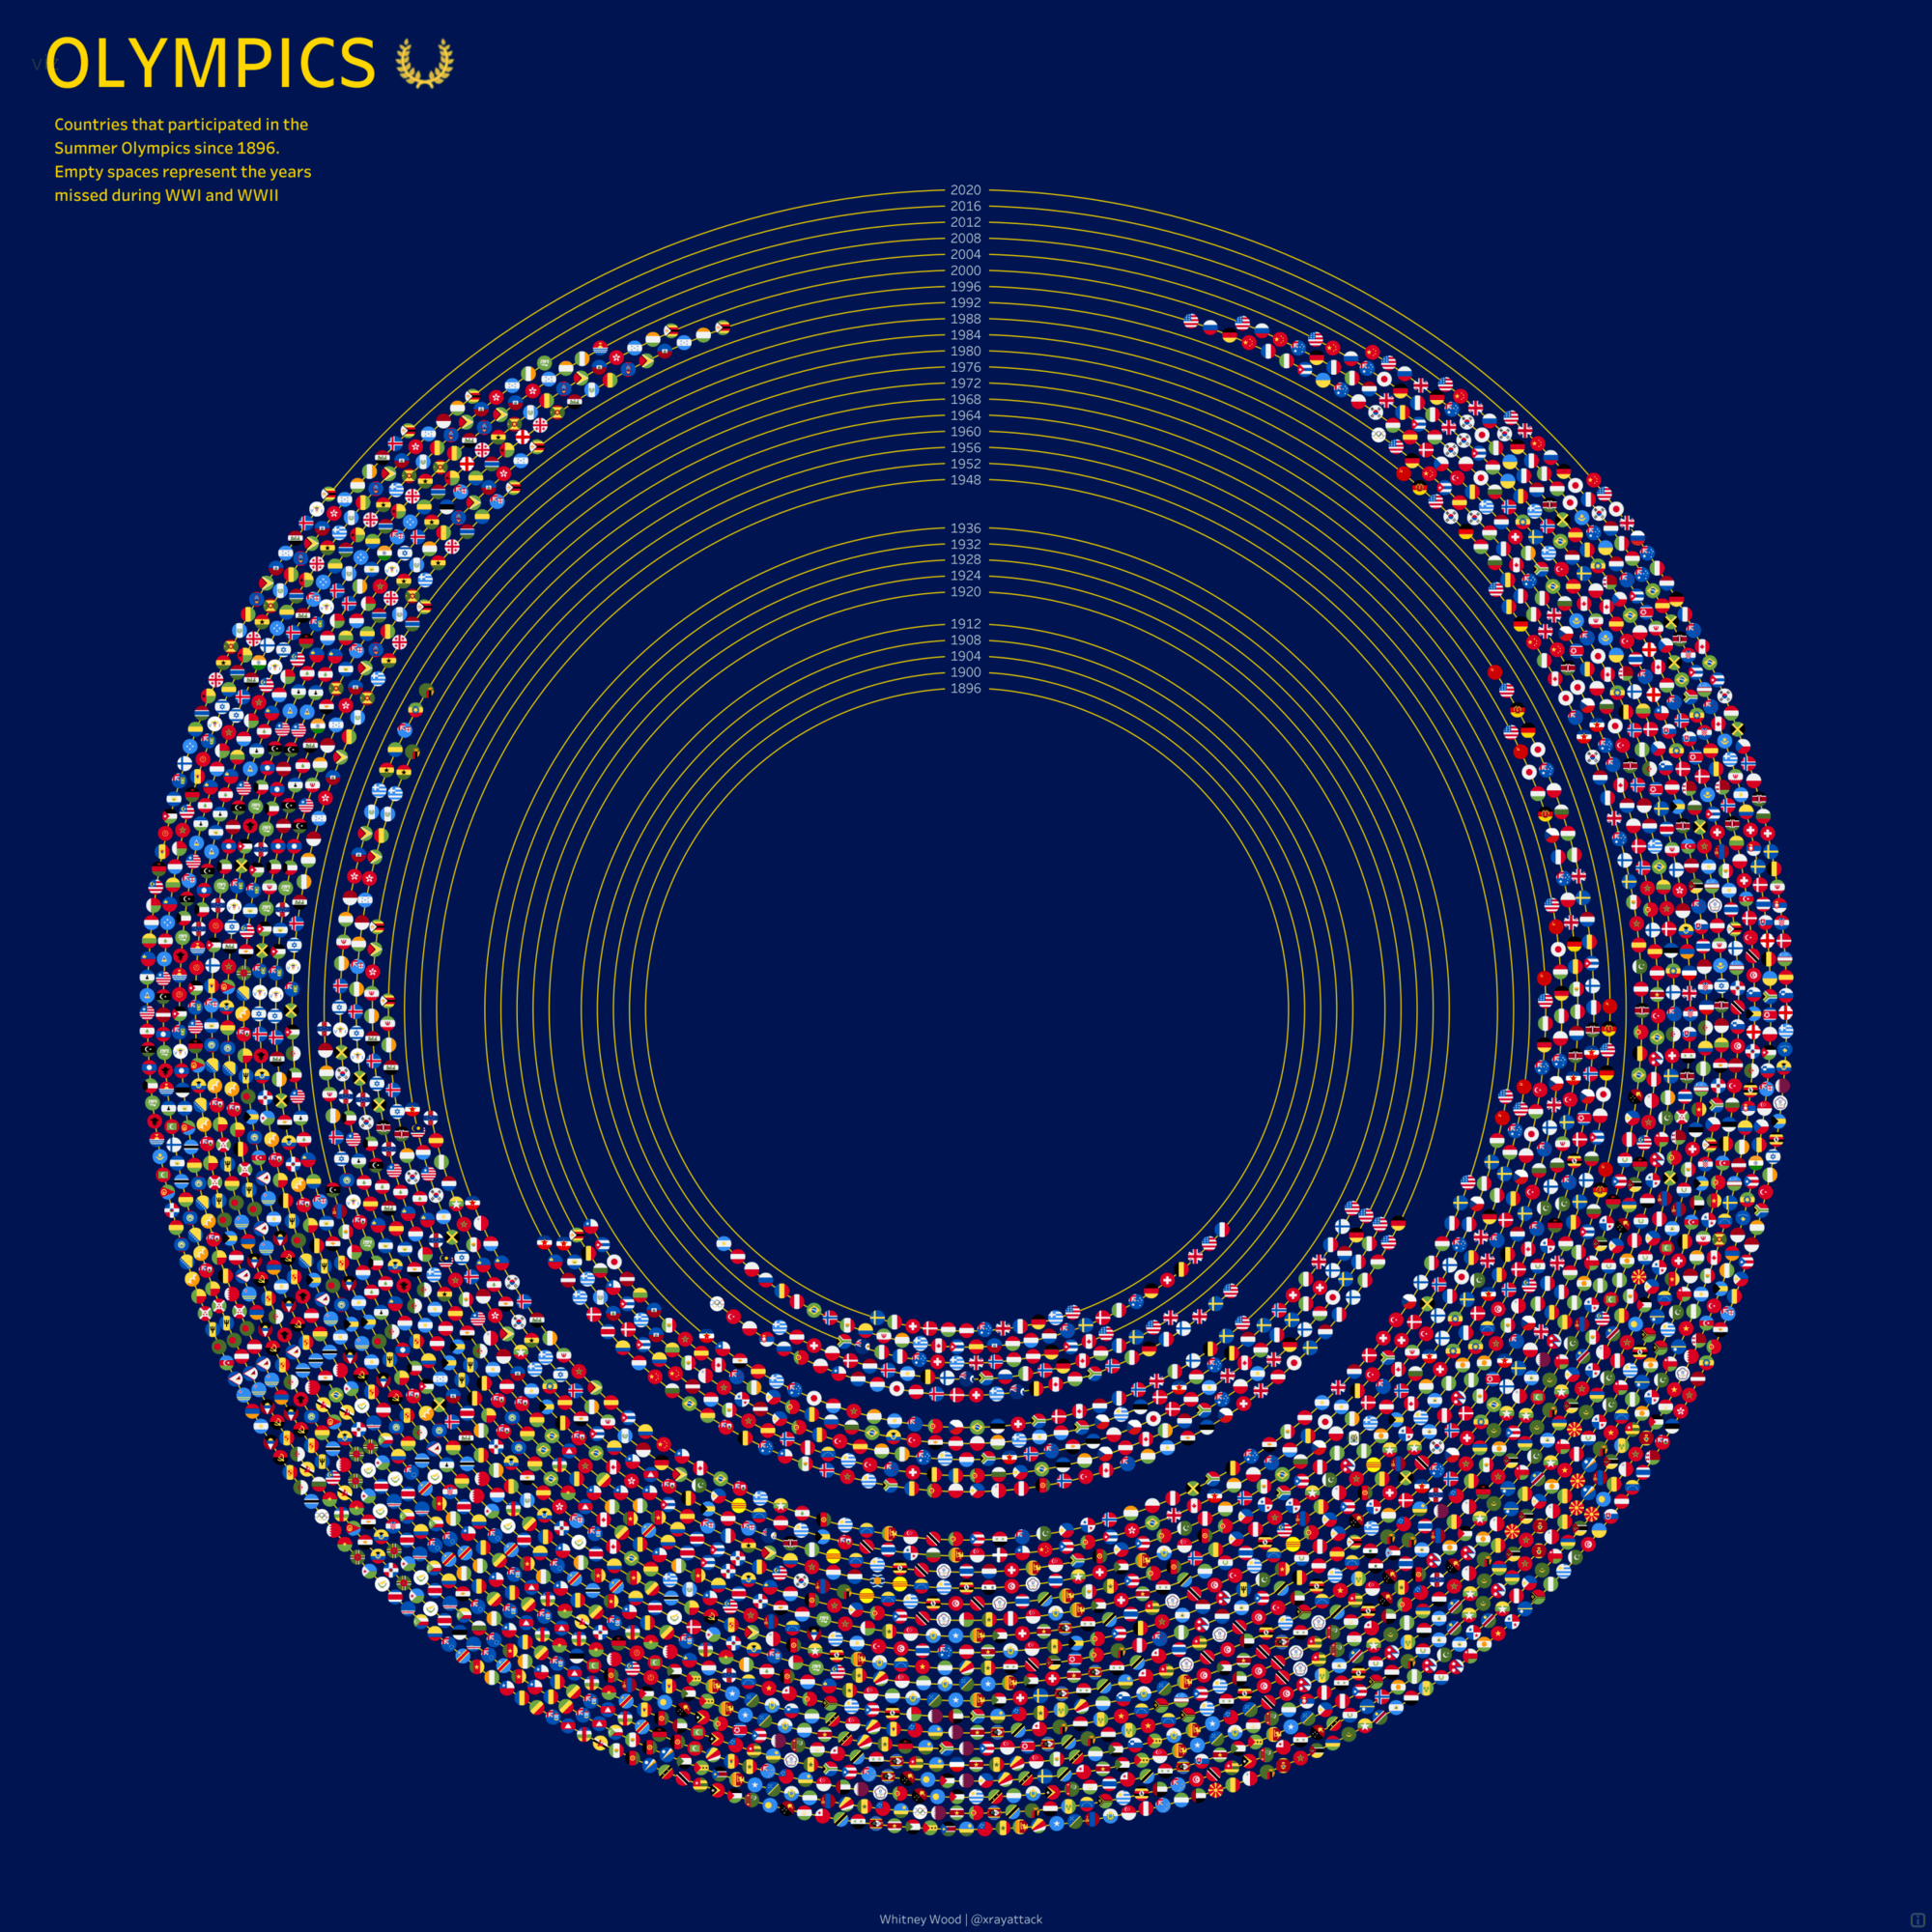
Whitney Wood: Olympics
See the latest Viz of the Day, trending vizzes, featured authors, and more on Tableau Public.
Check out some inspirational vizzes created by the community:
-
Whitney Wood: Olympics
-
Louis Yu: #GamesNightViz Review
-
Sam Epley: #MakeoverMonday 2023 Week 25: Females Initiate the Majority of Divorces in England & Wales
-
Robert Watson: #B2VB - Design KPIs
Community Projects
Back 2 Viz Basics
A bi-weekly project helping those who are newer in the community and just starting out with Tableau. Not limited just to newbies!
Web: Back 2 Viz Basics
Twitter: #B2VB
Week 12: Design KPIs
Workout Wednesday
Build your skills with a weekly challenge to re-create an interactive data visualization.
Web: Workout Wednesday
Twitter: #WOW2022
Week 25: Can you calculate a percent difference between a range of dates?
Makeover Monday
A weekly social data project.
Web: Makeover Monday
Twitter: #MakeoverMonday
Week 25: Divorces in England & Wales
Preppin' Data
A weekly challenge to help you learn to prepare data and use Tableau Prep.
Web: Preppin’ Data
Twitter: #PreppinData
Week 25: Prep School 2023 Admissions - Part 1
DataFam Con
A monthly challenge covering pop culture and fandoms.
Web: DataFam Con
Twitter: #DataFamCon
April 2023: Kids Month!
EduVizzers
A monthly project connecting real education data with real people.
Web: Eduvizzers
June 2023: OECD Programme for International Student Assessment
Games Night Viz
A monthly project focusing on using data from your favorite games.
Web: Games Nights Viz
Twitter: #GamesNightViz
Level 6: The Final Boss
Iron Quest
Practice data sourcing, preparation, and visualization skills in a themed monthly challenge.
Web: Iron Quest
Twitter: #IronQuest
Advanced Chart Types
Storytelling with Data
Practice data visualization and storytelling skills by participating in monthly challenges and exercises.
Web: Storytelling with Data
Twitter: #SWDChallenge
June 2023: fun with fonts
Project Health Viz
Uncover new stories by visualizing healthcare data sets provided each month.
Web: Project Health Viz
Twitter: #ProjectHealthViz
June 2023: Funding for Research for Various Conditions and Diseases
Diversity in Data
An initiative centered around diversity, equity & awareness by visualizing provided datasets each month.
Web: Diversity in Data
Twitter: #DiversityinData
May 2023: Mental Health Awareness Month
Sports Viz Sunday
Create and share data visualizations using rich, sports-themed data sets in a monthly challenge.
Web: Sports Viz Sunday
Twitter: #SportsVizSunday
January 2023: Is it a Sport or a Game?
Viz for Social Good
Volunteer to design data visualizations that help nonprofits harness the power of data for social change.
Web: Viz for Social Good
Twitter: #VizforSocialGood
June 9 - July 18, 2023: Gord Downie & Chanie Wenjack Fund
Real World Fake Data
Create business dashboards using provided data sets for various industries and departments.
Web: Real World Fake Data
Twitter: #RWFD
Session 5: Diversity Score Card
Data Plus Music
A monthly project visualizing the data behind the music we love!
Web: Data Plus Music
Twitter: #DataPlusMusic
相關文章

DataFam Roundup June 2026

DataFam Roundup May 2026

Iron Viz 2026: Read Between the Data
 2026/05/28