And the winner of the student viz contest is...


We received over 100 submissions from 14 countries for our Student Viz Assignment Contest — wow! This week we chose the top three winning vizzes based on creativity, analytical depth, beauty and design, and overall score. Winners will receive a Tableau swag package for their amazing work in Tableau.
Congratulations to our top three vizzes and honorable mentions! Here they are:
First place
Perusing the New York Times #1 Best Seller List
Katie Smith, University of Washington, Data Visualization Major
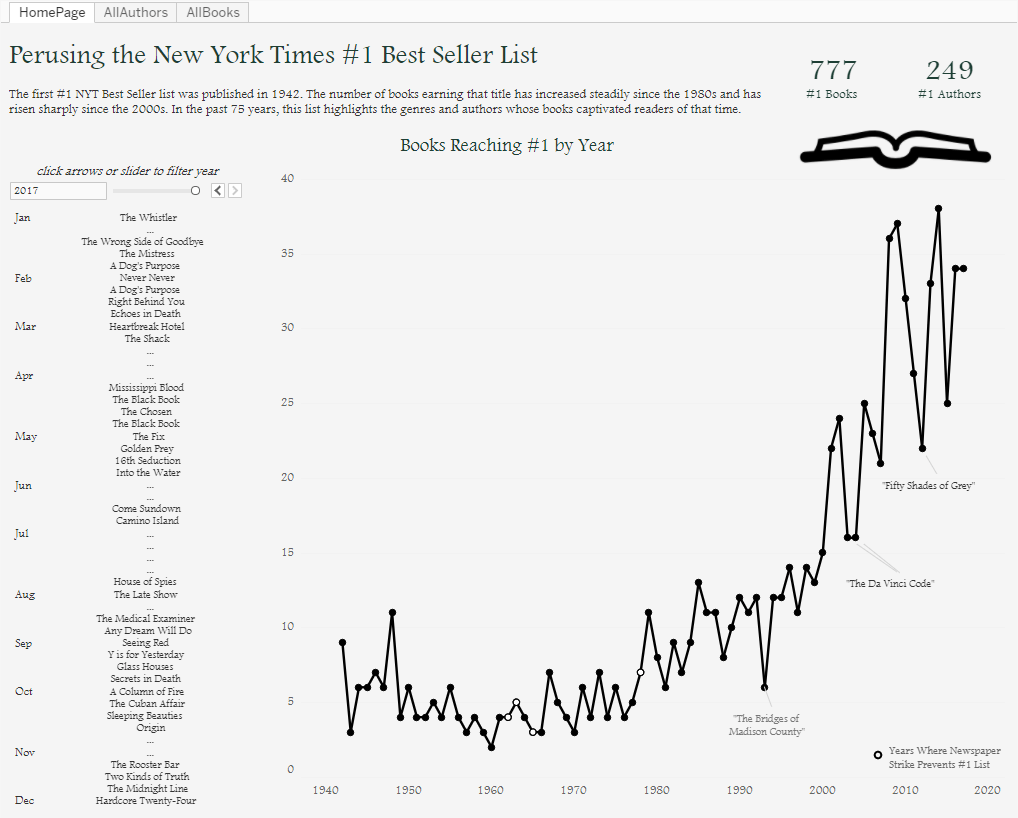
Katie Smith from the University of Washington takes first place with her viz exploring the past 75 years of New York Times Best Seller Lists. The judges loved the choice of colors, variety of charts, and attention to detail. Users can get a holistic view of the number of books reaching #1 by year or even look at each of the books on the Best Seller list by year.
Second place
The Curse of the Capitol
Harpreet Ghuman, University of Maryland, MBA and MS in Marketing Analytics
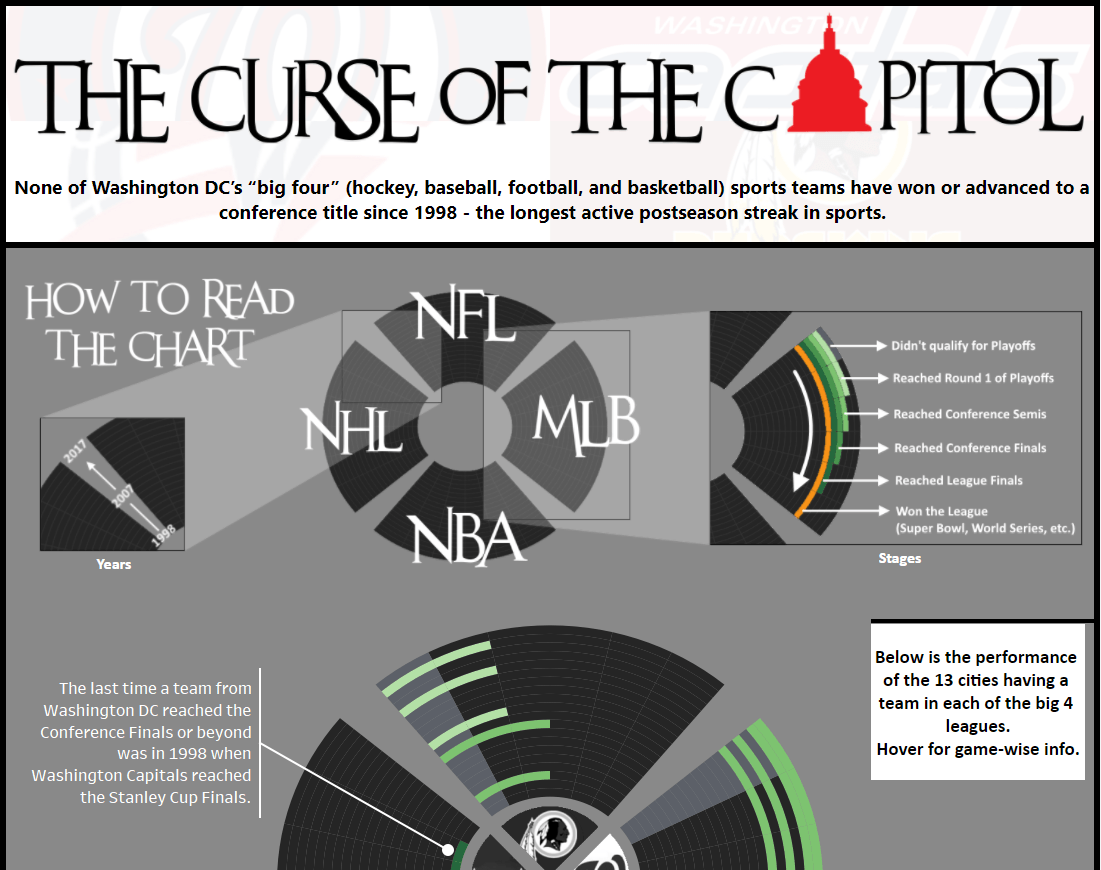
Harpreet’s viz dives deeper into Washington DC’s “big four” sports team and (lack of) advancement to a conference title since 1998. Judges applauded Harpreet for his creativity and clever dashboard design. Check out Harpreet’s Tableau Public profile for some other amazing vizzes!
Third place
Traffic Violations in Montgomery County of Maryland
Ankit Borkhataria, University of Connecticut, MS in Business Analytics and Project Management

Ankit took a creative approach in wrangling a large data set with over one million rows of Montgomery County traffic violation data. Judges loved his choice of using a bold color palette and embedding Twitter feeds from @mcpnews and #mdtraffic.
Honorable mentions
Since we could only pick three winners and there were so many awesome vizzes, we wanted to share a few more:
UN SDGs: How Are We Doing?
Allison Montgomery, Saint Joseph’s University, BS in Business Intelligence and Analytics
NYC Property Market
Matej Puchovsky, University College London, MS in Business Analytics
Wellness Effects on Production
Yoni Schwartz, Yeshiva University, Business Intelligence and Marketing Analytics Major
Singapore University IGP and Employment 2016 - 2017
Chanel Ng, Nanyang Technical University, Accounting Major
If you’re a student, you can enter in our next viz assignment contest for your chance to win Tableau swag bags! And don’t forget - you get Tableau for free through our Tableau for Students program.
Are you an instructor? Request new licenses for the upcoming term.
相關文章
Learn the Basics of Well-Structured Data
 2024/12/06
How To Spot Misleading Charts: Review the Message
 2024/10/24
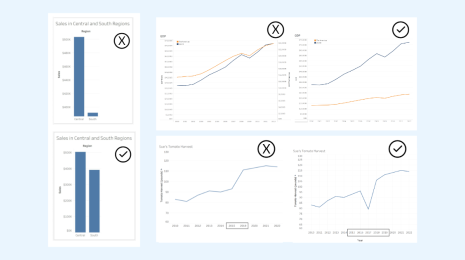
How To Spot Misleading Charts: Check the Axes
2024/10/17