Business Statistics Course uses Tableau and Statistical Methods to Gain Insight from Data
While many students admit that their statistics class was useful, rarely does anyone ever say that they enjoyed the class – I wanted my statistics class to be useful and enjoyable ... The response was overwhelming – students did enjoy using the program and many continue to use it beyond the group project. I couldn't be happier with that outcome.
Dr. Deanna M. Kennedy has been teaching with Tableau since 2011. She teaches in the areas of operations and project management as well as quantitative methods and business statistics at the University of Washington. She first learned about Tableau through her Program Chair, when researching how to incorporate Business Analytics into her teaching curriculum. Using Tableau for Teaching, Dr. Kennedy tasked her students with researching a business-related topic and exploring data through a Tableau dashboard. Below is an interview with the professor, highlighting what it was like teaching with Tableau.
Main learning objectives:
- To become familiar with a visualization tool for data analytics
- To learn multiple ways of representing data and the pros/cons of all
- To learn to draw inferences, hypotheses, and form questions based on visualizations
- To become familiar and proficient at using the computer for data analyses
Q&A
Can you tell us how you used Tableau in your course?
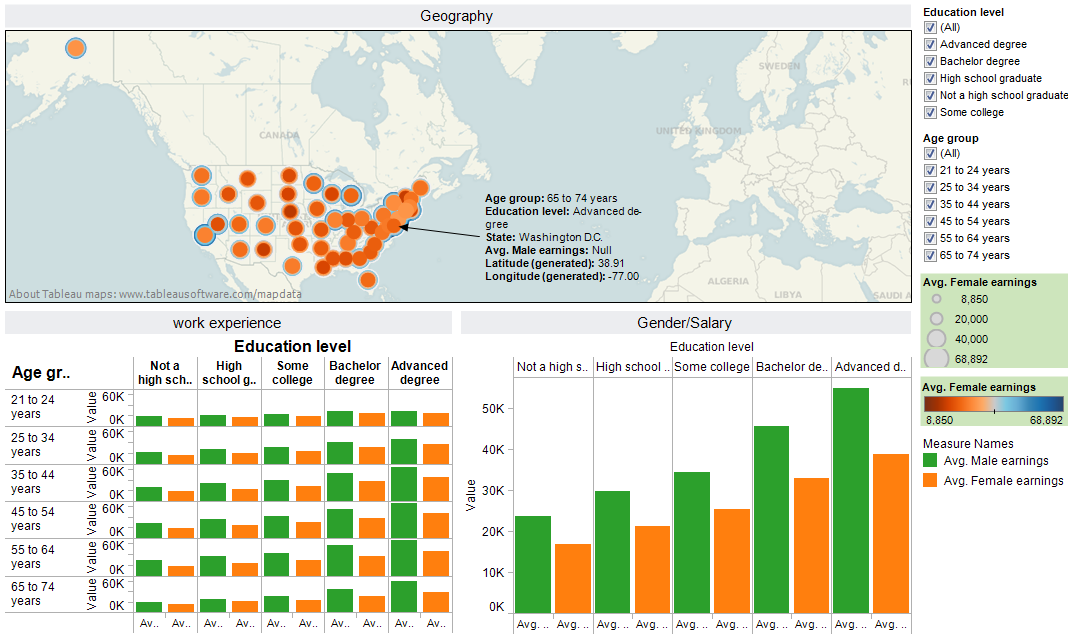
In the Quantitative Methods and Business Statistics course, Tableau was introduced as a data analysis tool. Student formed groups of 3 to 5 members to analyze data on a business-related topic. Topics varied from the mobile telephone market, to the electric car industry, e-book sales, national salaries and unemployment, and the business of online dating services. Using Tableau, students assessed visualization results to find new insights, hypotheses, and future research questions.
The goal of this group project was to apply statistical methods to create new knowledge about a business, technology, or industry. The final task was to build a dashboard and walk an audience through the various pieces of the dashboard and explain how a manager might use the information to make a decision.
Why did you choose to use Tableau?
While many students admit that their statistics class was useful, rarely does anyone ever say that they enjoyed the class – I wanted my statistics class to be useful and enjoyable. I also had an interest in expanding the coverage of data analytics. Bringing in a data analytics program for students was a great way of making the class enjoyable and not just about crunching numbers in a spreadsheet. But, since the class covers many topics in a short, 10-week, time frame, I knew that introducing a new program would have to be easy to learn in order to have time to use it. When I tried Tableau I thought it was easy to pick up. So I introduced it to the class and had students use it during group projects. The response was overwhelming – students did enjoy using the program and many continue to use it beyond the group project. I couldn’t be happier with that outcome.
How did you learn Tableau?
I learned to use Tableau by interacting with it over and over. I used the sample data provided upon first downloading the program to create different sheets and a final dashboard. Then, I imported other datasets and created multiple sheets and dashboards. When I had questions and wanted to expand my understanding of Tableau options (and learn particulars so I could teach it in class) I met with Tableau’s Academic Program team. They ran through multiple demonstrations so that I understood the program and could teach it to students.
How did you teach Tableau to your students?
A structured workshop was held during a 4-hour class period. Using the computer and projector in class, I walked the students through creating a dashboard using sample data (Superstore data) provided by Tableau. While I showed actions on the screen, students replicated the actions on their own computers. Because the entire class reproduced the same dashboard, students could help each other as we completed the training. At the end of training, students were given time to import data from their group project and visualize it using Tableau. Students quickly moved beyond the simple techniques I showed in the training and were creating sophisticated interactive graphics.
What were the biggest challenges in teaching Tableau?
The biggest challenge in teaching Tableau was with students using Apple computers. Another challenge was teaching students how to organize data into the right format for Tableau. Organizing data was the most common problem brought to me. In the future I might spend another class period instructing and helping students with data organization.
What type of feedback did you receive from your students?
Many of the students expressed the sentiment that Tableau was a valuable part of the class and a tool they will likely use it for other classes. Also, many students asked about bringing Tableau into their businesses because of its ease of use and interactive qualities.
Example of student project:
Click here to see the project report.