Why “changing the world” goes beyond any one project


Tableau is laser focused on helping everyone - from rural community health workers to Fortune 500 companies - see and understand their data.
That’s why we are thrilled to be named as one of six Rising Stars on Fortune magazine’s 2017 Change the World list. We’re excited to be recognized for something we’ve long believed: data is a powerful resource that can be used to solve the world’s most challenging, complex, and misunderstood problems.
There are people and organizations around the world with big ideas about how to solve problems and change their communities for the better. By pairing those changemakers with world class technology, those men and women are setting new standards to solve some of the world’s oldest challenges.
Our flagship partnership with the global health non-profit PATH on the Visualize No Malaria campaign has shown us how the mix of smart technology, thoughtful partnerships, and a company built around helping people solve even the hardest problems can change our understanding of what is possible in the world.
Along the way we’ve learned a few lessons that have shaped our work with World Food Program, NetHope, Feeding America, and others, and inspired others to go beyond what might be done with traditional corporate philanthropy.
Lesson 1: Everyone can be a data person
The same principles and processes that help Barclays get better insights into its customers’ needs or Netflix explore how millions are watching movies and TV are giving Zambia’s Ministry of Health the opportunity to make malaria elimination a reality and save thousands of lives each year.
At the beginning of the Visualize No Malaria partnership, the task seemed impossible. Malaria had haunted much of the tropical world for millennia and in 2014 still claimed nearly 600,000 lives a year. At the same time, there were powerful possibilities. Zambia’s Ministry of Health and PATH believed that if they could combine data about reported cases with information about available health services, they could move faster to drive the malaria parasite out of impacted communities.
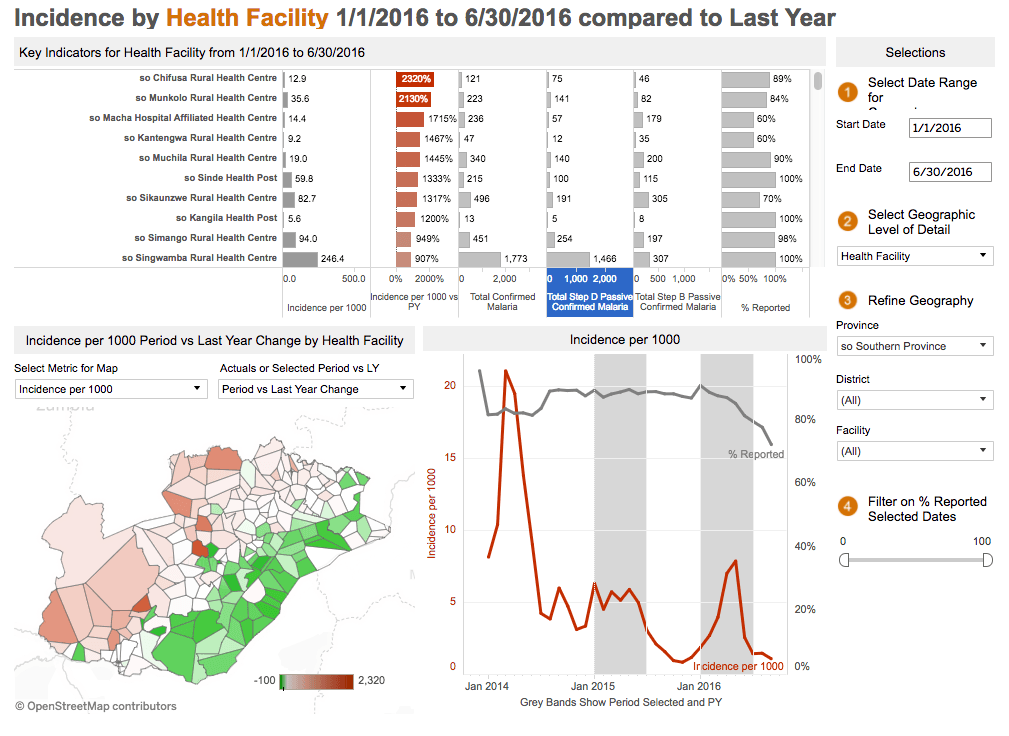
Officials from Zambia's Ministry of Health explore up-to-date data on reported infections across the country's Southern Province.
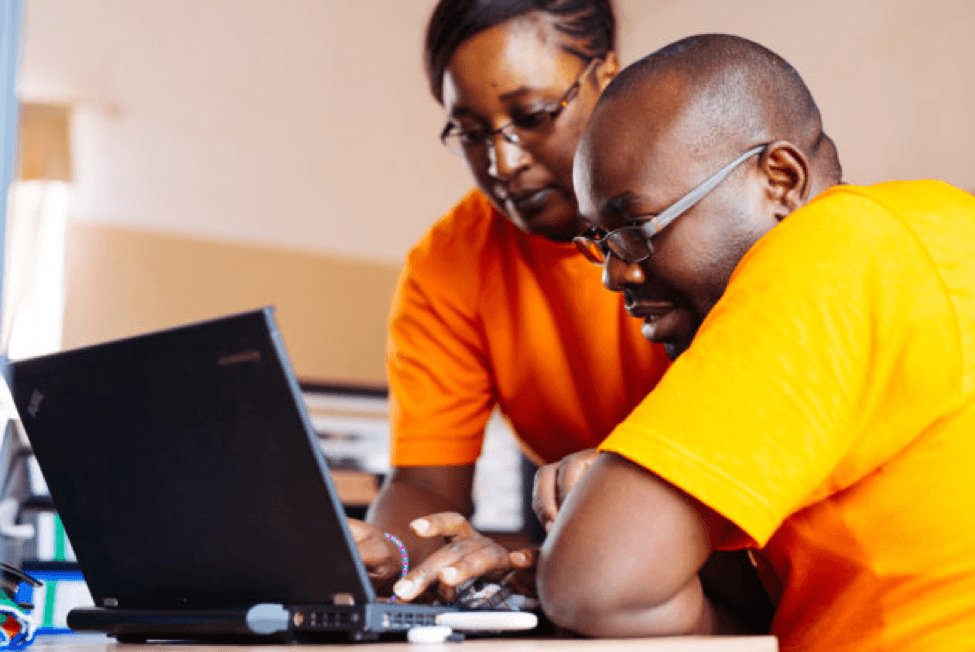
To tackle this challenge, PATH and the Ministry created a series of dashboards to track, treat, and monitor malaria incidences. They went through several rounds of prototyping and testing with staff in the district health centers to meet the needs of every potential consumer of the data--from the Ministry of Health workers down to the 1,200 community health workers fanned out across Southern Province.
See Tableau in action in the fight against malaria.
Combining technology with a local understanding of both the challenges and the goals, the partnership prioritized improving data accuracy, monitoring case reports in high and low incidence areas, and making critical decisions about how and where to tackle outbreaks.
In that process, the group built a world class population health management system. The Zambian government has already started scaling the effort to the neighboring Western Province, and PATH sees this type of informatics as a model that could be scaled globally to end malaria for good.
Explore the dashboards.
It is more than malaria, too. Last year, Tableau and PATH helped the CDC build an Emergency Operations Center in Vietnam that uses the same methodology to monitor the potential outbreak of a variety of communicable diseases across the country.
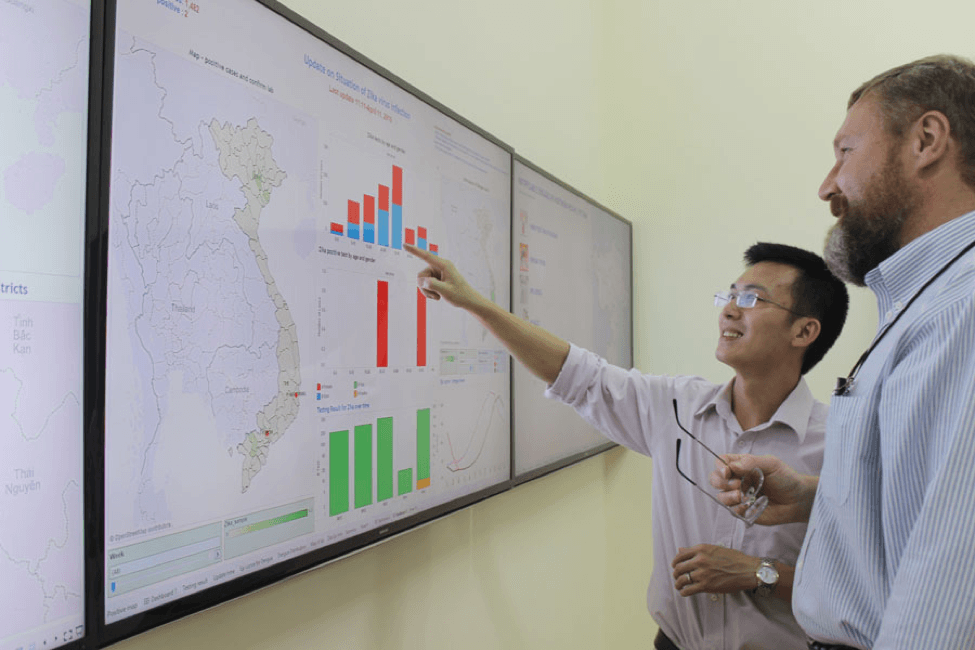
Health officials in Vietnam share situational awareness dashboards with CDC specialists in 2016.
Furthermore, similar disease surveillance and management are being deployed against a variety of diseases in Liberia, Kenya, and Guinea. Tableau Foundation has even started looking into ways to bring this same capability of mapping and managing disease vectors back to the U.S. to take on crises like chronic homelessness and the opioid epidemic.
Lesson 2: Build ‘big tent’ partnerships
We are focused on finding good partners and help them put good information in the hands of decision-makers. And when it would be helpful, we’re quick to pull in additional resources -- technology and consulting partners, our global community of users, other grantmakers, even customers.
A decade’s worth of collaboration between Zambia’s Ministry of Health and PATH developed advanced technologies that made the partnership a vanguard in the fight against malaria. When Tableau joined the mix in 2014, we asked some our community’s best and brightest to help us build on that success.
Several current and former Tableau Zen Masters contributed hundreds of hours of volunteer time, making several trips to Zambia to build, test, and train alongside Ministry officials. And their work led to other tech partners joining the campaign, donating their software and expertise to the collaborative effort.
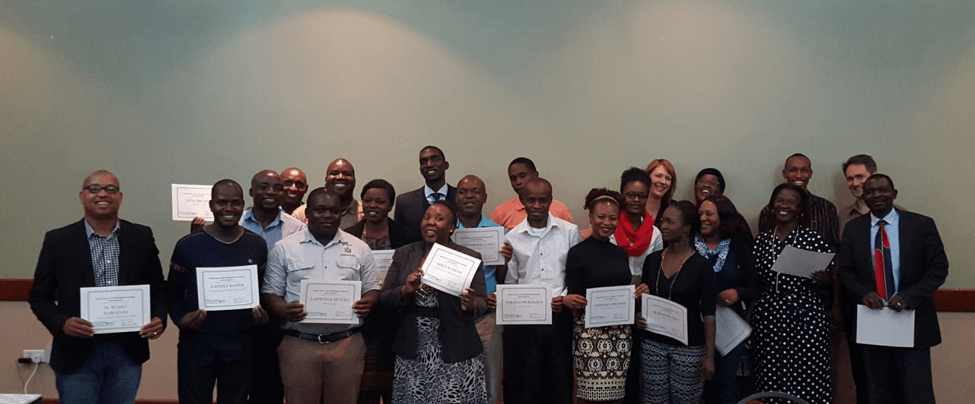
Zambian health officials and Zen Masters Anya A'Hearn and Jonathan Drummey pose at the conclusion of a recent training.
With every advancement in operational capability or technical interoperability came another opportunity to ask “what if we could just do…?”
One of those “ifs” even turned into a concept for a predictive model that could help Ministry officials plan for where malaria might be in the future, not just where it has been in the past.
Developed by PATH and Allan Walker, the model takes geographic and topographic data to analyze the flow and pooling of predicted rains and combines it with health data on the current prevalence of the disease. The model will start testing the concept at the end of this year, and could give Ministry officials a whole new view into the spread of malaria across the country.
Neither this model nor any of the other breakthroughs would have been possible if we tried to go it alone. We don’t just give to these organizations, we invest ourselves in them and do everything we can to build a coalition and help set them up for success.
Lesson 3: Live your mission
We think that anyone and everyone can be a “data person,” and that sense of equity inevitably leads us to think about grand possibilities.
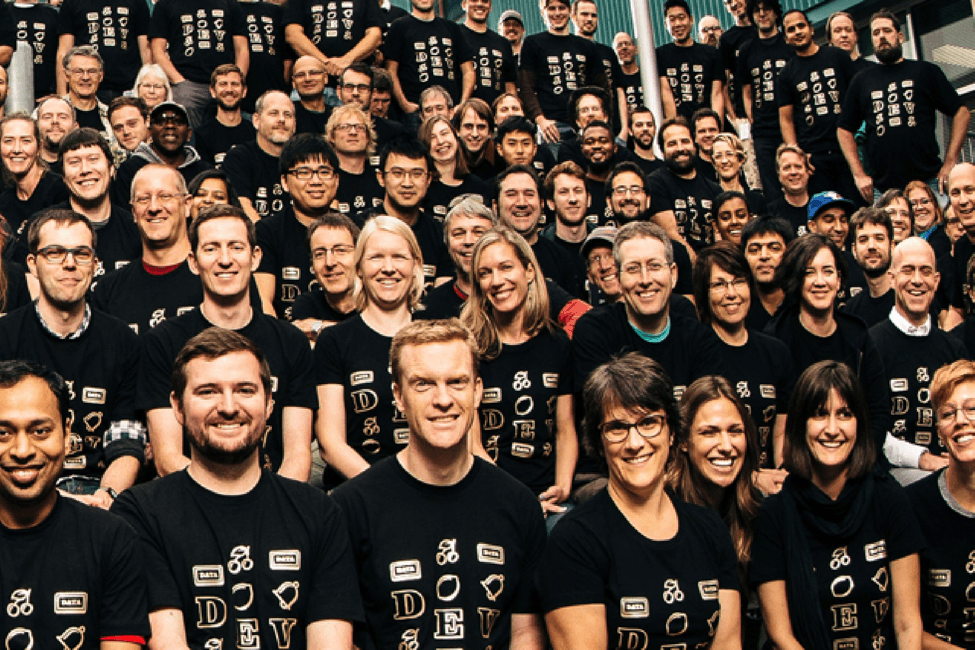
Tableau developers gathered near the company's Fremont headquarters.
For us, impact is measured in outcomes and helping our customers reach their goals. Helping innovators use data effectively to fulfill their missions is woven into Tableau’s DNA. So when partners share big, world-changing ideas, the response is not “how could we?” but “we know we can and how could we not?”
Having impact is an extension of our core business. This is one of the reasons the Tableau Service Corps volunteers has thrived in helping hundreds of organizations with their data challenges. Skills honed in setting customers up for success are seamlessly transitioned too quickly helping non-profits all over the world with Tableau projects large and small.
Meet some of the volunteers of the Tableau Service Corps.
At their core, visual analytics can bring new models and methodologies to life. They make it possible to understand challenges, make adjustments, and collaborate. And in the face of complex problems, working and evolving together is critical to the success of any project. The combination of the two may challenge norms, and maybe even change the world.
相关故事
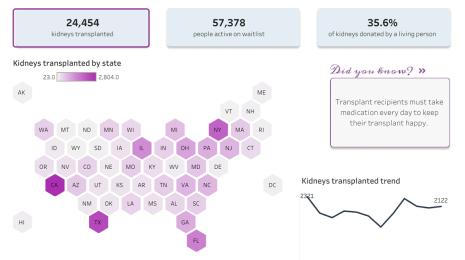
From Kidney Donation to Tableau Dashboard
 2022/10/25

Using data to drive conversations about climate change
 2022/04/28