Healthcare Analytics Hub Starter Kit: Get the data you need faster
The purpose of the Healthcare Analytics Hub Starter Kit is to provide a sample of what your healthcare app could look like. It’s not a complete solution; instead, it’s focused on what’s possible. Please contact your Tableau Account Manager to get started today!


Over the past few months, I’ve met with a growing number of customers who are trying to develop a data access or analytics hub within their organization. The goal is pretty universal with these customers—it’s to provide a one-stop shop for data analytics. This includes content built in Tableau and other BI/reporting tools within the organization. Most of these customers are starting with a content management system like SharePoint, Joomla, or Drupal just to get started, and then they try and embed their dashboards and reports into them. While pre-packaged solutions like this are easy to get up and running, the drawback is that they have limitations on how they can be customized. Sure, it’s possible to drop in a few links in your dashboards and reports but then you have to replicate your security to ensure people only see content appropriate for them.
After seeing people going down this path, I thought it shouldn’t be that hard to build a sample web application leveraging the built-in framework of Tableau. Tableau includes a robust REST API that provides read/write access to the feature set of Tableau Server, so why recreate the wheel just for an analytics hub? It was my hunch that more customers would be interested in building custom healthcare analytics on their own if they just had more examples of what’s possible and how to easily get started.
To create this example, I needed a starting point. Luckily, Sandeep Raveesh had already come up with a boilerplate for building a full stack web app using React, Node.js, Express, and Webpack. Using this as my starting point, I added a few more packages and put together a sample implementation of what a Tableau Healthcare Analytics app could look like. This web app communicates with Tableau using just our REST API and allows you to view embedded dashboards (along with single sign on) right in the analytics hub.
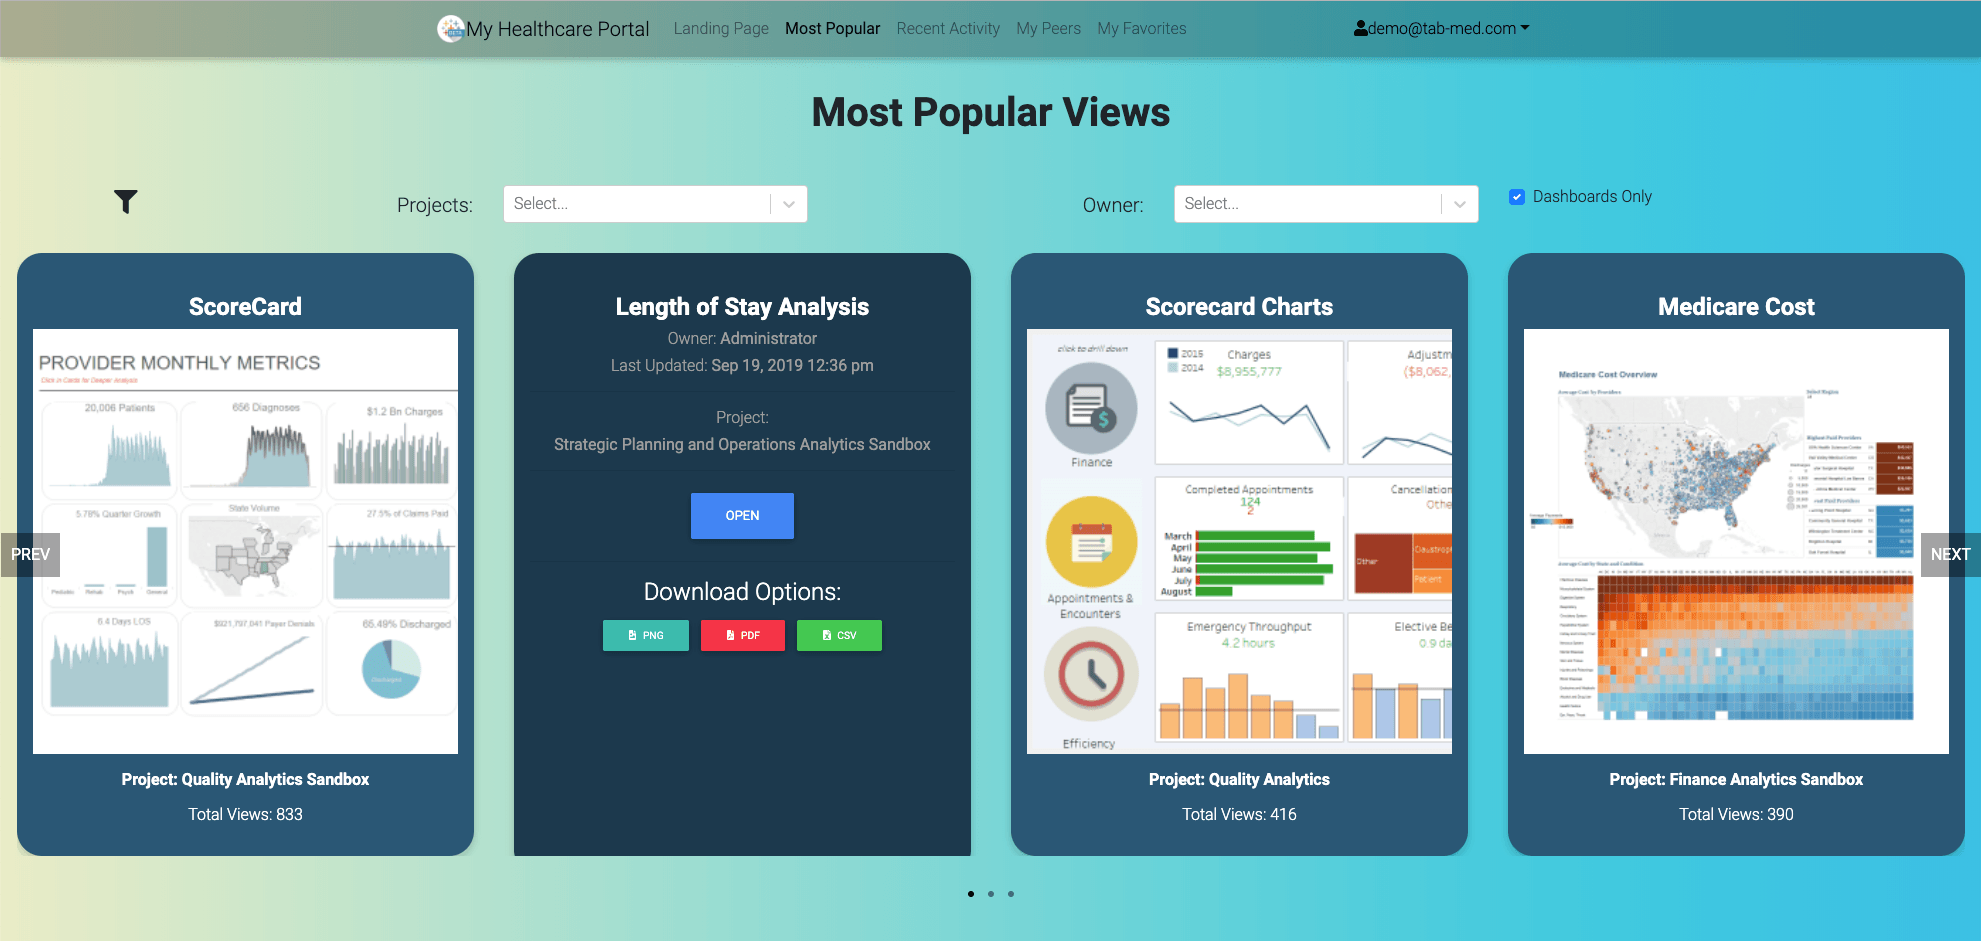
There are a few pre-built pages showing different ways end user can access content, but here are two that might be of interest. One of the pages, Most Popular Views, gets a list of all the dashboards your user has access to and displays the top X (based on # views) as a series of cards. You’ll see these cards displayed in a carousel, which will scroll through automatically and allow you to filter based on the project and/or workbook owner. Hovering over a card will let you open up the dashboard and give you options to export as PDF, PNG, or CSV.
Another view, My Peers, displays a Sankey diagram linking you (the logged in user) to 10 other people within the same user group (your peers), as well as the most popular dashboards used by those people. This helps the end user see what other content is popular among people like themselves. Of course, you can click on the name of a dashboard to view it directly.

There are a few more pre-built pages in the downloadable Healthcare Analytics Hub Starter Kit, below is everything included:
- Source code to build the web app
- Tableau Server setup instructions
- Tableau Workbook to pull usage data
- Web app setup/configuration instructions
The purpose of the Healthcare Analytics Hub Starter Kit is to provide a sample of what your healthcare app could look like. It’s not a complete solution; instead, it’s focused on what’s possible. Please contact your Tableau Account Manager to get started today!
Interested in learning about additional starter kits? Check out our Healthcare Executive KPI Dashboard Starter Kit and Healthcare Revenue Cycle Management Starter Kit.
相关故事

VizQL Data Service from Tableau: Use Your Data, Your Way
 2024/08/08

When and How to Use Multi-fact Relationships in Tableau
 2024/08/01

Top data books of 2021
 2021/12/12