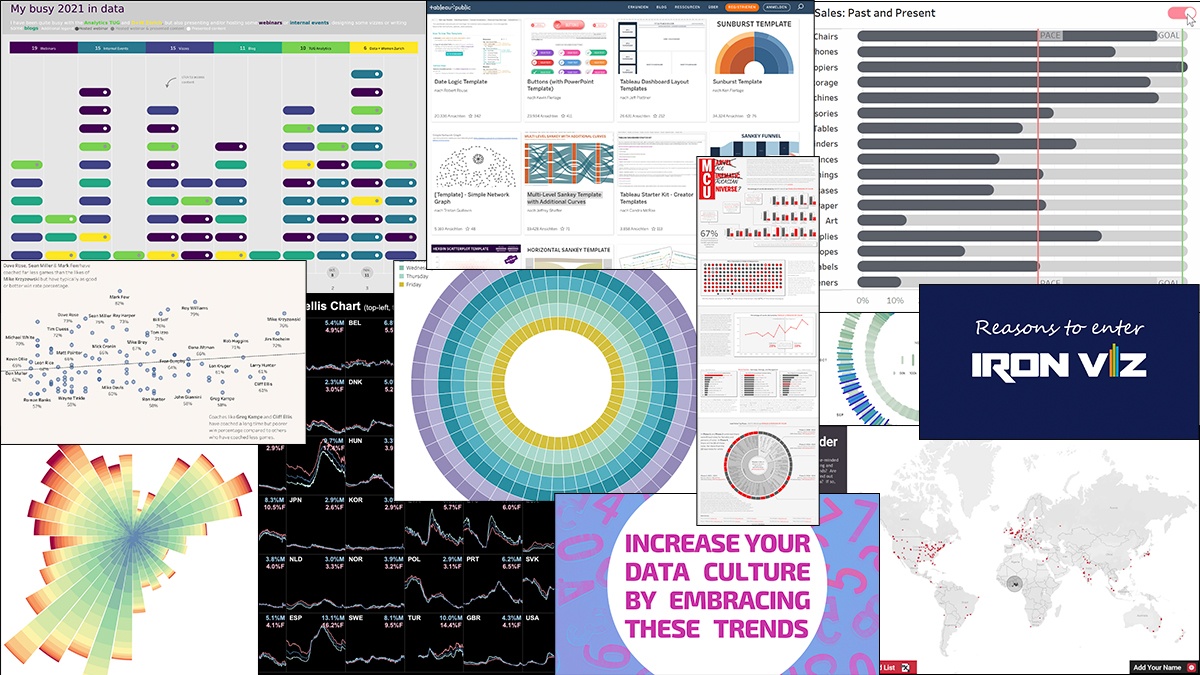
Best of Tableau Web: January 2022


Last month, Andy was discussing the value and the breadth of all the Tableau Community projects, and one of those is a new kid on the block called Back to Viz Basics (B2VB). From this project, I saw a really great post from Darragh Murray about the importance of exploratory data analysis. Over the years I’ve been asked many times about how one becomes a better data analyst. In the post, Darragh talks about his process on the approach to answering an analytical question. For someone new to the field, this lays it out better than I could have ever dreamt, as my general answer to the question was “foster your curiosity and continue to ask questions of the data.”
While my suggested approach works in a sense, Darragh’s is a bit more prescriptive and it’s definitely worth a read. Many times when people are new to the field, veterans will often forget to share the small steps because we take them as subconscious muscle memory and we just do them instinctually. Simple things like taking the time to profile the data rather than just diving in and dragging random fields to rows and columns can save you hours in some cases, depending on the data set of course.
If you are new to the field of analytics, I highly recommend you bookmark Darragh’s post, and at the same time, don’t be afraid to add your own steps to the framework. Your curiosity and unique approach could be the difference between insights and missed opportunities… and if you are mentoring new people in data and analytics, be sure and share with them the “little” secrets we sometimes forget to share.
With that, let’s dive into this month’s Best of the Tableau Web for January! For updates throughout the month, follow me on Twitter and LinkedIn, and check out the list of blogs that Andy Cotgreave and I follow for Best of the Tableau Web. If you don’t see yours on the list, we invite you to add it here.
Inspiration
- How do we visualise text?
Neil Richards, The Flerlage Twins
- The importance of exploratory data analysis: Exploring the first B2VB challenge
Darragh Murray
- Part 2 The Build: An Annual Sunburst Chart Template
Lindsay Betzendahl, Viz Zen Data
- The New York Times viz that divided #DataTwitter
Nicole Lillian Mark
- Reasons to Enter Iron Viz 2022
Sarah Bartlett, Sarah Loves Data
- End of year review
Anabelle Rincon, Rativiz
- Tableau Coxcomb Chart Template
Ken Flerlage, The Flerlage Twins
Calculations
- Changing Sheets in Tableau Using Parameters
Ricky Cai, The Data School Australia
- Sizing a Trellis Chart in Tableau
Alexander Mou, Vizible Difference
Data Culture, Blueprint
- Increase your Data Culture by Embracing these Trends
Brandi Beals
Formatting, Design, Storytelling
- Using Tableau Public Templates Efficiently
Klaus Schulte, VIZJOCKEY
- Making Tableau work in 4K resolution #tableau #dataviz #shorts
David Murphy, Datasaurus Rex<
- How (& Why) To Build a Diverging Bar Chart in Tableau
Eric Parker, OneNumber
- Advanced Tableau Mapping Series: Calculating Weighted “Center of Gravity”
Maddie Dierkes, Playfair Data
Prep
- The Beginner's Guide to Python in Tableau Prep Builder (Windows).
Matty Sweet, The Data School UK
Tips and Tricks
- Introducing the Transparent Color Hex Code in Tableau
Kevin Flerlage, The Flerlage Twins
- 3 Ways to Make Brilliant Bullet Graphs in Tableau
Alyssa Huff, Playfair Data
- How to Create a Calendar Widget for Filtering
Andy Kriebel, VizWiz
- How to Build a Slope Chart in Tableau
Eric Parker, OneNumber
Visualizations
View last month’s Viz of the Day on Tableau Public gallery.
相关故事

DataFam Roundup June 2026

DataFam Roundup May 2026

Iron Viz 2026: Read Between the Data
 2026/05/28