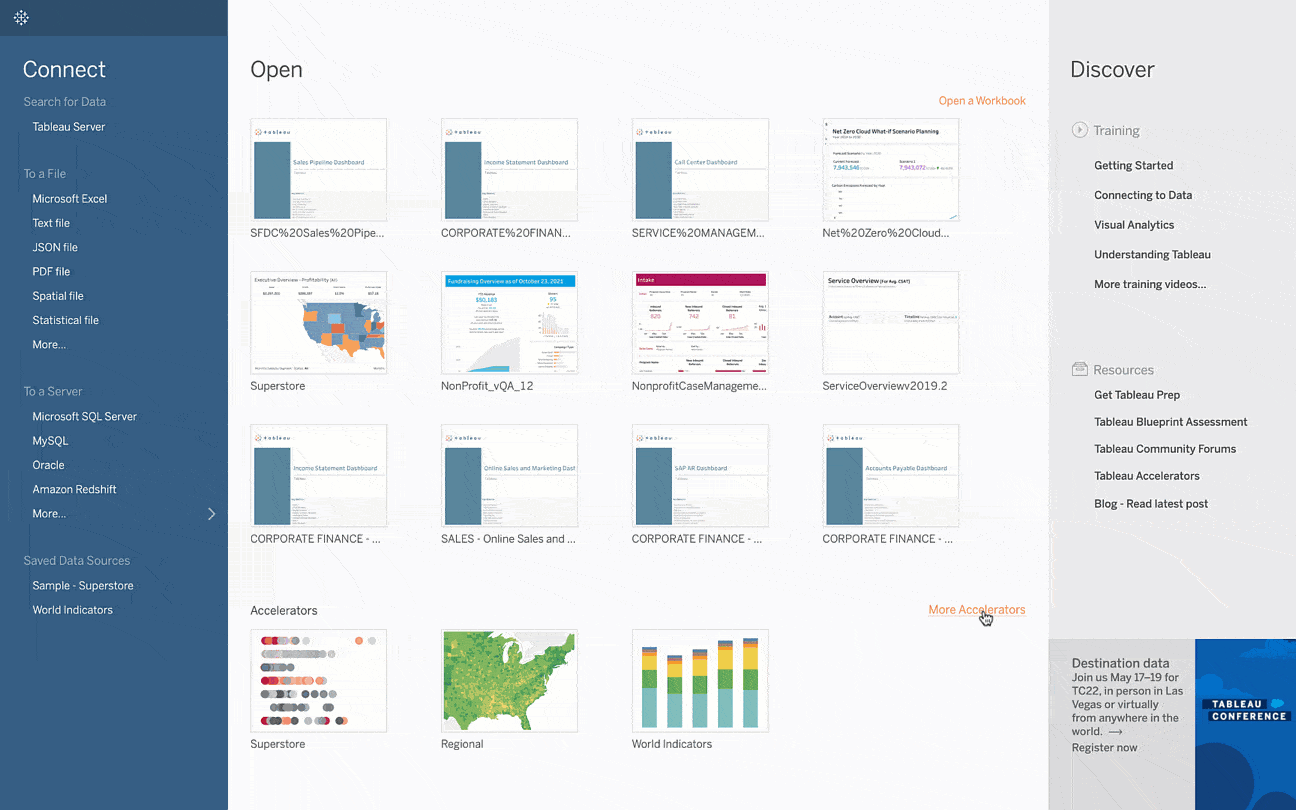
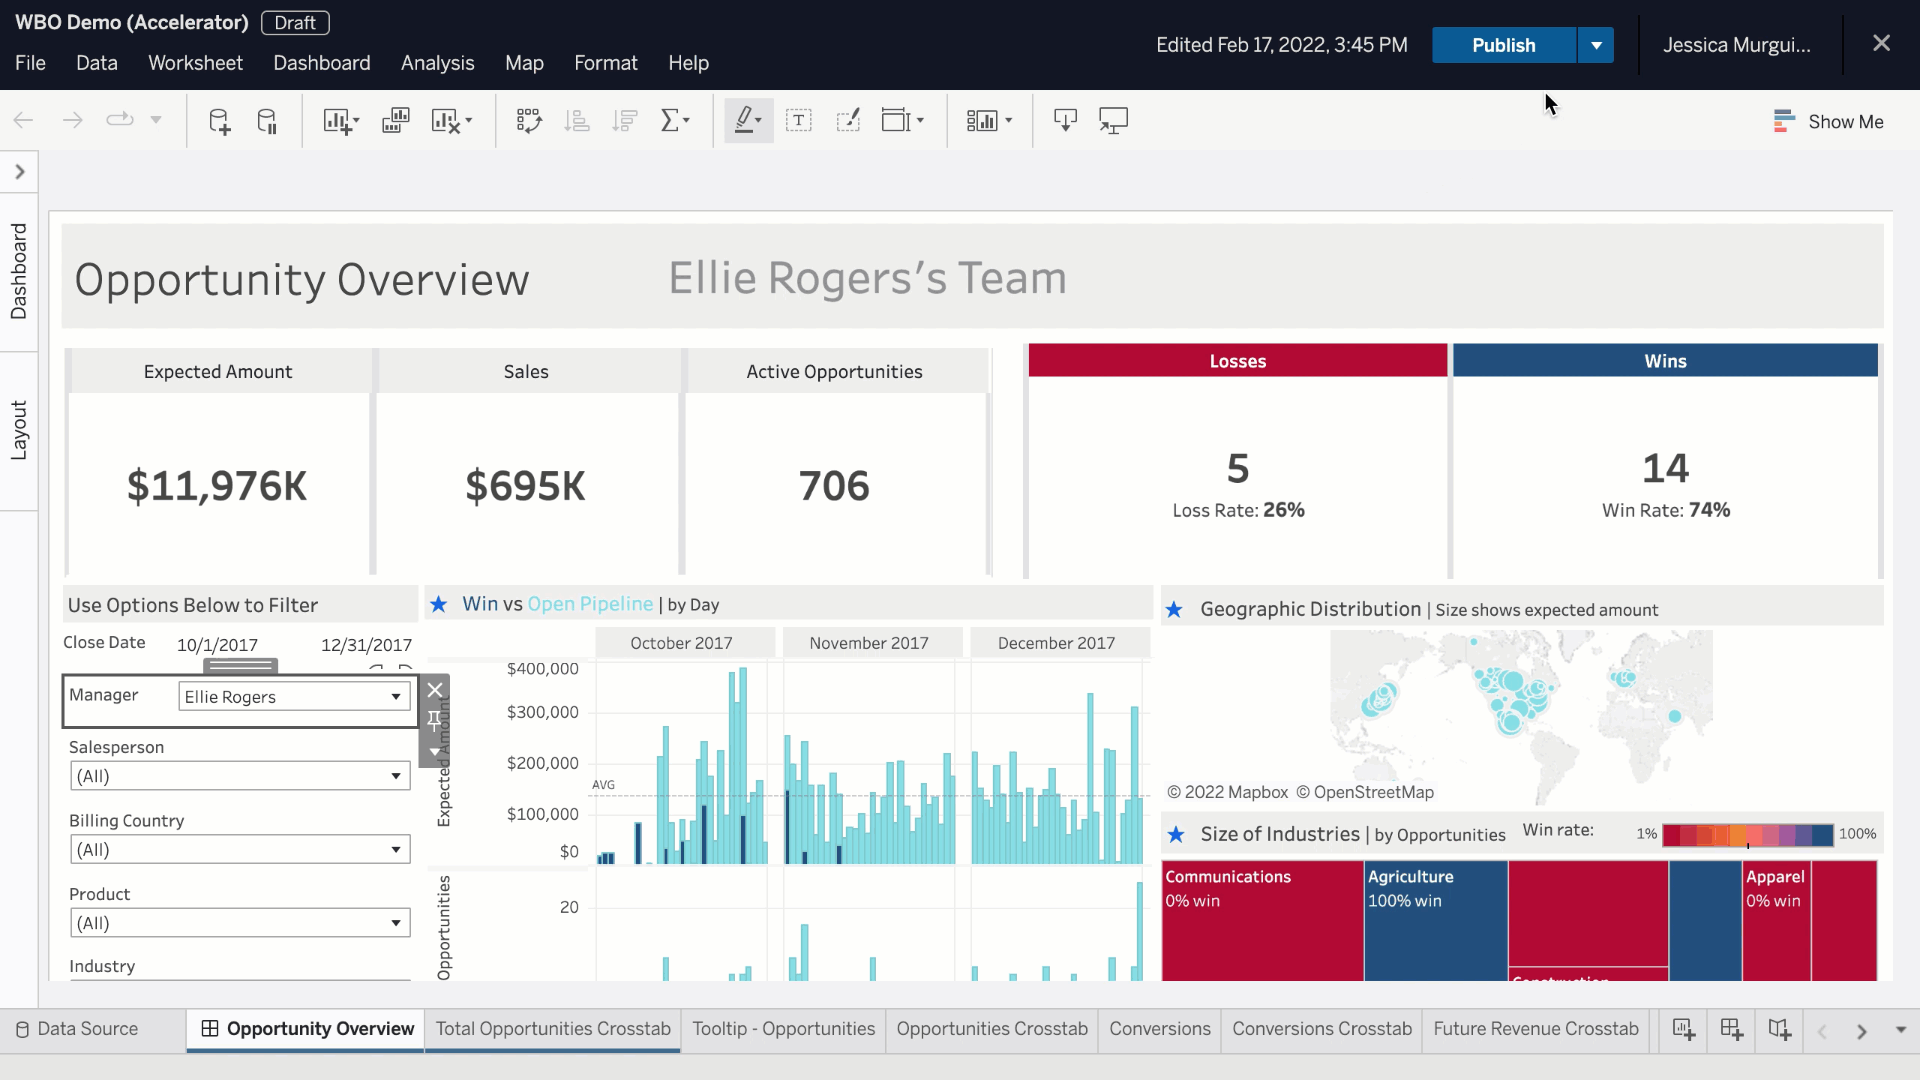
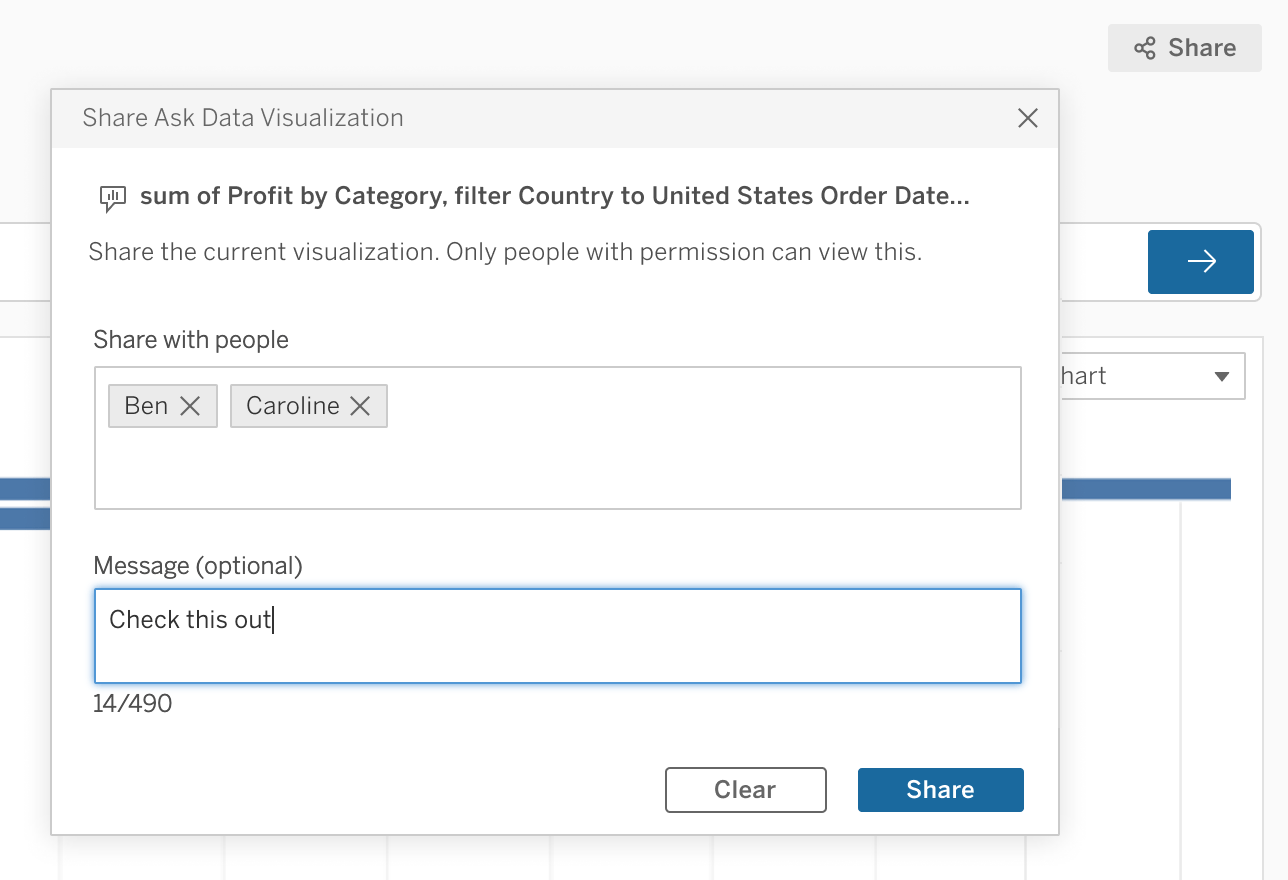
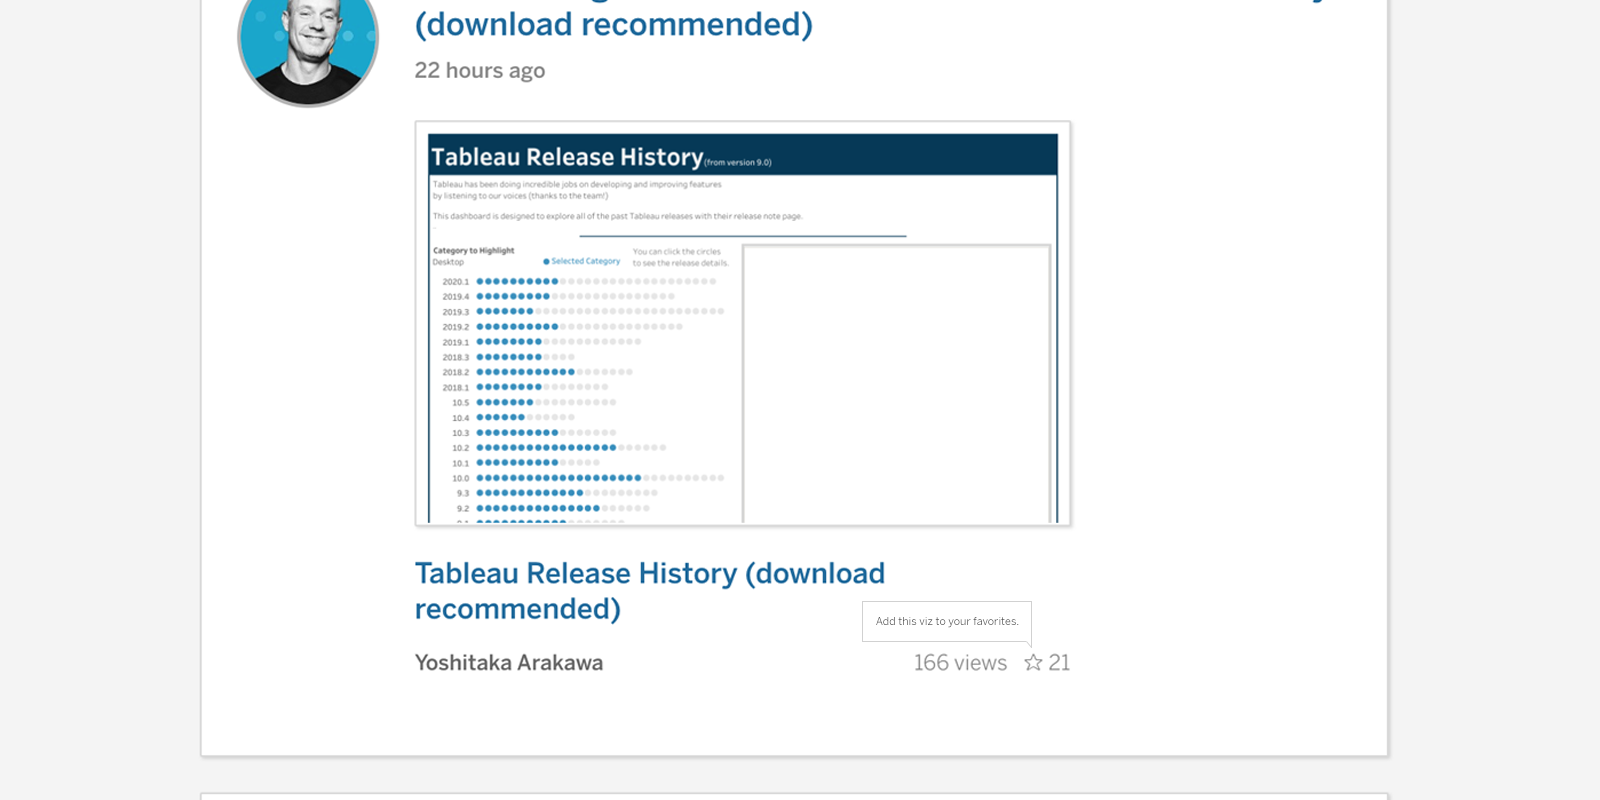
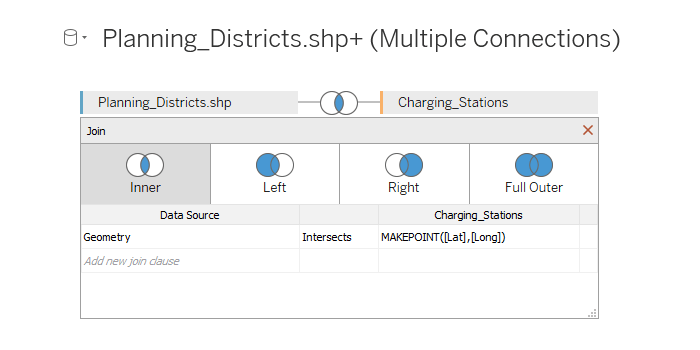
รุ่นผลิตภัณฑ์ทั้งหมด
เรียนรู้เพิ่มเติมเกี่ยวกับฟีเจอร์ใน Tableau รุ่นที่เปิดตัวผ่านมา ฟีเจอร์จำนวนมากด้านล่างได้รับแรงบันดาลใจโดยชุมชน Tableau ของเราเอง หากคุณมีแนวคิดสำหรับฟีเจอร์ใหม่ เรายินดีรับฟังเสมอ! โปรดโพสต์ความคิดเห็นของคุณในฟอรัมแนวคิด Tableau
Tableau 2025.3
Tableau 2025.3 มอบความสามารถใหม่ที่จะช่วยให้คุณปลดล็อกการวิเคราะห์ที่ขับเคลื่อนด้วย AI ในที่ทำงานของคุณ ไฮไลต์ประกอบด้วย การสอบเทียบ Q&A, Tableau Agent ใน Tableau Server, Dashboard Narratives และอื่นๆ อีกมากมาย
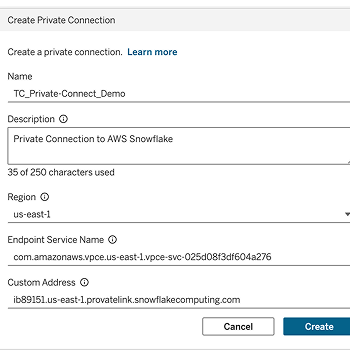
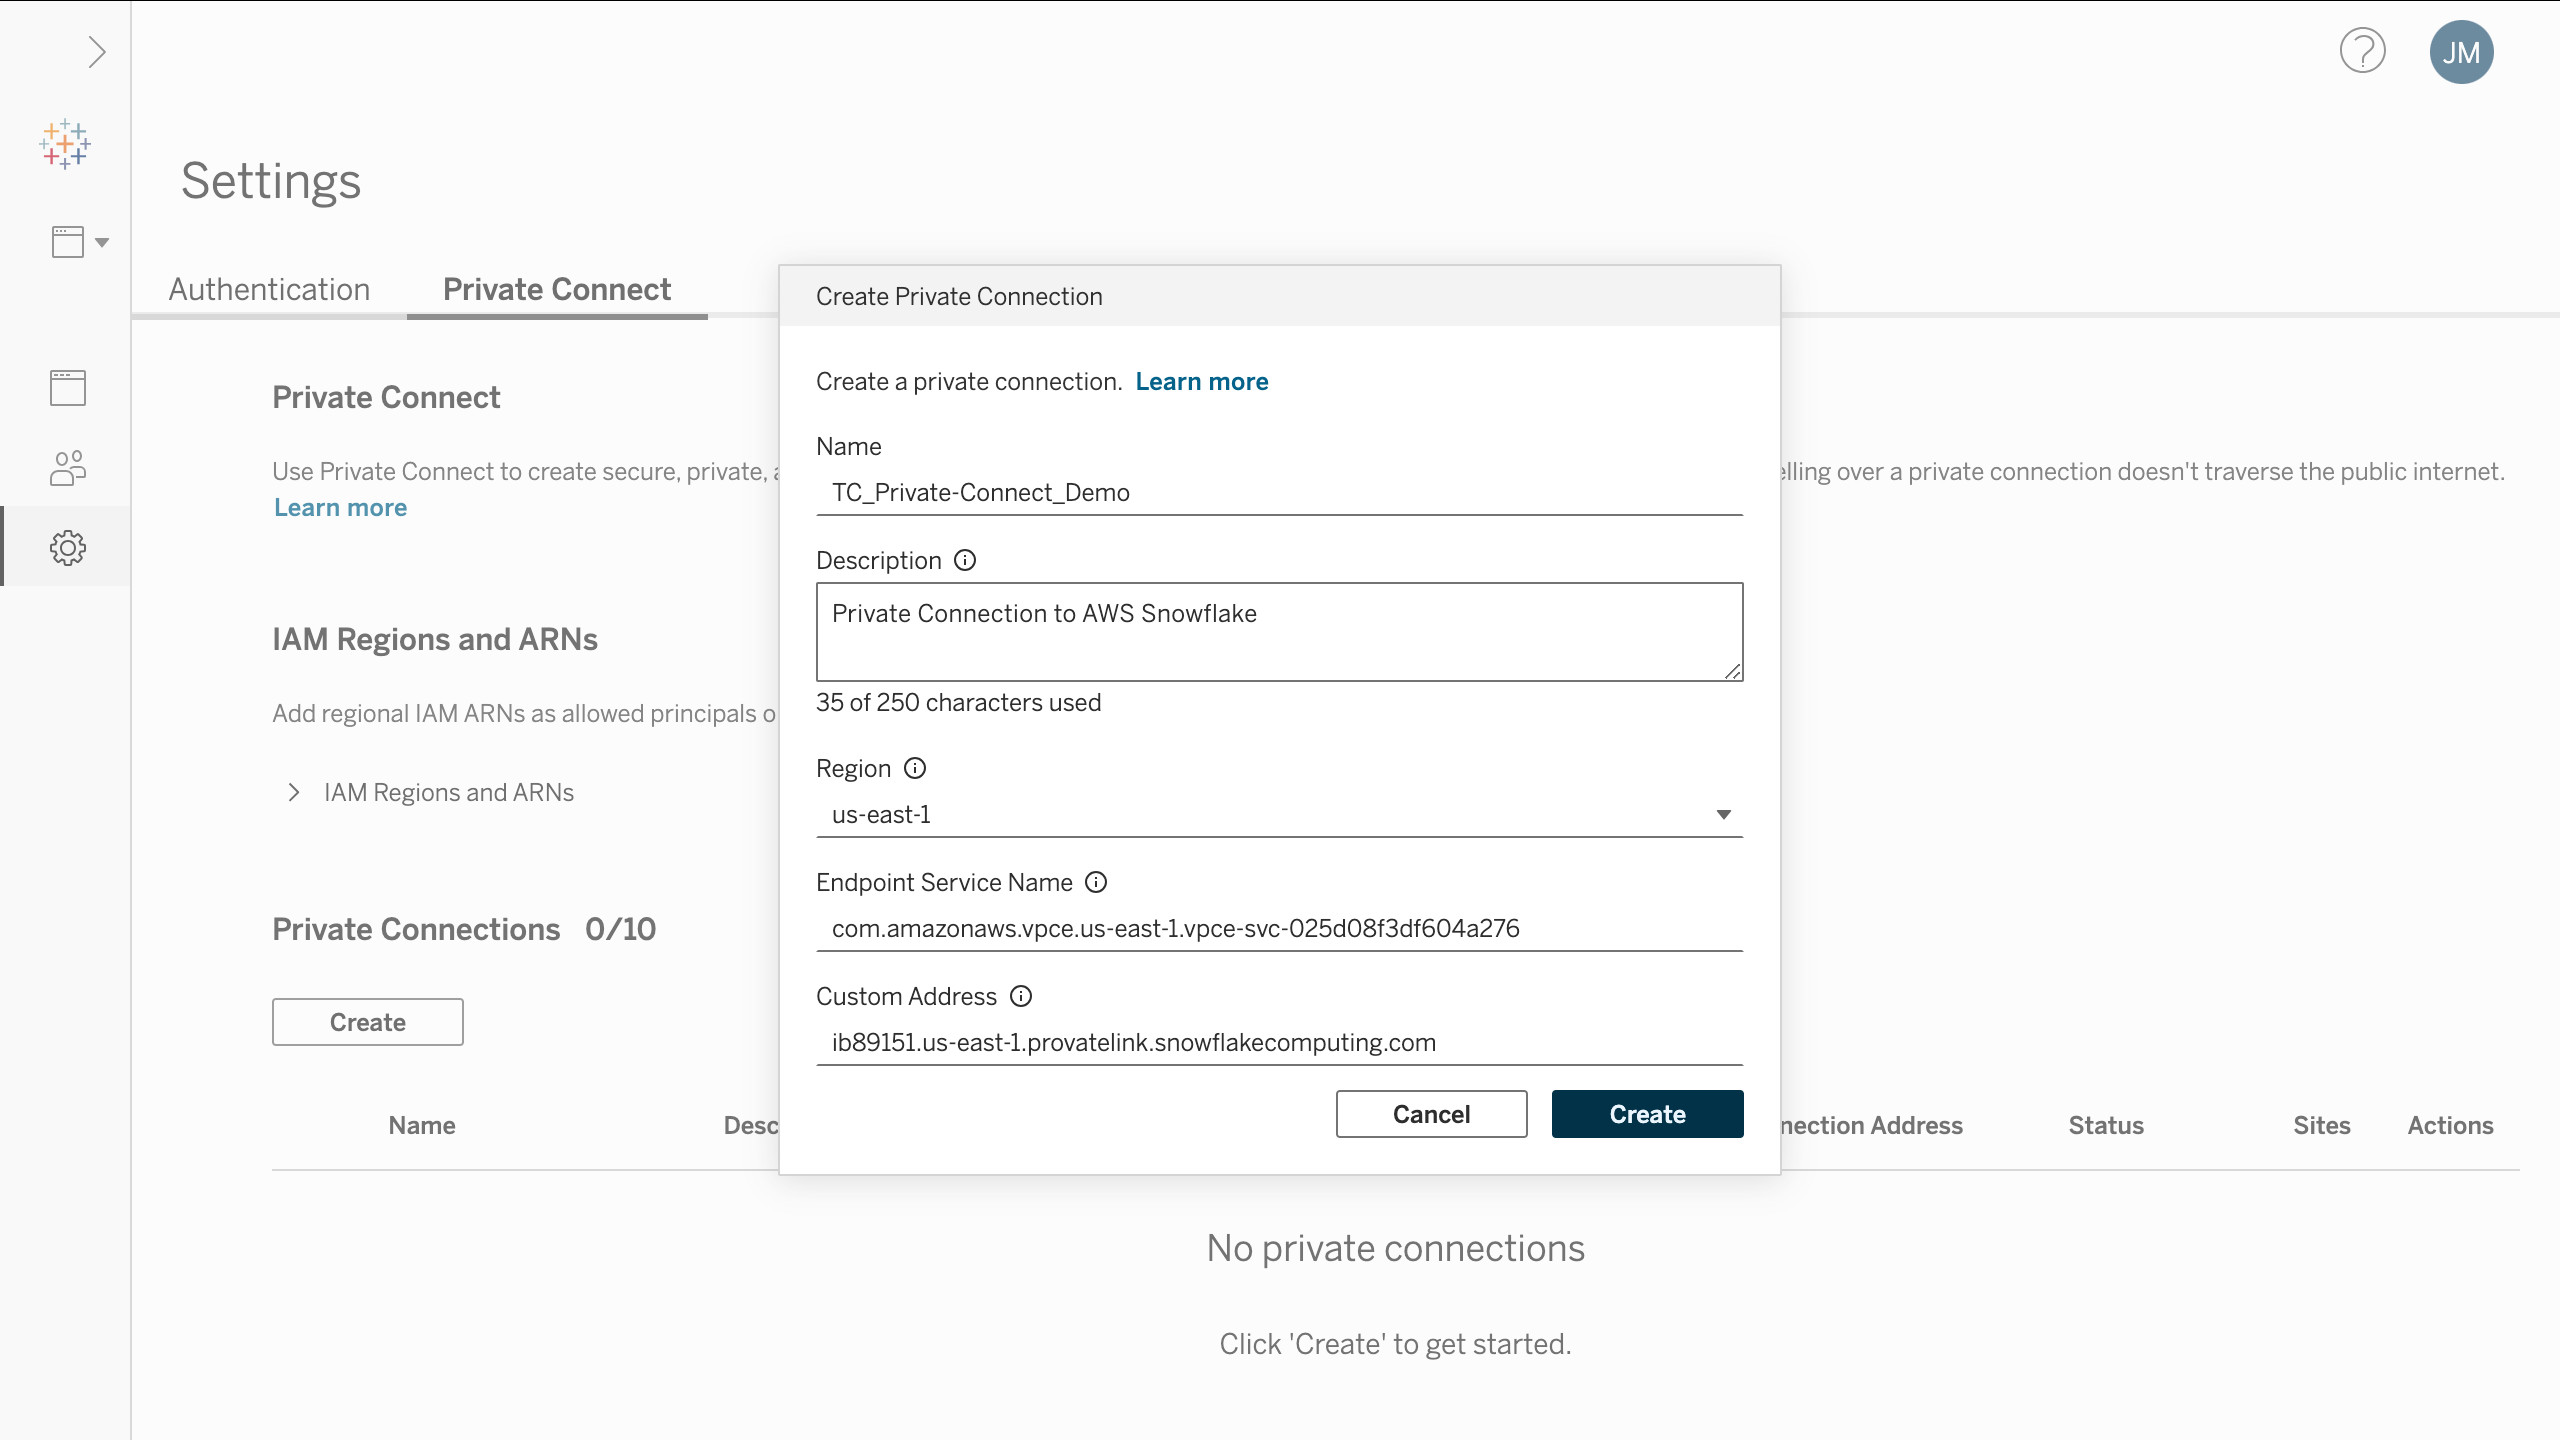
การเชื่อมต่อส่วนตัว: ตัวเชื่อมต่อเพิ่มเติม
เพิ่มความปลอดภัยโดยรักษาการเชื่อมต่อกับข้อมูลของคุณให้เป็นส่วนตัวและป้องกันไม่ให้เชื่อมต่อกับอินเทอร์เน็ตสาธารณะ ตอนนี้ลูกค้า Tableau Cloud สามารถเชื่อมต่อฐานข้อมูลที่โฮสต์โดย AWS ได้แล้วเช่น PGSQL, MySQL, MSSQL, OracleDB และ Aurora กับ Tableau Cloud โดยใช้ AWS Private Link ซึ่งมอบการเชื่อมต่อที่ปลอดภัย เฉพาะเจาะจง และเป็นส่วนตัว หลีกเลี่ยงการใช้อินเทอร์เน็ตสาธารณะ
นอกจากนี้ การเชื่อมต่อส่วนตัวสามารถมีการเชื่อมต่อแบบข้ามภูมิภาคได้ด้วยสำหรับ Redshift, PGSQL, MySQL, MSSQL, OracleDB และ Aurora และมีการรองรับการเชื่อมต่อแบบเสมือน
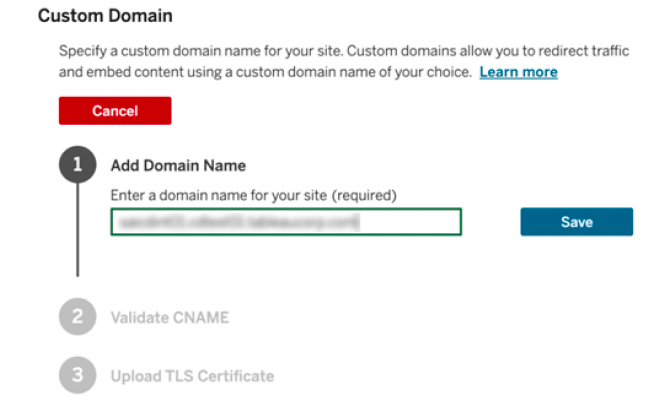
โดเมนที่กำหนดเอง
มอบประสบการณ์ภายใต้แบรนด์ของคุณที่ราบรื่นต่อแก่ผู้ใช้ ด้วยโดเมนที่กำหนดเองสำหรับไซต์ Tableau Cloud ของคุณ ขจัดการใช้คุกกี้ของบุคคลที่สามในสถานการณ์ที่มีการฝัง และมอบ URL ที่เรียบง่ายและจดจำได้ง่ายแก่ผู้ใช้เพื่อเข้าถึงข้อมูลการวิเคราะห์
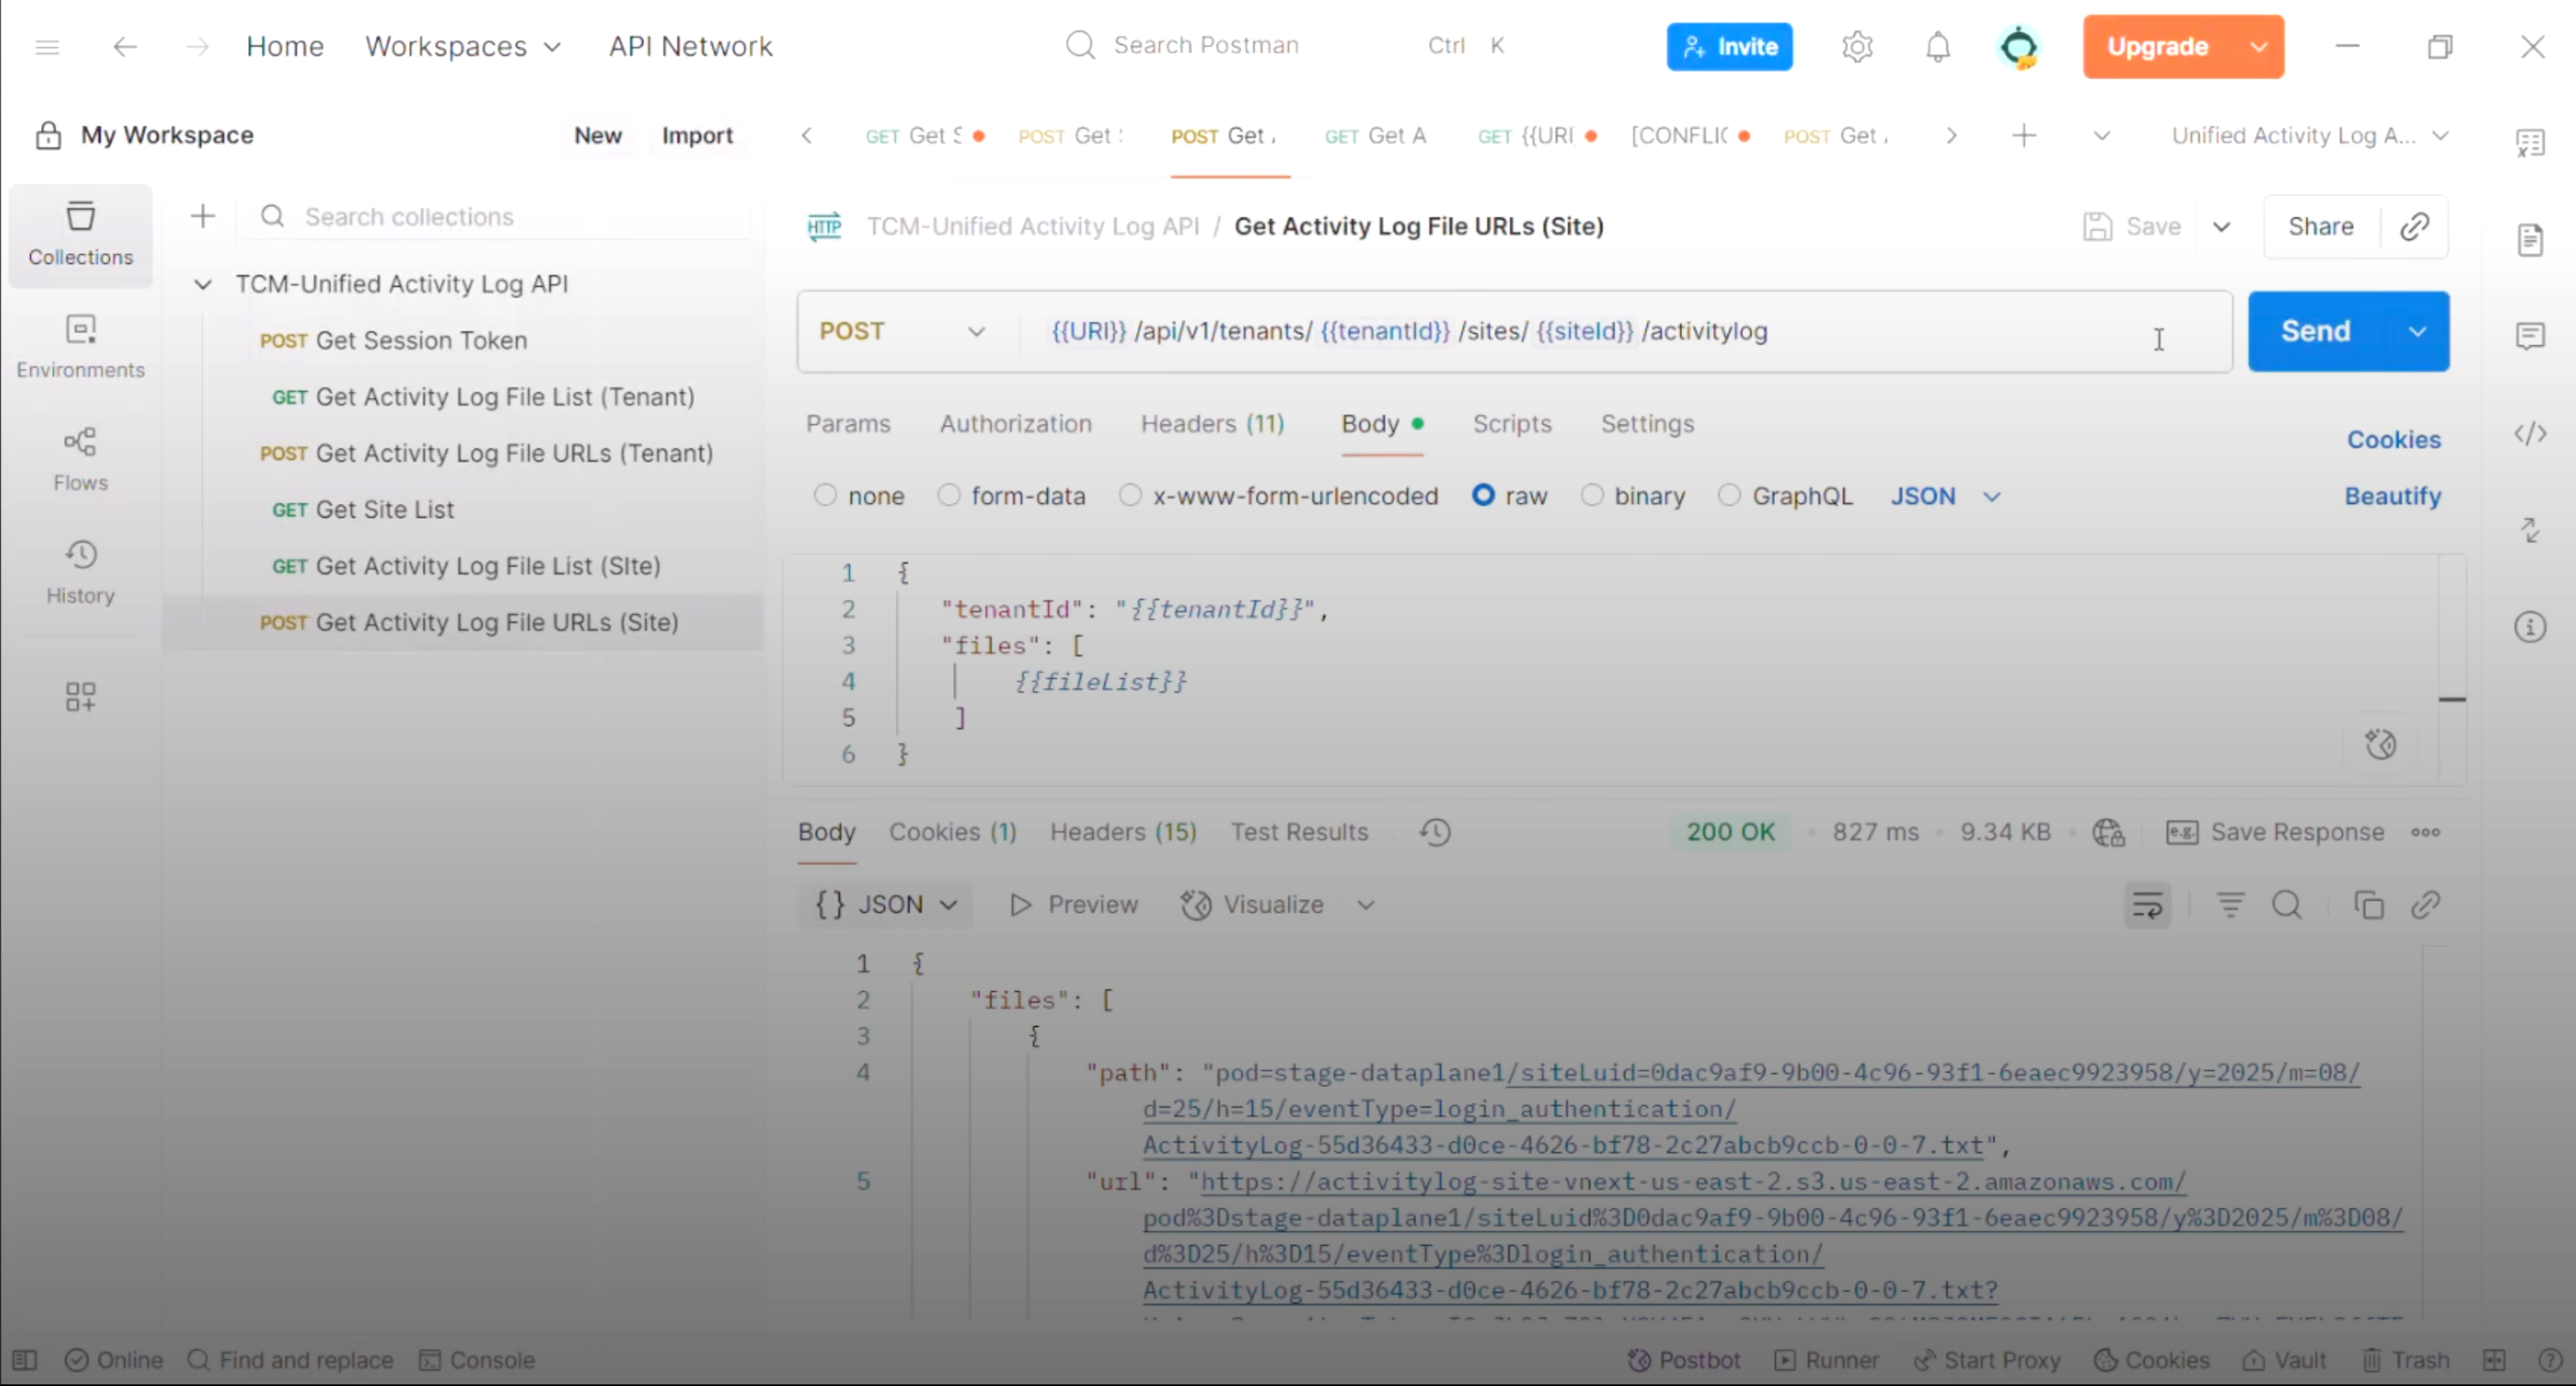
API ข้อมูลแพลตฟอร์ม
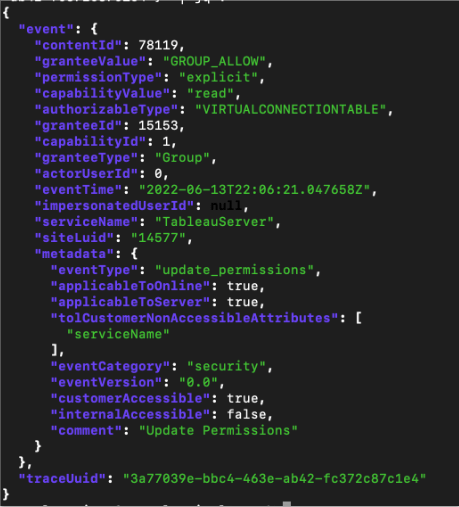
รับการเข้าถึงข้อมูลกิจกรรมและเหตุการณ์ของ Tableau Cloud ในรูปแบบโปรแกรมโดยไม่ต้องใช้การผสานรวม AWS S3 ใช้ API ใหม่เพื่อดึงข้อมูลบันทึกบันทึกเหตุการณ์แบบรวมสำหรับการตรวจสอบแบบกำหนดเอง, การนำเข้าข้อมูล SIEM หรือการวิเคราะห์ในคลังข้อมูลของคุณเอง
หมายเหตุ: บันทึกแบบเกือบเรียลไทม์และการผสานรวม S3 พร้อมใช้งานเฉพาะกับ Tableau Enterprise หรือ Tableau+ Bundle เท่านั้น
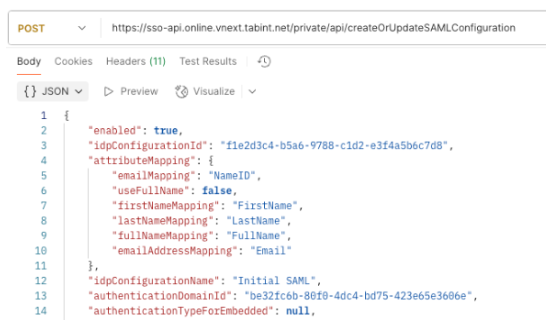
กำหนดค่า SAML ผ่าน REST API
บรรลุประสิทธิภาพและขนาดที่มากยิ่งขึ้น เมื่อจัดการการรักษาความปลอดภัยสำหรับหลายไซต์ด้วย API REST ของการกำหนดค่า SAML ใหม่ กำหนดค่า SAML ในรูปแบบโปรแกรมทั้งใน Tableau Cloud Manager หรือไซต์ Tableau Cloud และสร้างสคริปต์เพื่อหมุนเวียนใบรับรองผู้ให้บริการข้อมูลประจำตัว (Identity Provider - IdP) โดยอัตโนมัติ
ฟังก์ชันแอททริบิวผู้ใช้สำหรับ SAML และ OIDC
เพิ่มความปลอดภัยในระดับแถวด้วยแอตทริบิวต์ผู้ใช้ที่ส่งผ่านโดยตรงจากผู้ให้บริการข้อมูลประจำตัวของคุณ รักษาความปลอดภัยข้อมูลด้วยการควบคุมการเข้าถึงตามแอตทริบิวต์ (ABAC) ผ่านฟังก์ชันแอตทริบิวต์ผู้ใช้ (UAF) ด้วยการส่งแอตทริบิวต์จาก IdP แบบไดนามิกโดยใช้โทเค็นการตรวจสอบความถูกต้อง SAML หรือ OIDC ซึ่งจะรับรองความมั่นใจว่าผู้ใช้จะเห็นเฉพาะข้อมูลที่ได้รับอนุญาตให้เห็นเท่านั้น
โทเค็นการเข้าถึงแบบรวม Tableau Cloud
ลดความซับซ้อนของการจัดการแบบหลายไซต์และเปิดใช้งานระบบอัตโนมัติที่มีประสิทธิภาพด้วยโซลูชันการตรวจสอบความถูกต้อง JWT แบบรวมศูนย์ วิธีการอันทันสมัยและปลอดภัยนี้จะแทนที่โทเค็นการเข้าถึงส่วนบุคคลที่จัดการได้ยาก ซึ่งช่วยให้คุณรวมศูนย์การเข้าถึง API จากสภาพแวดล้อม Tableau Cloud ทั้งหมดของคุณ
Tableau รุ่น November 2025
Tableau รุ่น November 2025 มีความสามารถใหม่ๆ ที่จะช่วยให้คุณได้รับข้อมูลเชิงลึกจากข้อมูลเร็วขึ้น ไฮไลต์ประกอบด้วย เซิร์ฟเวอร์ MCP, แหล่งข้อมูลที่เผยแพร่, การฝังภายนอก และอื่นๆ อีกมากมาย
Tableau รุ่น October 2025
Tableau รุ่น October 2025 มีความสามารถใหม่ๆ ที่จะช่วยให้คุณตัดสินใจได้อย่างชาญฉลาดยิ่งขึ้น ไฮไลต์ประกอบด้วย Inspector, Tableau Next Slack Enhancements, Visualizations และอื่นๆ
Tableau รุ่น September 2025
Tableau รุ่น September 2025 มีความสามารถใหม่ที่จะช่วยให้คุณเจาะลึกลงในเมตริก ไฮไลต์ประกอบด้วยการอัปเดต Q&A ที่ปรับปรุงใหม่, เมตริกที่สัมพันธ์กัน และอื่นๆ อีกมากมาย
Tableau รุ่น August 2025
Tableau รุ่น August 2025 มีความสามารถใหม่ๆ ที่จะช่วยให้คุณได้รับข้อมูลเชิงลึกเร็วขึ้น ไฮไลท์รวมถึง Data Pro, Tableau Next และ Slack, การเสริมประสิทธิภาพการแสดงเป็นภาพ, การแจ้งเตือนเกณฑ์ และอื่นๆ
Tableau 2025.2
Tableau 2025.2 มีความสามารถใหม่ๆ ที่จะช่วยคุณส่งมอบข้อมูลเชิงลึกที่ไว้ใจได้ด้วยการวิเคราะห์ของเอเจนต์ รวมถึงสามารถฝังการแสดงภาพและเมตริกในจุดที่คุณต้องการได้ ไฮไลท์เด่นได้แก่ Concierge, การเรียนรู้ความหมาย, แอป Tableau สำหรับ Google Workspace และอีกมากมาย
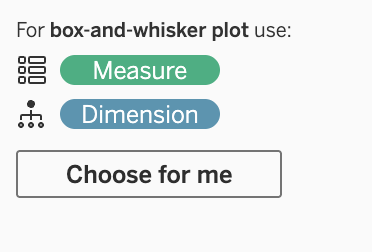
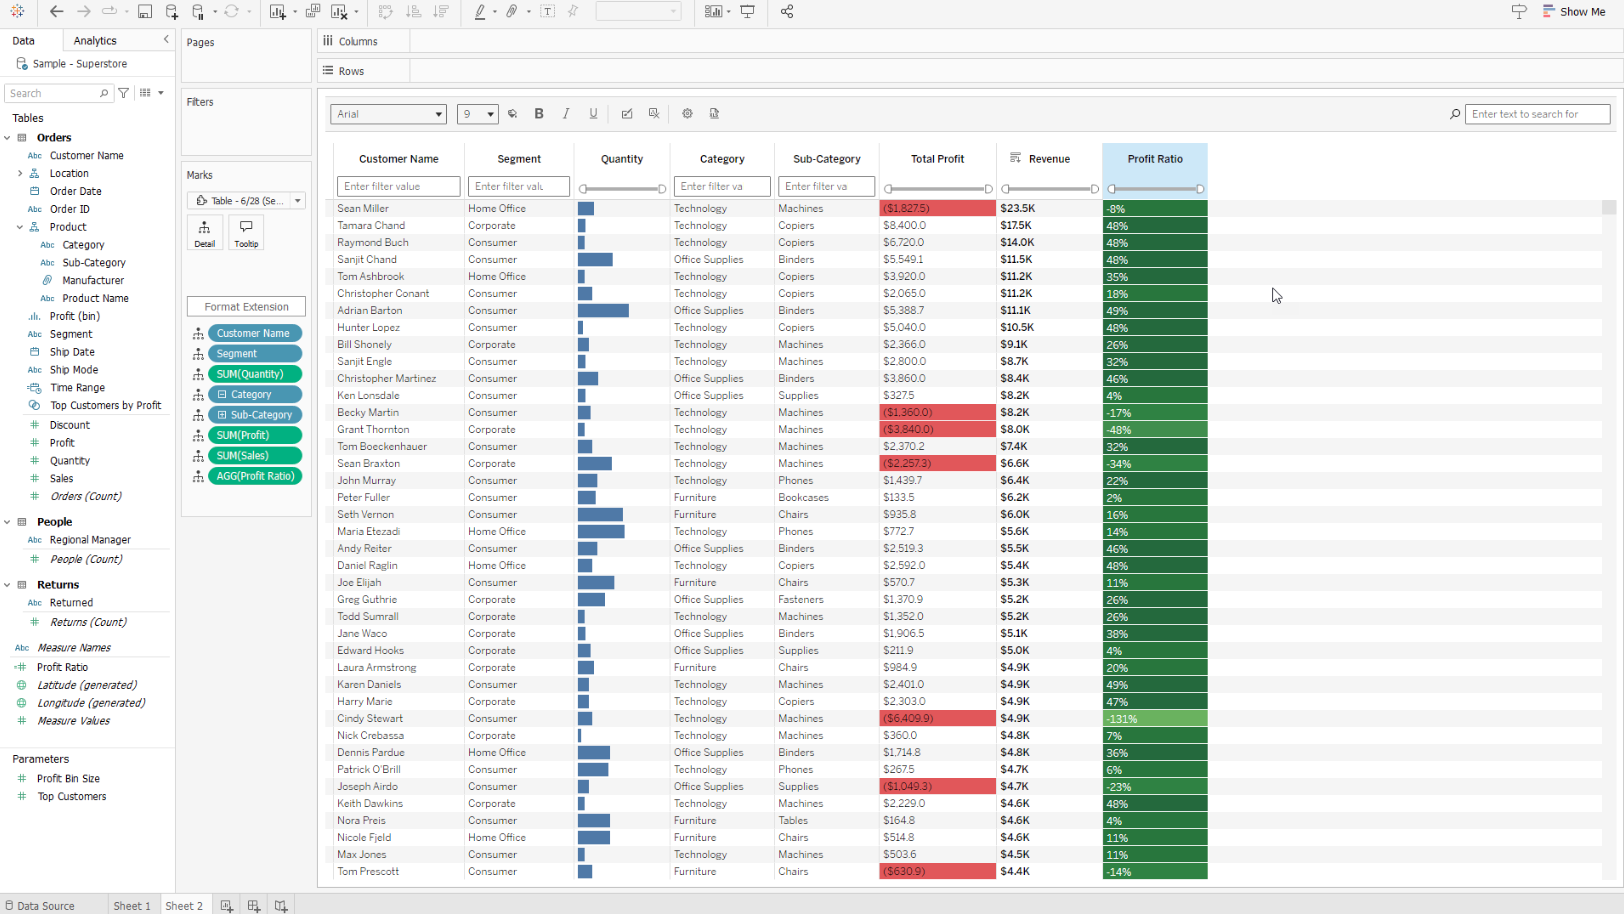
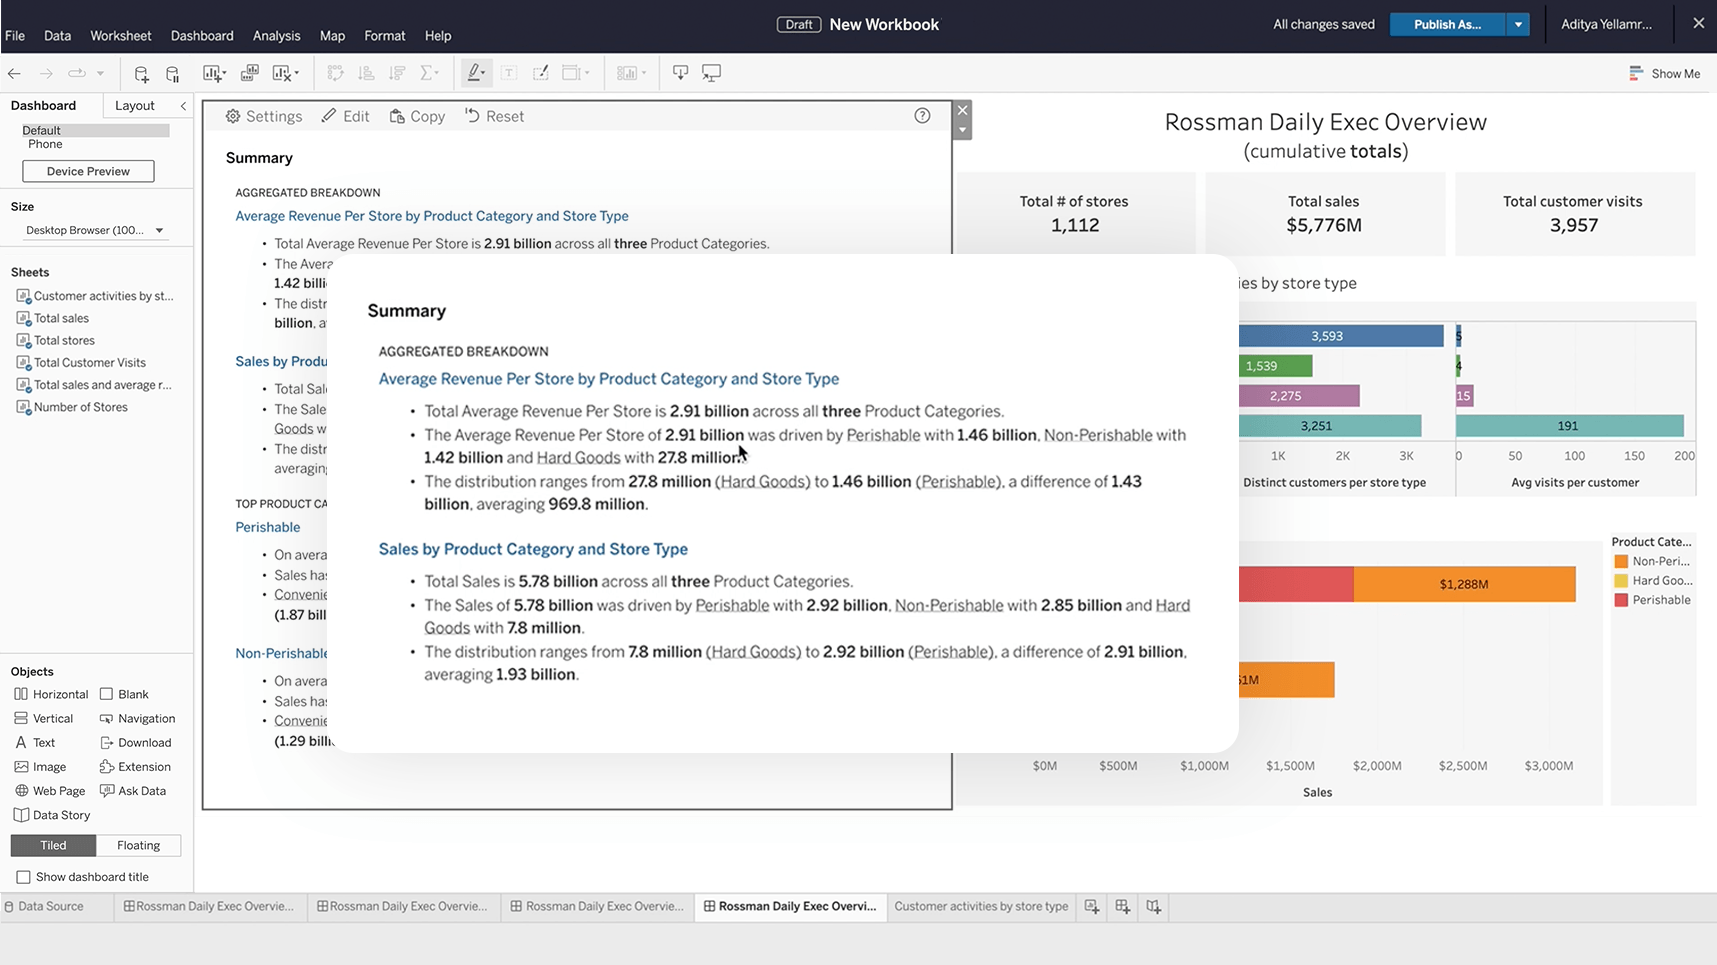
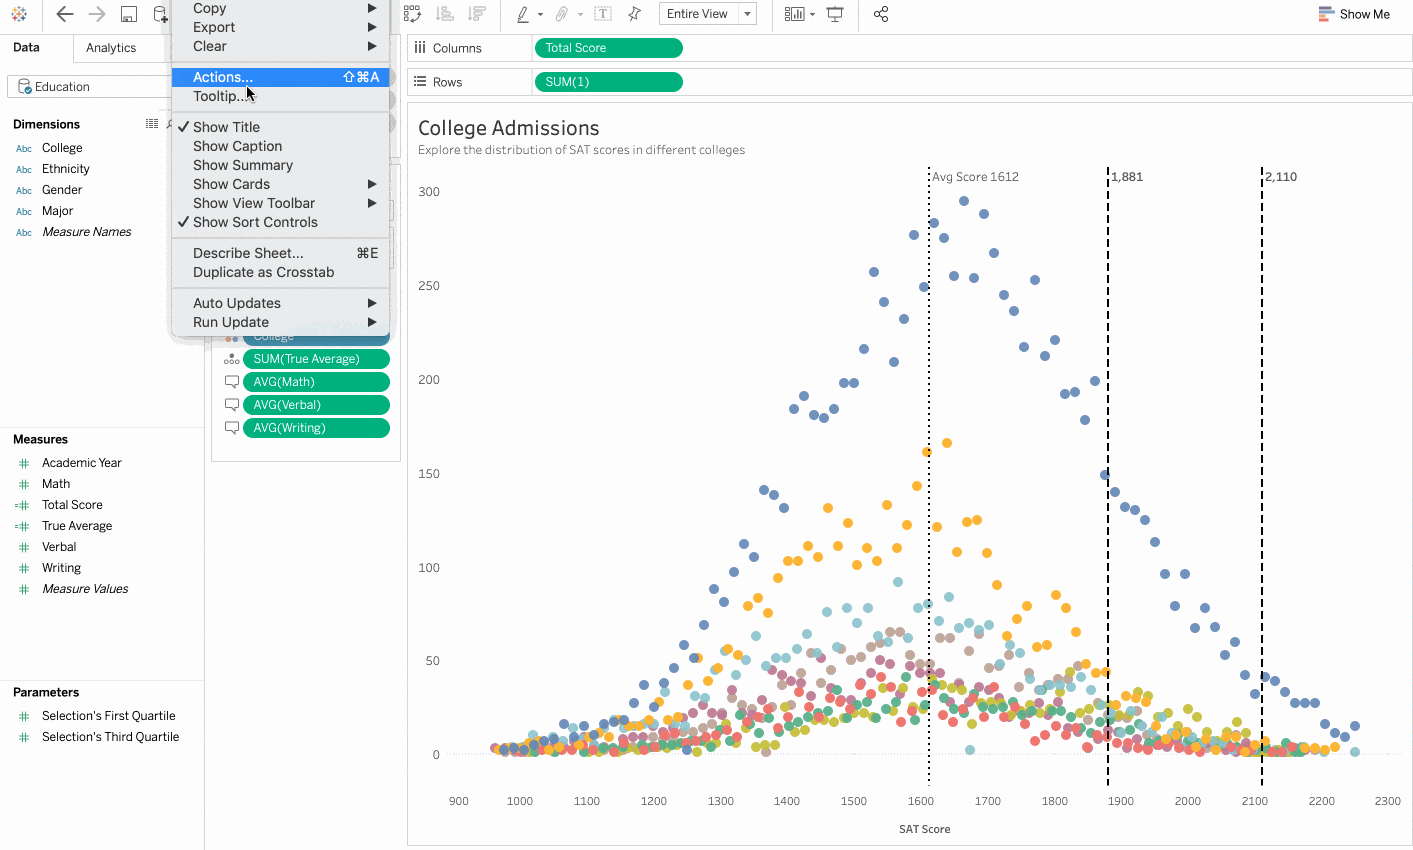
Show Me 2.0
ฟีเจอร์ Show Me เวอร์ชันคลาสสิกของ Tableau ดีขึ้นกว่าเดิม ประสบการณ์ผู้ใช้ที่ปรับปรุงดีขึ้นออกแบบมาเพื่อช่วยผู้ใช้เริ่มต้นใช้งานได้เร็วขึ้น ตอนนี้การแสดงภาพทุกประเภทพร้อมใช้งานล่วงหน้าแล้ว ไม่ต้องเลือกช่องข้อมูลก่อน การอัปเดตนี้ลดอุปสรรคในการเข้าใช้งานของผู้ใช้ใหม่ ทำให้สำรวจข้อมูลหรือให้ Tableau แนะนำจุดเริ่มต้นได้ง่ายขึ้น เป็นฟีเจอร์ที่ไว้วางใจได้เช่นเดิม แต่ใช้งานง่ายและเป็นมิตรกับผู้ใช้มากขึ้นกว่าเดิม
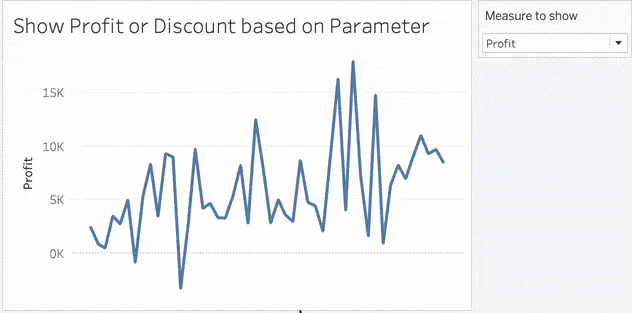
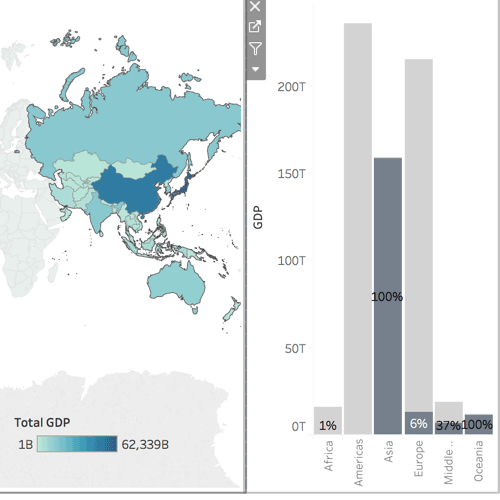
ช่วงสีแบบไดนามิก
ช่วงสีแบบไดนามิกช่วยคุณเน้นสิ่งที่สำคัญให้โดดเด่นแม้จะมีค่าผิดปกติในข้อมูลของคุณด้วยก็ตาม ใช้พารามิเตอร์แทนการกรองเพื่อปรับสเกลสีของคุณและเน้นความสำคัญในจุดที่เกี่ยวข้อง เป็นวิธีที่รวดเร็วและยืดหยุ่นในการทำให้แผนภูมิของคุณชัดเจนและมีข้อมูลเชิงลึก
ฟีเจอร์นี้จะจัดการคำขอทั้งหมดหรือบางส่วนบน Salesforce IdeaExchange ดังต่อไปนี้: สีแบบไดนามิกทั่วทั้ง Tableau
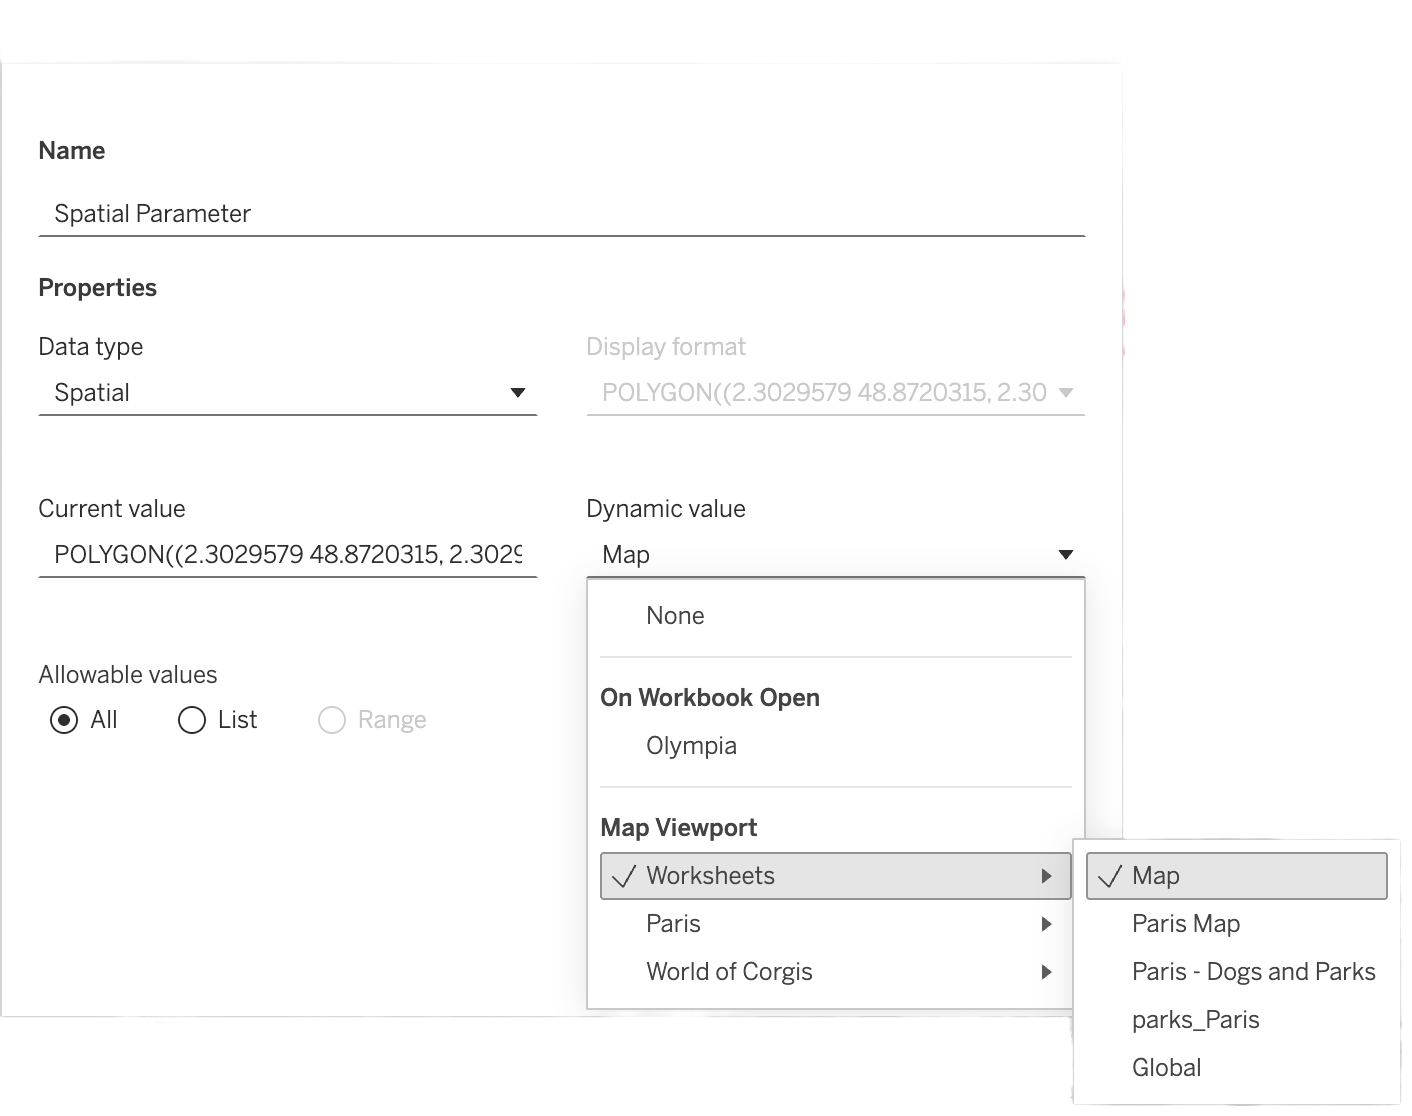
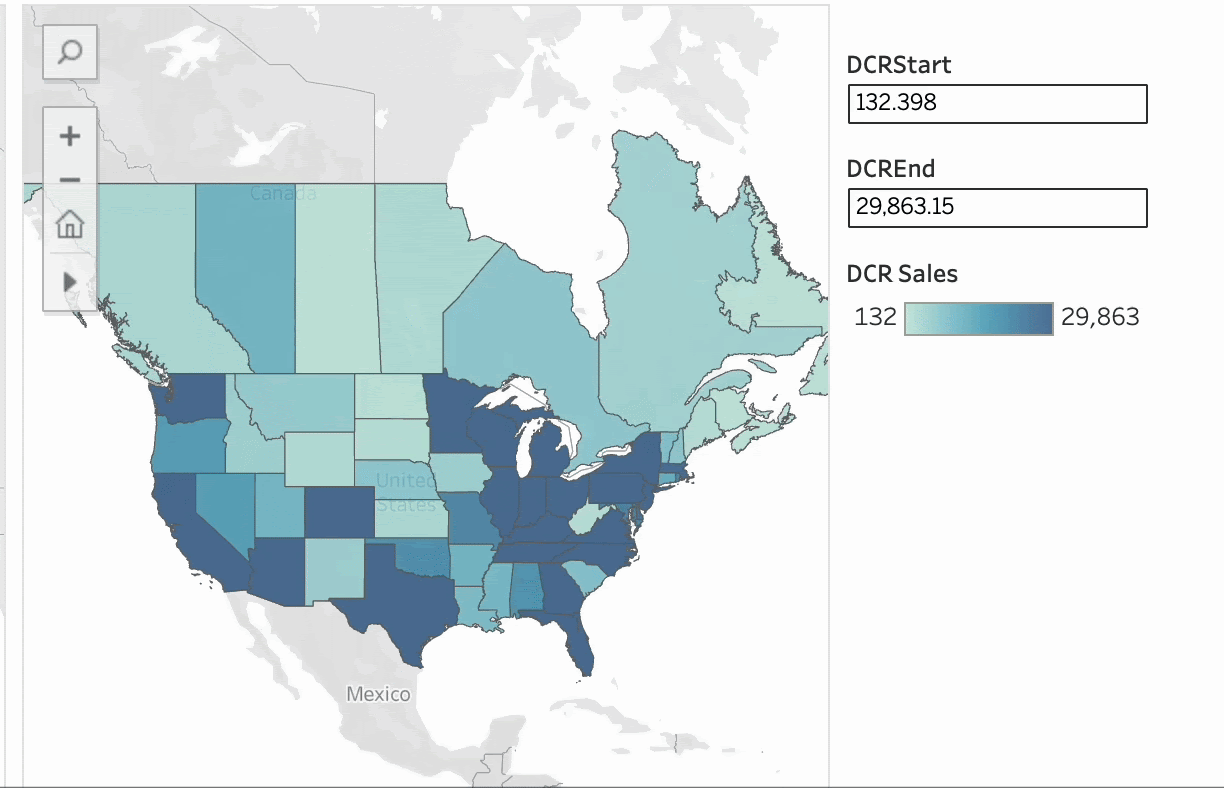
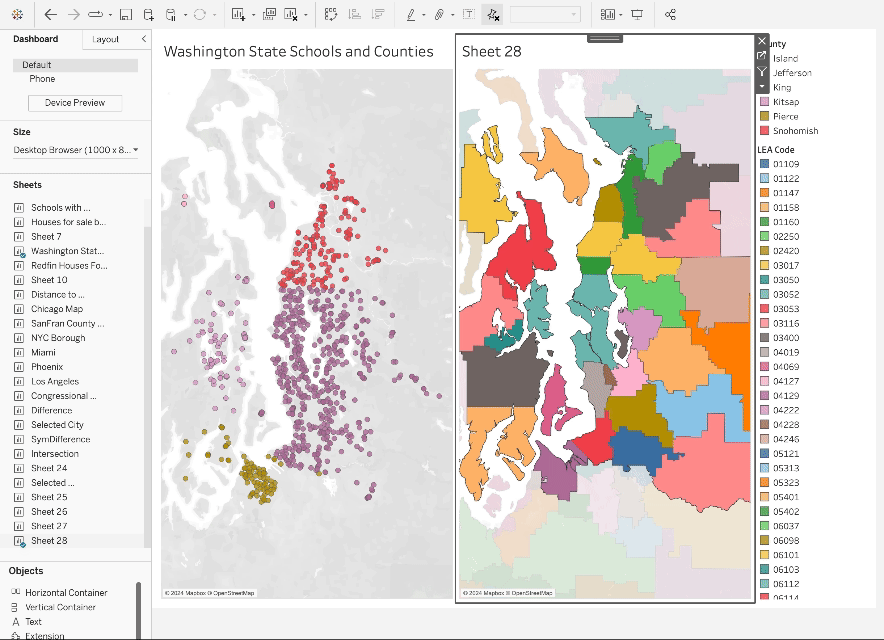
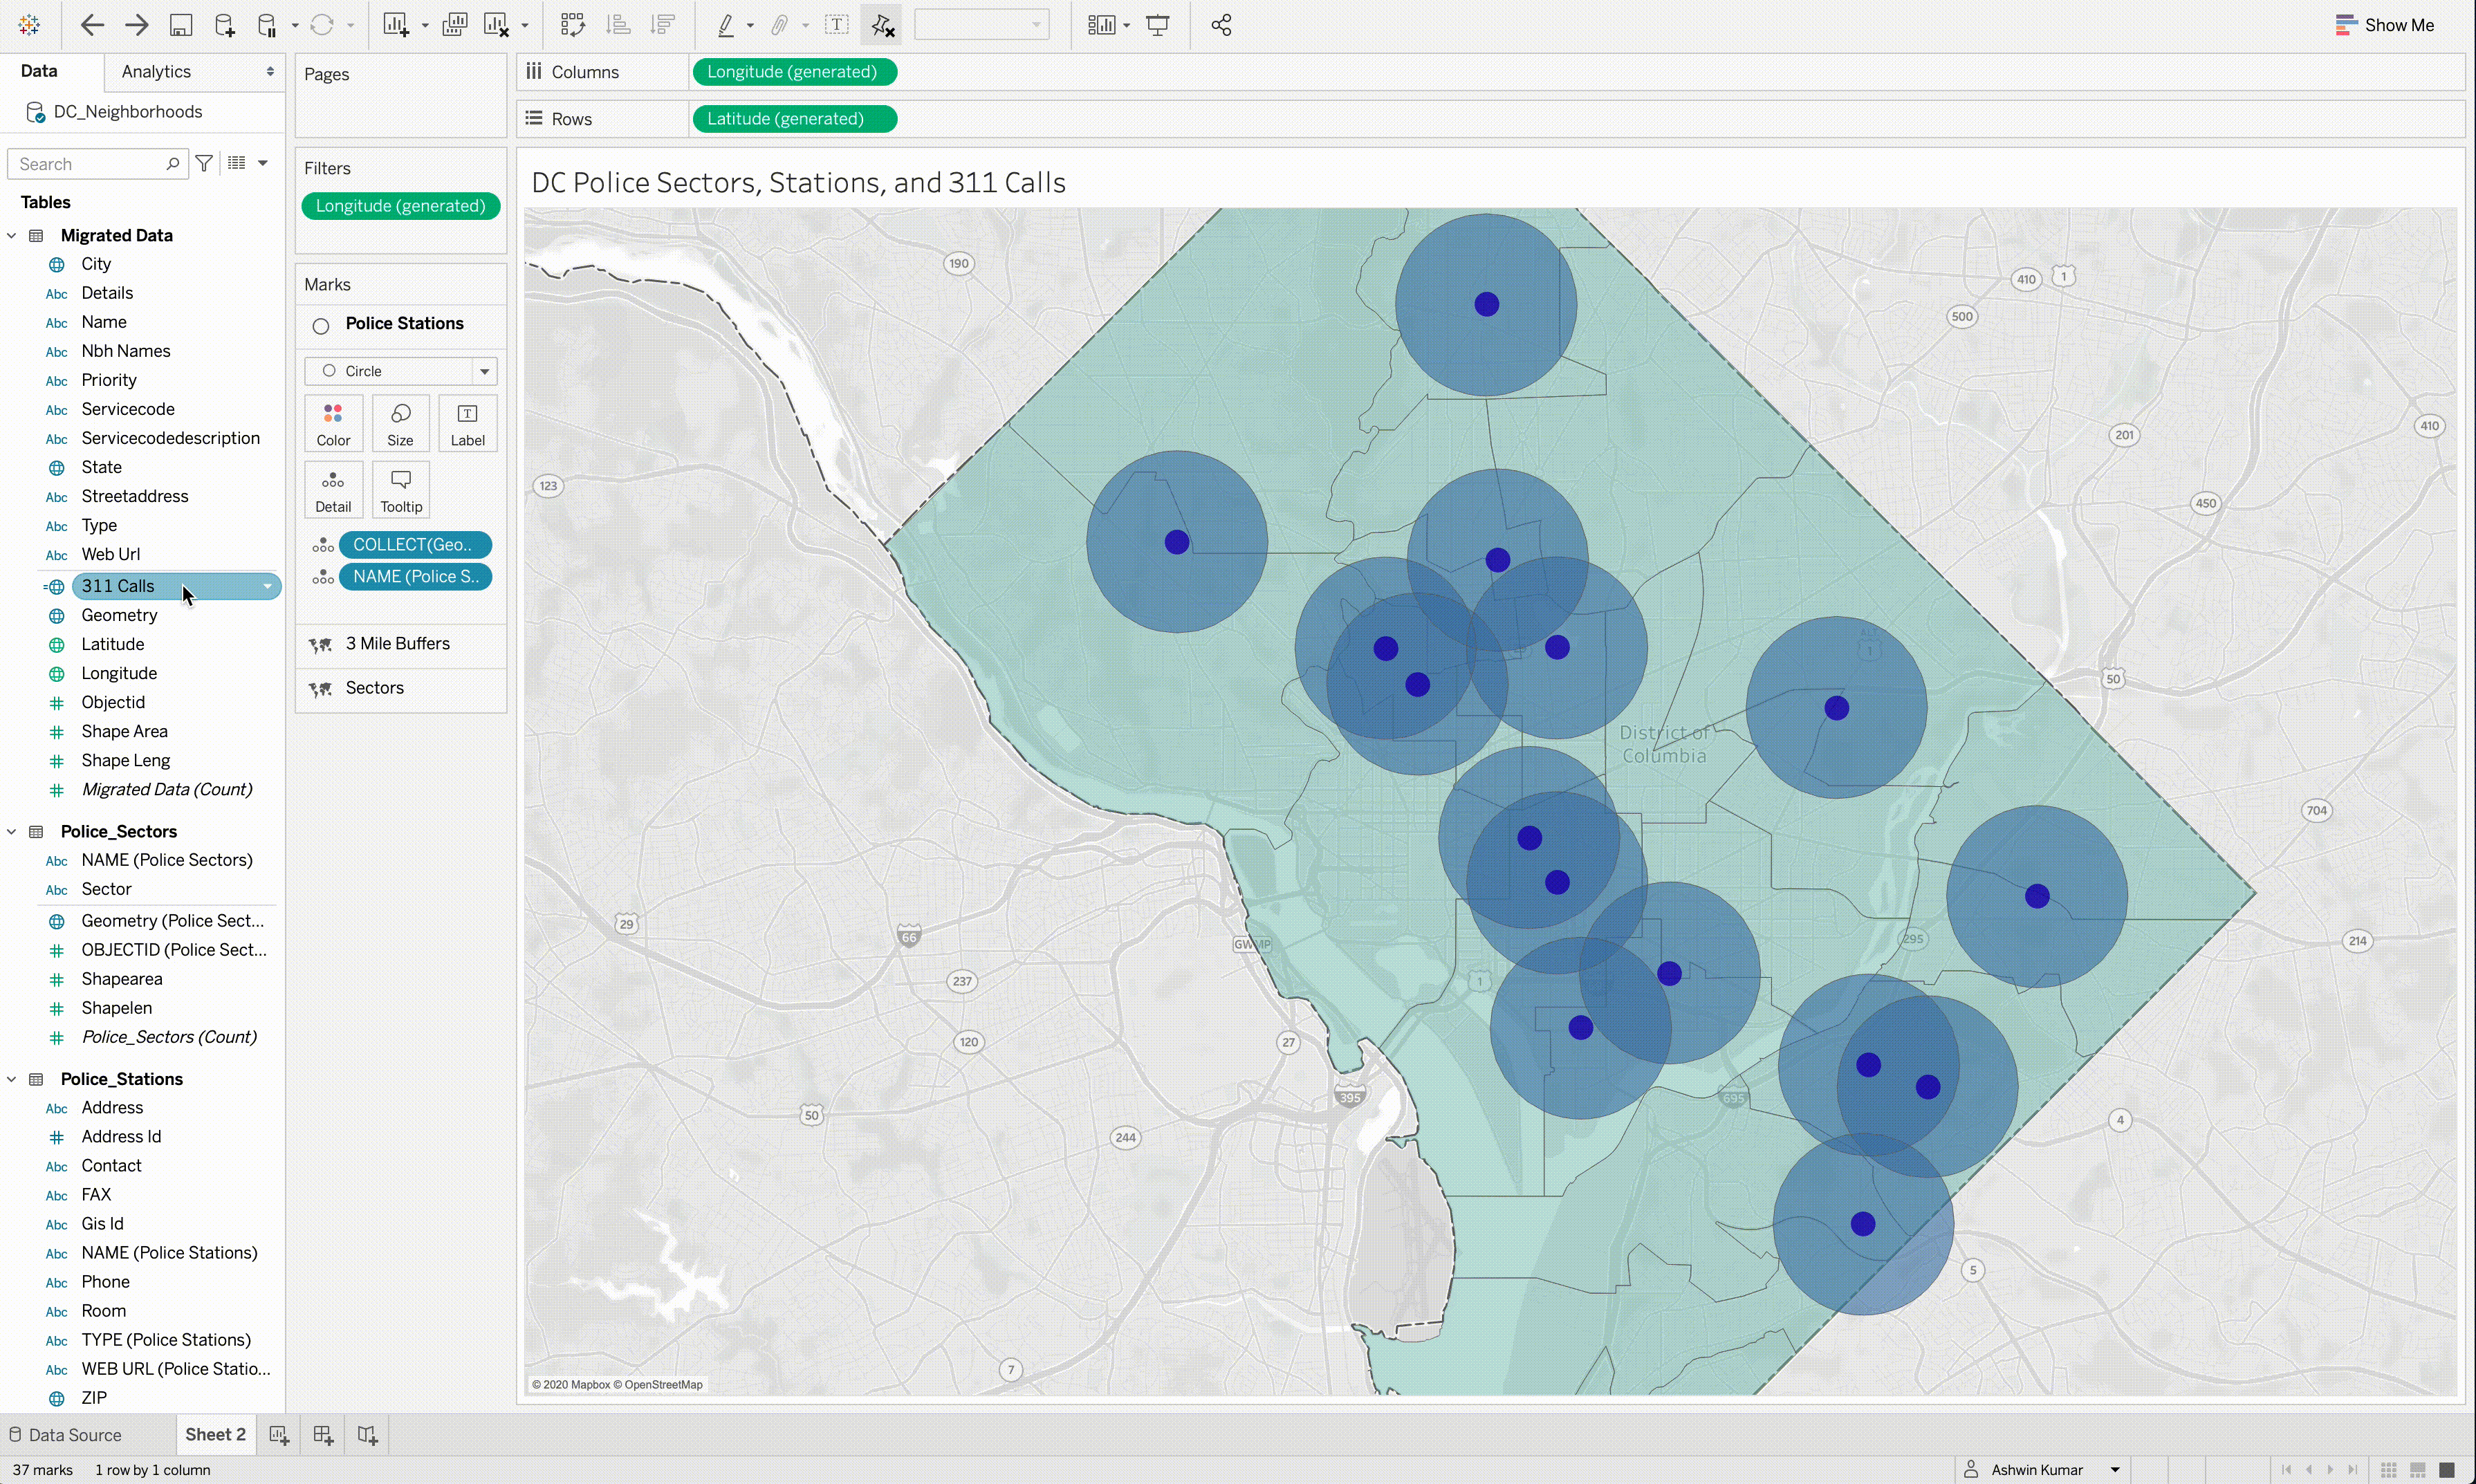
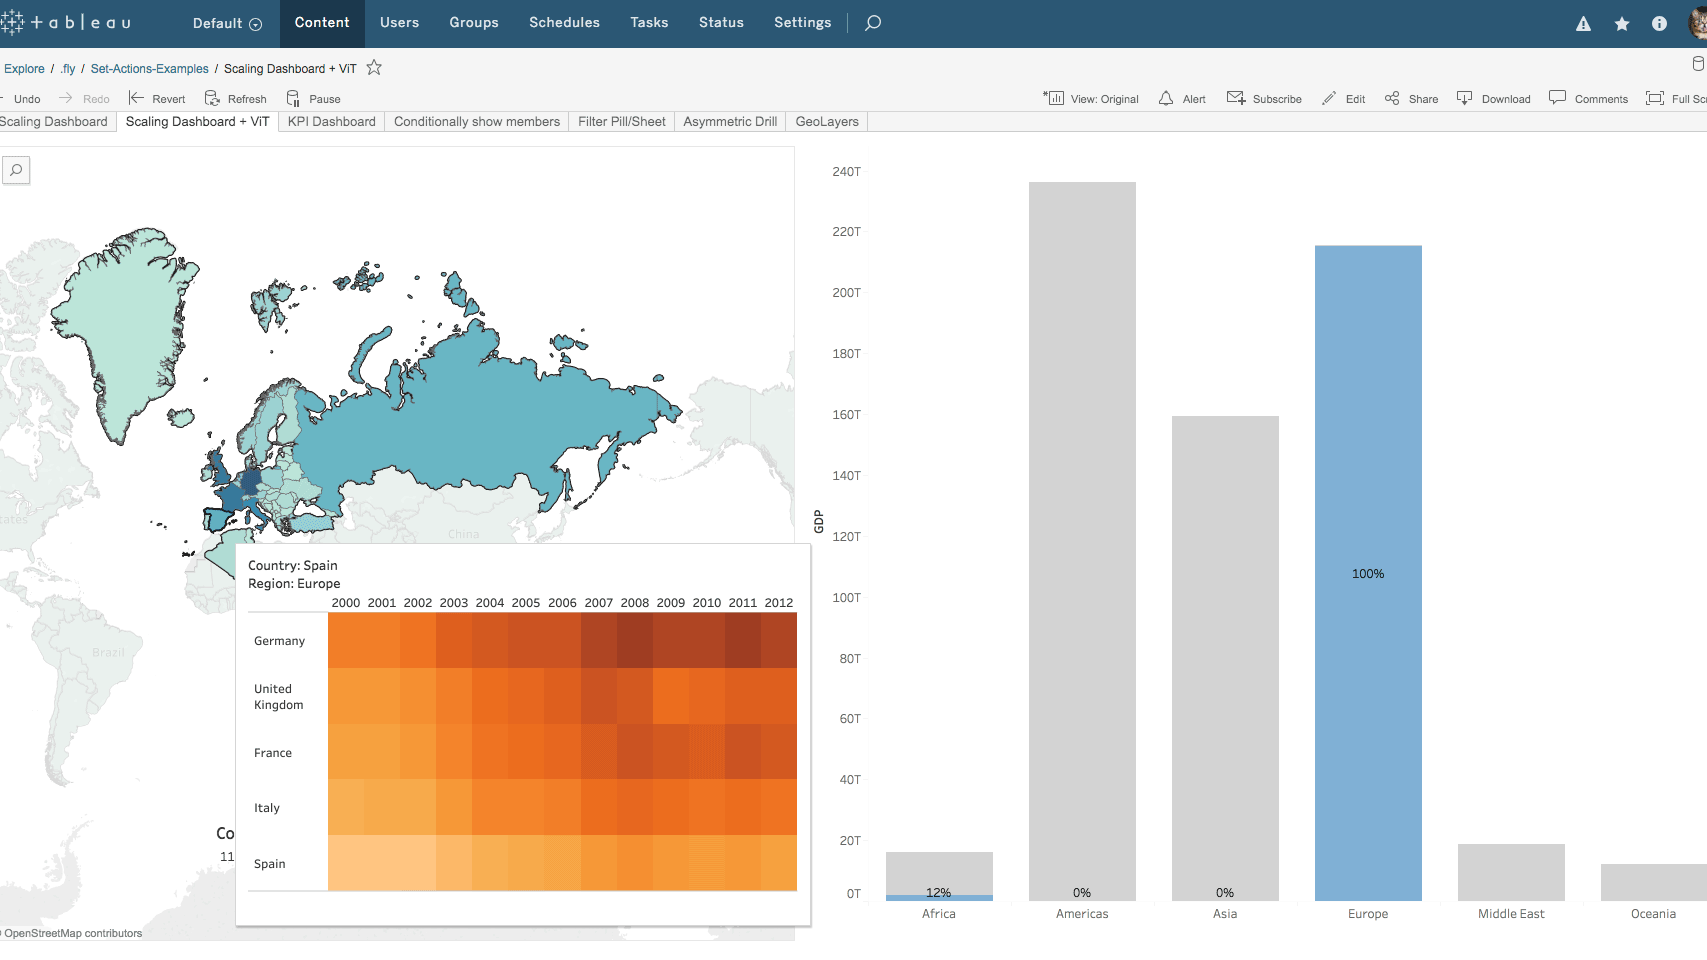
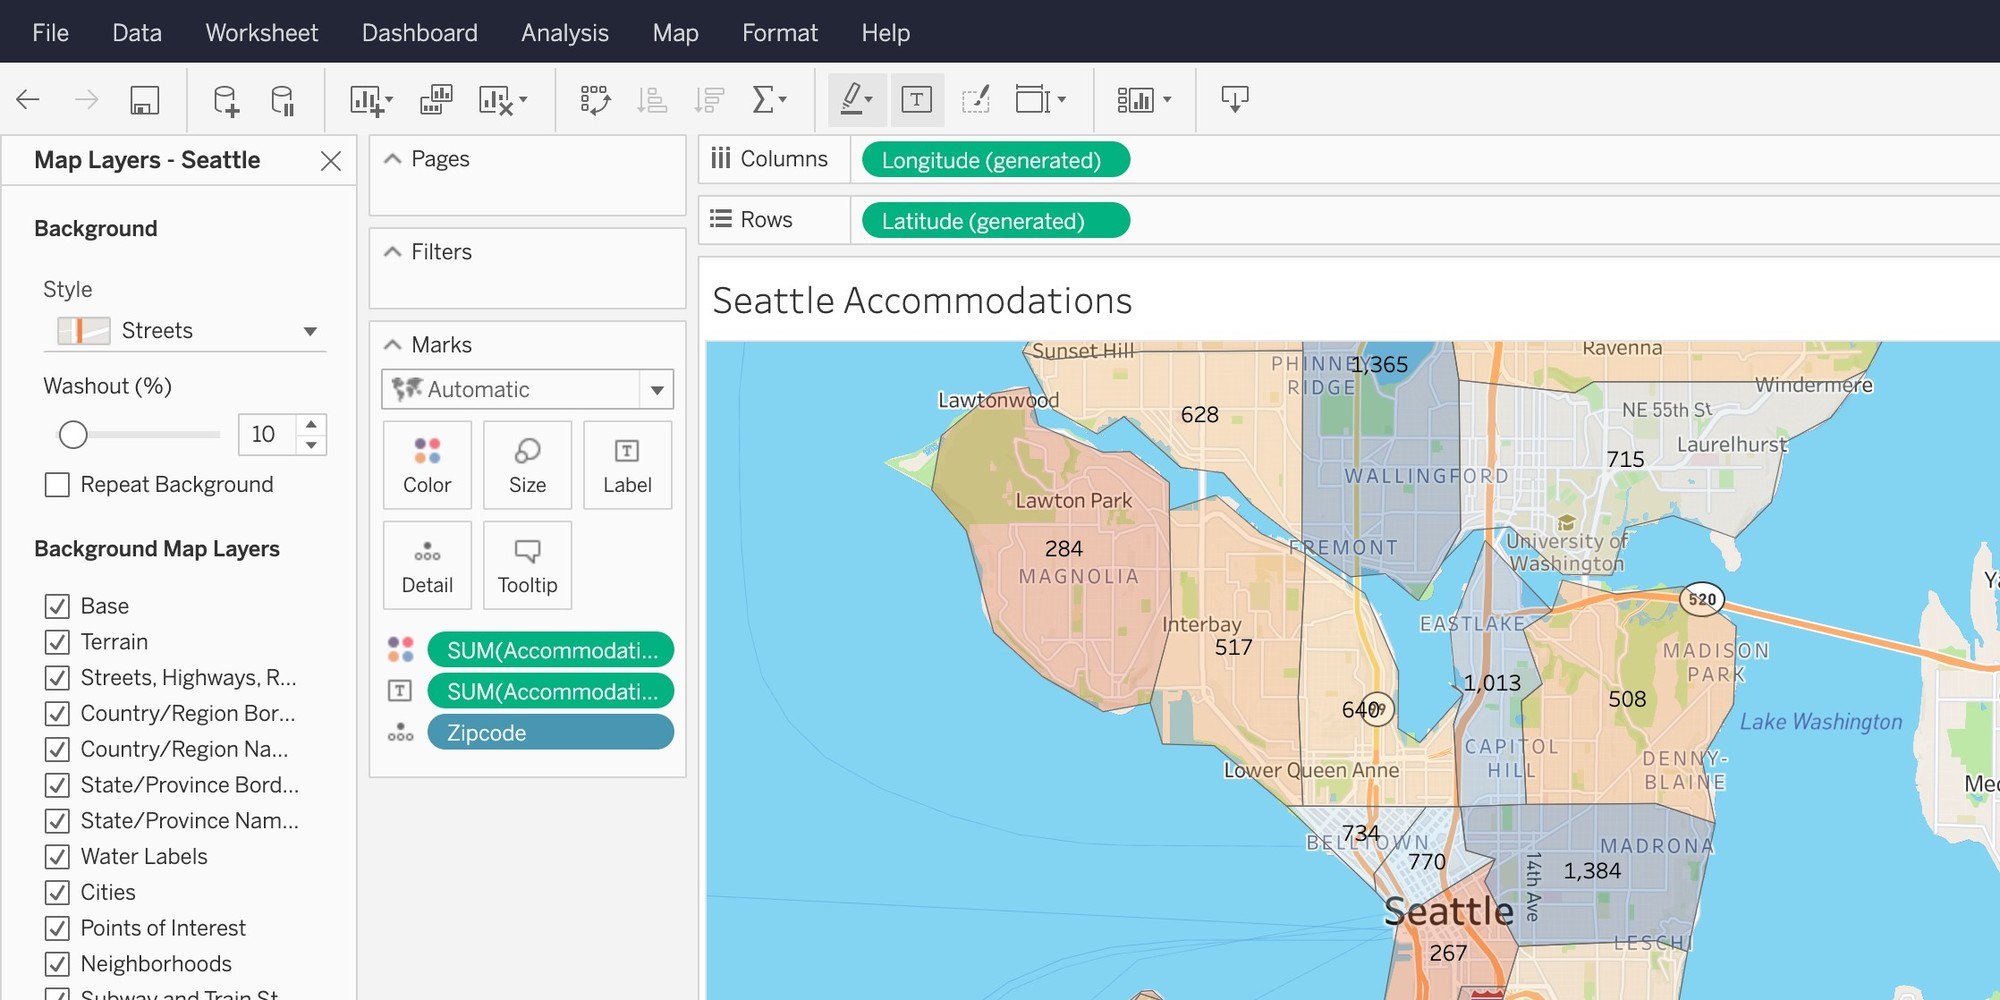
พารามิเตอร์เชิงพื้นที่แบบไดนามิก
พารามิเตอร์เชิงพื้นที่แบบไดนามิกให้คุณสามารถกรองข้อมูลตามวิวพอร์ตแผนที่ ใช้การซูมเพื่อขยายเครื่องหมาย และซิงค์แผนที่หลายรายการอยู่เสมอ ซึ่งทำได้ทั้งหมดโดยไม่ต้องโหลดใหม่
ฟีเจอร์นี้จะจัดการคำขอทั้งหมดหรือบางส่วนบน Salesforce IdeaExchange ดังต่อไปนี้: การซิงโครไนซ์มุมมองแผนที่หลายมุมมอง และจัดการ [1], [2], [3] ด้วยเช่นกัน
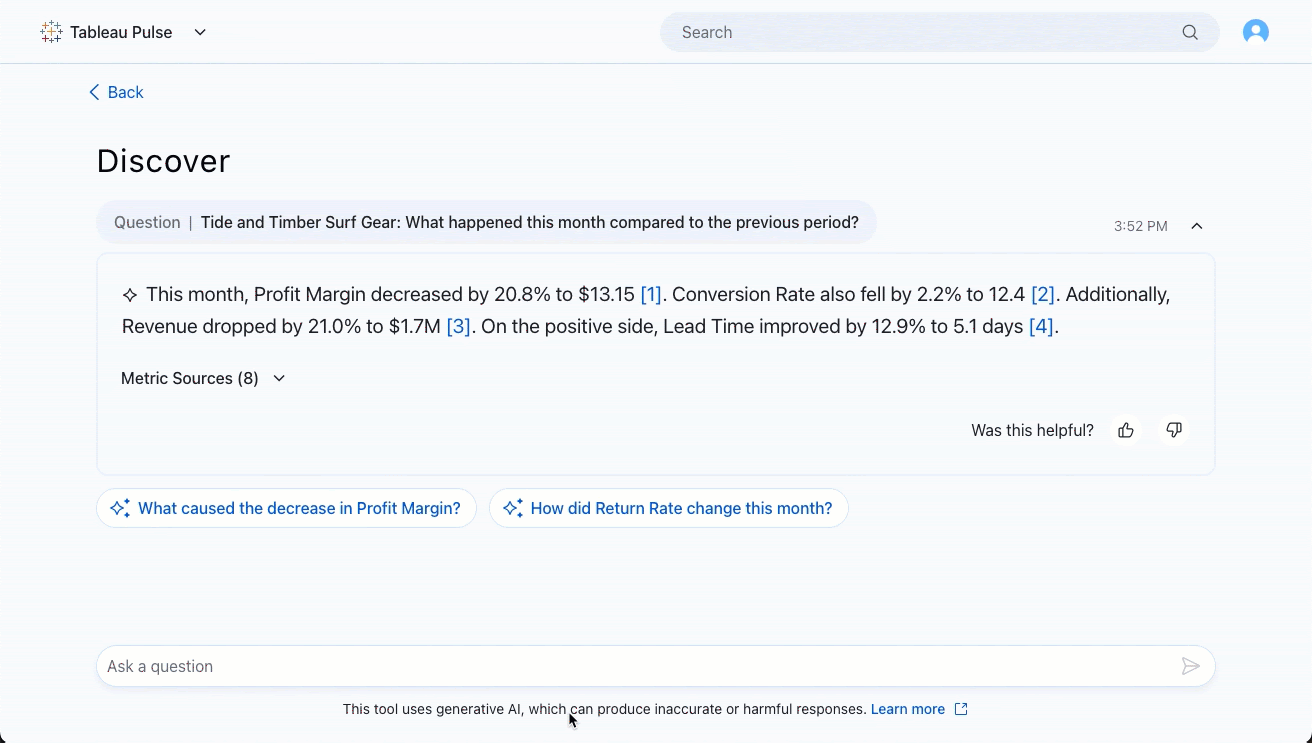
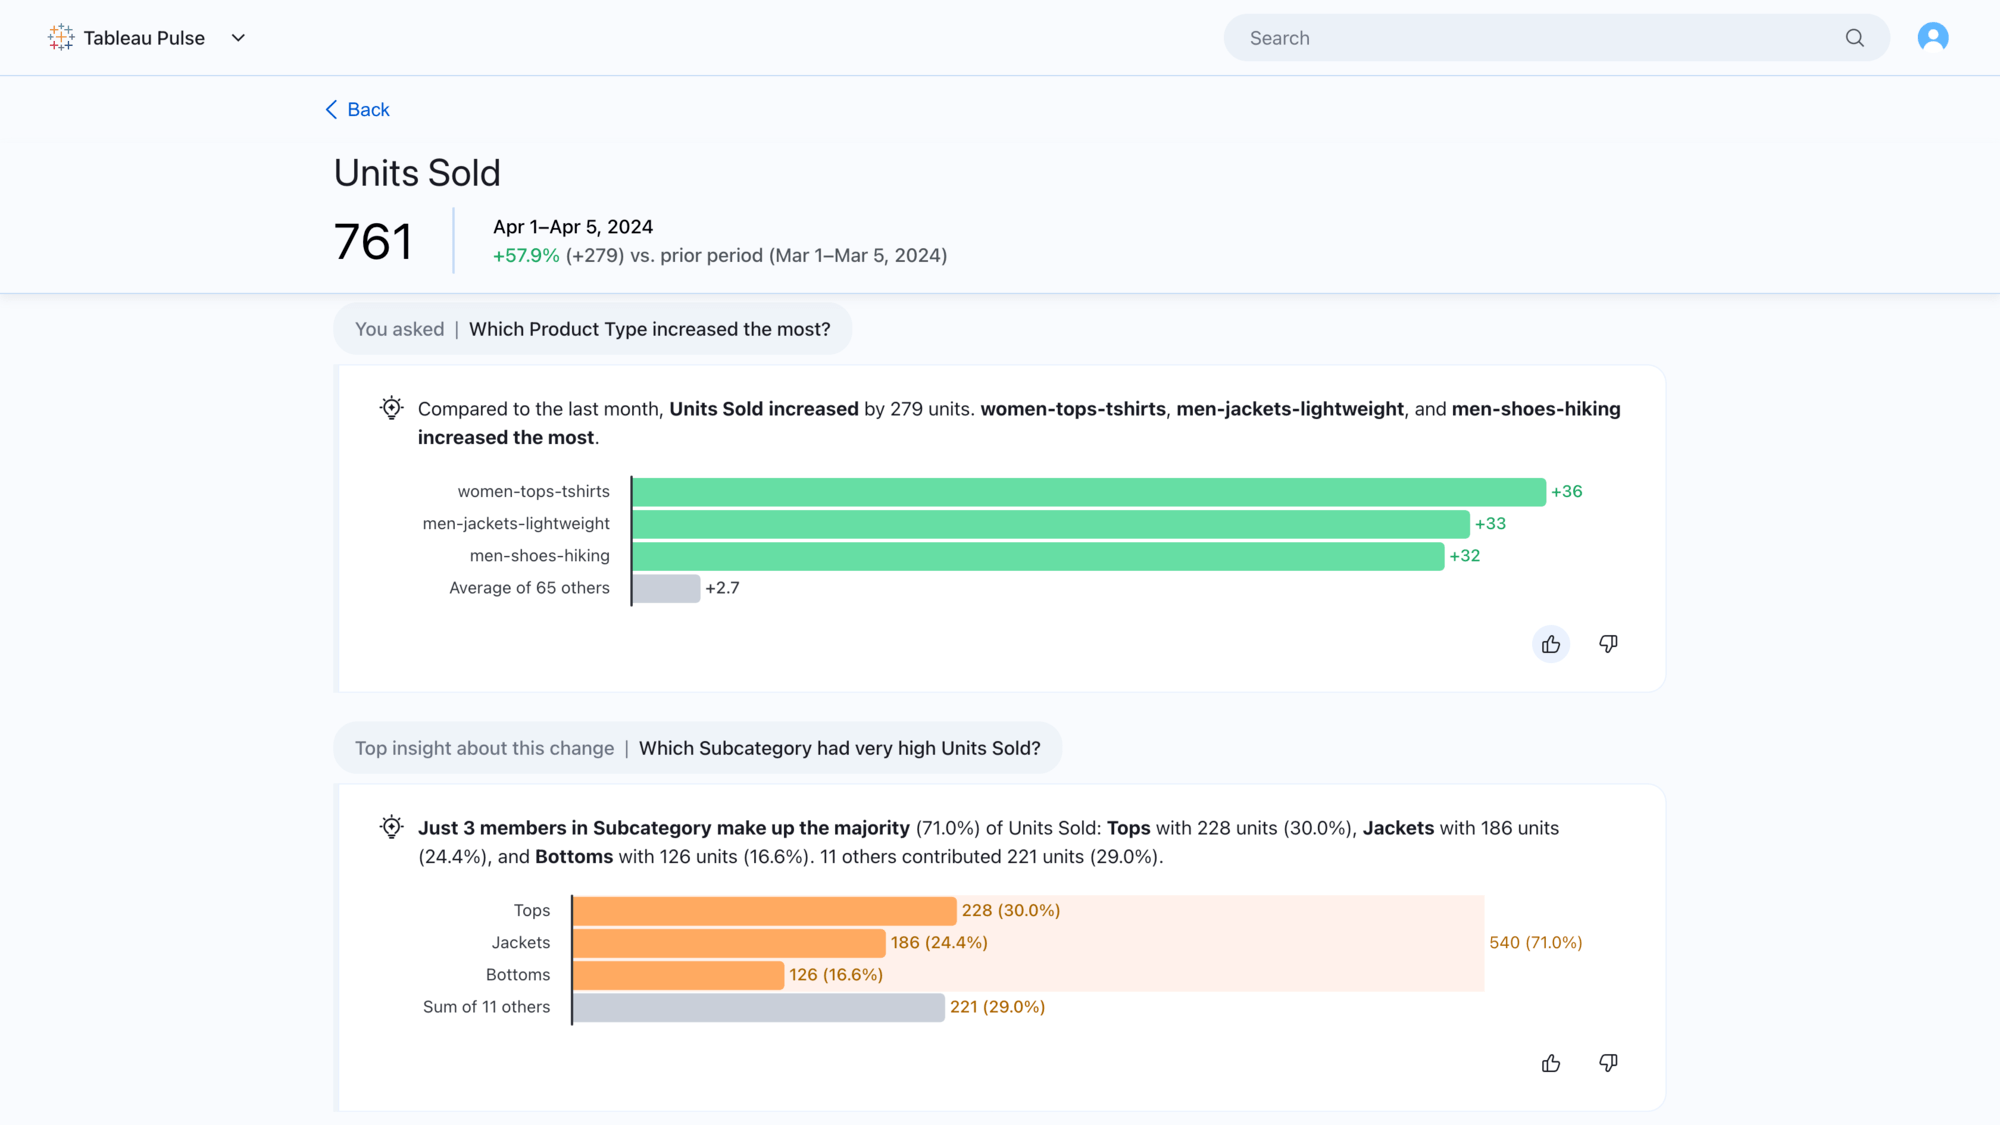
Tableau Pulse: ถามตอบที่ดียิ่งขึ้น - การกรองเมตริกและการเปรียบเทียบ
ปลดล็อกสิ่งที่ขับเคลื่อนประสิทธิภาพทางธุรกิจของคุณผ่านคำถามเชิงสนทนาที่ไม่มีรูปแบบ วิเคราะห์และเปรียบเทียบข้อมูลผ่านมิติต่างๆ ในประสบการณ์เชิงสนทนาทั้งหมด
ฟีเจอร์นี้จะจัดการคำขอทั้งหมดหรือบางส่วนบน Salesforce IdeaExchange ดังต่อไปนี้: อนุญาตการกรองบนเมตริก Pulse
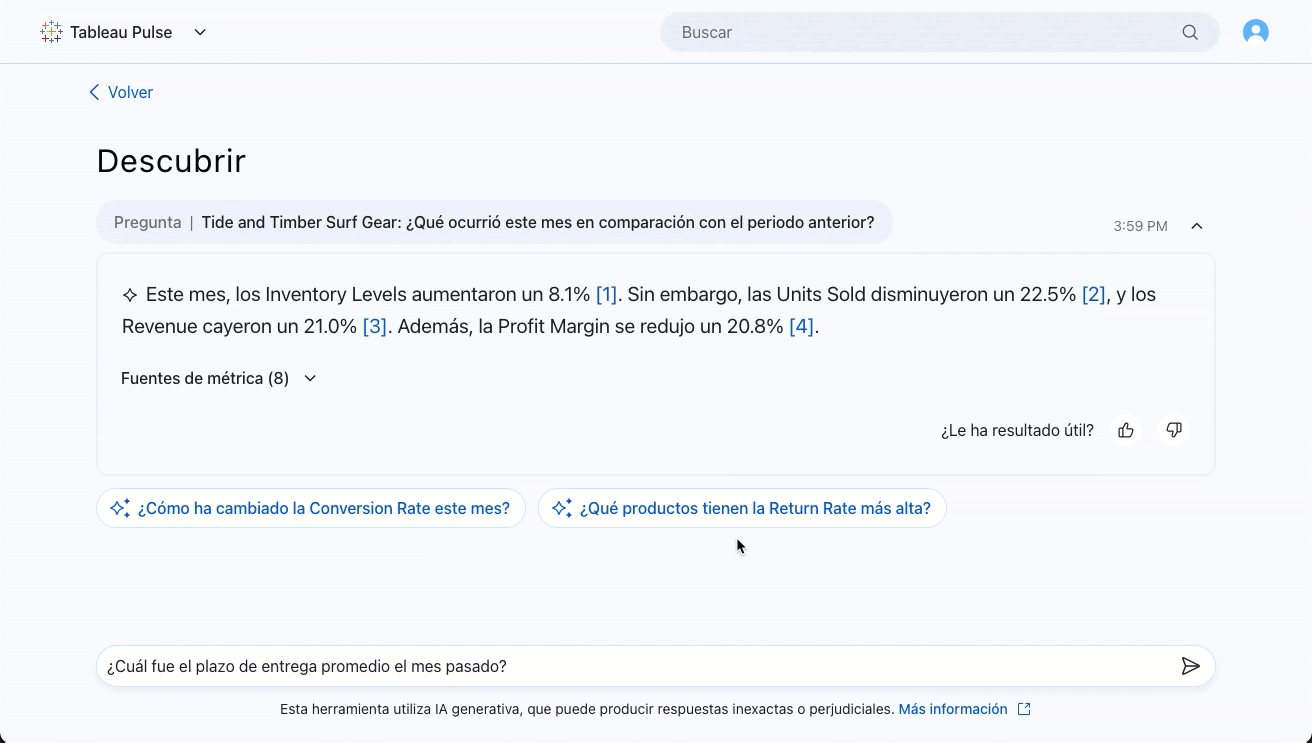
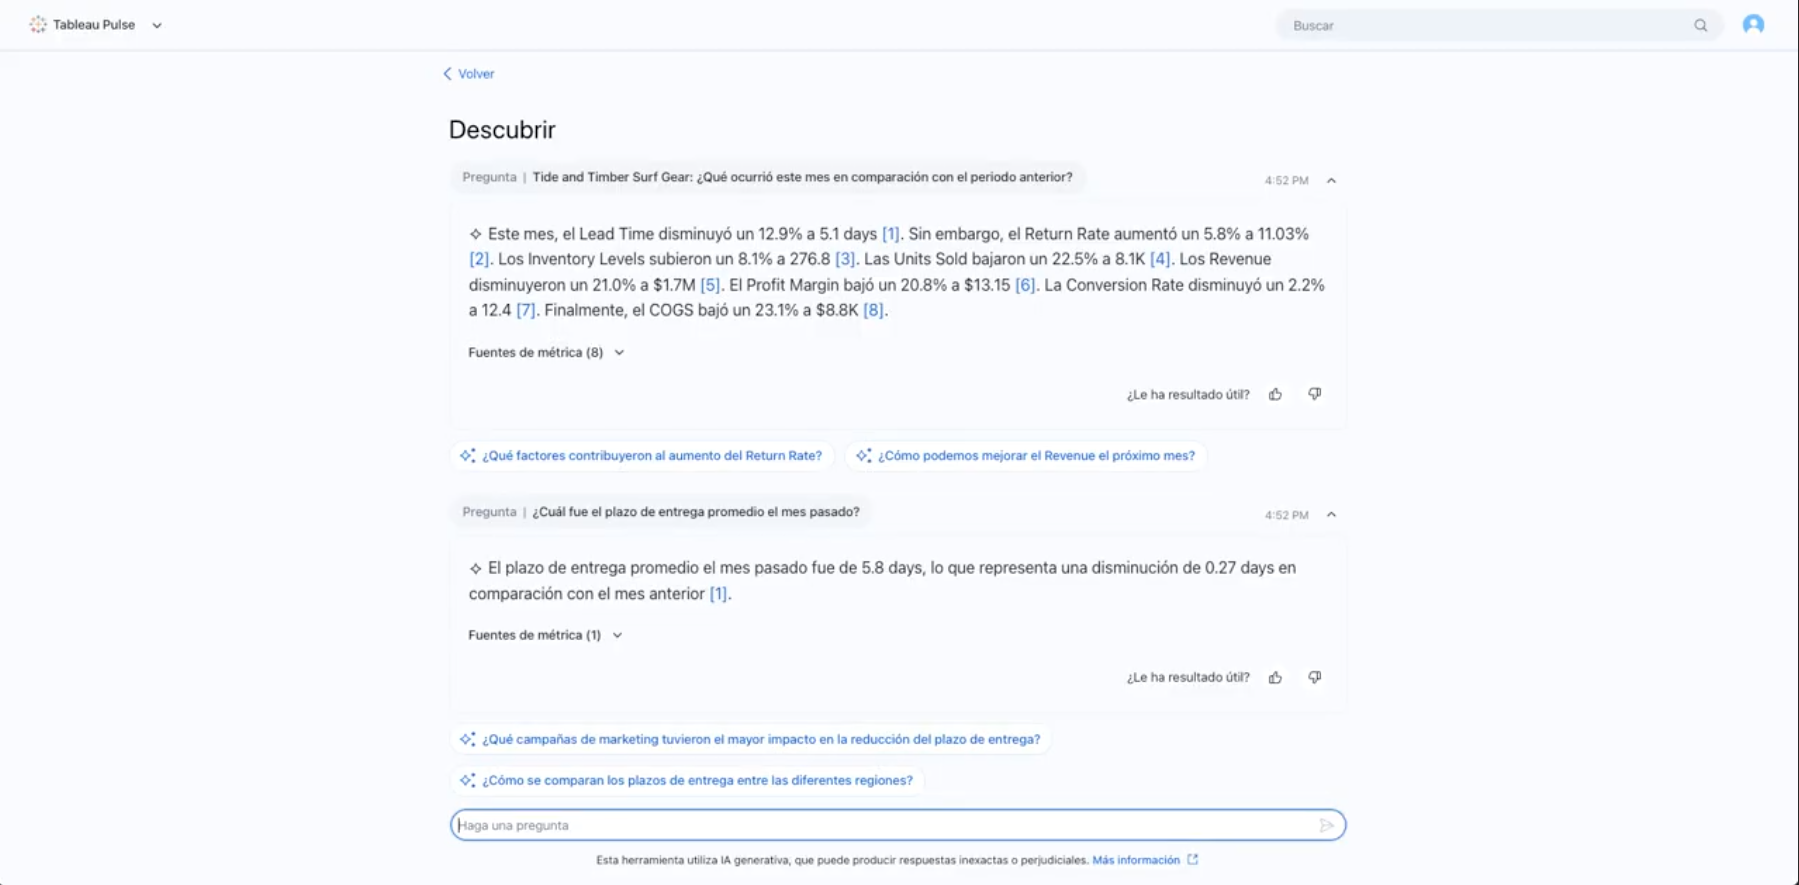
Tableau Pulse: ถามตอบที่ปรับปรุงดีขึ้น - การรองรับหลายภาษา
เพิ่มความสามารถในการปรับขนาดและลดการตีความธุรกิจของคุณอย่างไม่ถูกต้องโดยการถามคำถามในภาษาที่คุณต้องการ สำรวจข้อมูลเชิงลึกในภาษาท้องถิ่นของคุณโดยไม่คำนึงว่าใช้ภาษาใดในข้อมูลบริษัทหรือการตั้งค่าไซต์
ฟีเจอร์นี้จะจัดการคำขอทั้งหมดหรือบางส่วนบน Salesforce IdeaExchange ดังต่อไปนี้: สนับสนุน Tableau Pulse สำหรับภาษาอื่นๆ

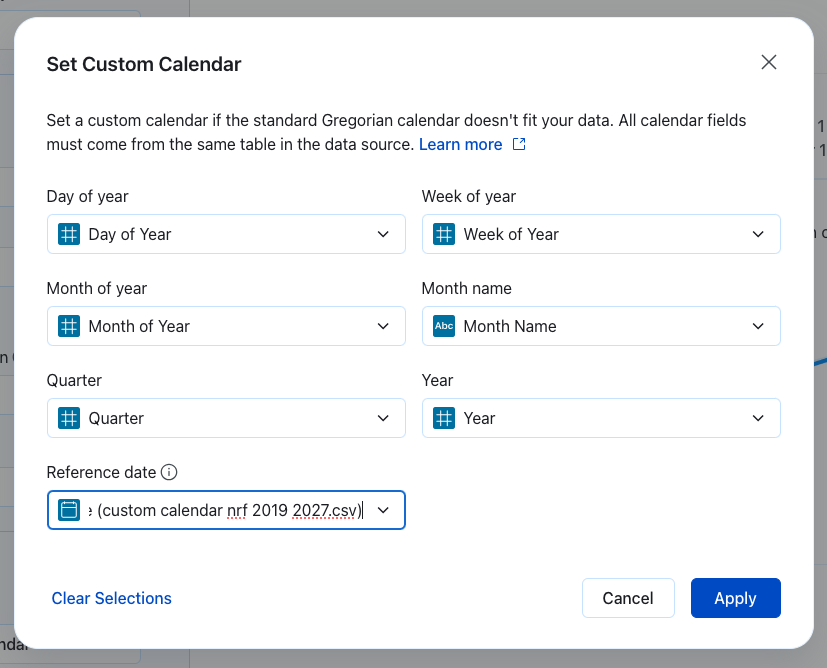
Tableau Pulse: ปฏิทินแบบกำหนดเอง
ตรวจสอบให้แน่ใจว่าวิเคราะห์ข้อมูลที่เกี่ยวข้องโดยปรับแต่งวันที่ในปฏิทิน จัดความต้องการด้านการรายงานทางธุรกิจที่เฉพาะเจาะจงให้ตรงกับนิยามปฏิทินแบบกำหนดเองแทนปฏิทินสุริยคติมาตรฐาน
Tableau 2025.1
Tableau 2025.1 นำเสนอวิธีใหม่ๆ ในการปรับปรุงการวิเคราะห์ของคุณด้วยโซลูชันที่ขับเคลื่อนด้วย AI และให้คุณได้ทดลองใช้รุ่นในอนาคตก่อนใคร ไฮไลท์รวมถึงการสนับสนุนหลายภาษาของ Tableau Agent, การเชื่อมต่อส่วนตัวสำหรับ Tableau Cloud, ไซต์ทดลองใช้รุ่นของ Tableau Cloud และอีกมากมาย
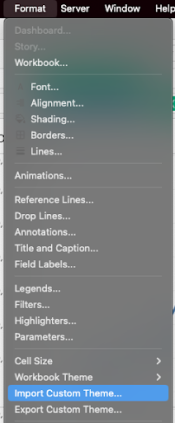
ธีมที่กำหนดเอง
ตรวจสอบให้แน่ใจว่ามีการจัดรูปแบบที่สอดคล้องกันและทำซ้ำได้ในทุกเวิร์กบุ๊กของคุณ สร้างธีมเพียงครั้งเดียวและนำมาใช้ใหม่เมื่อสร้างเวิร์กบุ๊กใหม่หรือนำไปใช้กับเวิร์กบุ๊กที่มีอยู่เพื่ออัปเดตอย่างรวดเร็ว ธีมแบบกำหนดเองที่สร้างขึ้นใหม่จะถูกนำไปใช้เมื่อมีการเผยแพร่ไปยัง Tableau Cloud และ Tableau Server คุณสามารถใช้เวิร์กบุ๊กที่มีอยู่เป็นเทมเพลตและ "ส่งออก" รูปแบบเป็นธีมได้ จากนั้นนำธีมแบบกำหนดเองนั้นไปใช้กับเวิร์กบุ๊กอื่น ฟังก์ชันการทำงานใหม่นี้มีอยู่ในเมนูรูปแบบใน Tableau Desktop
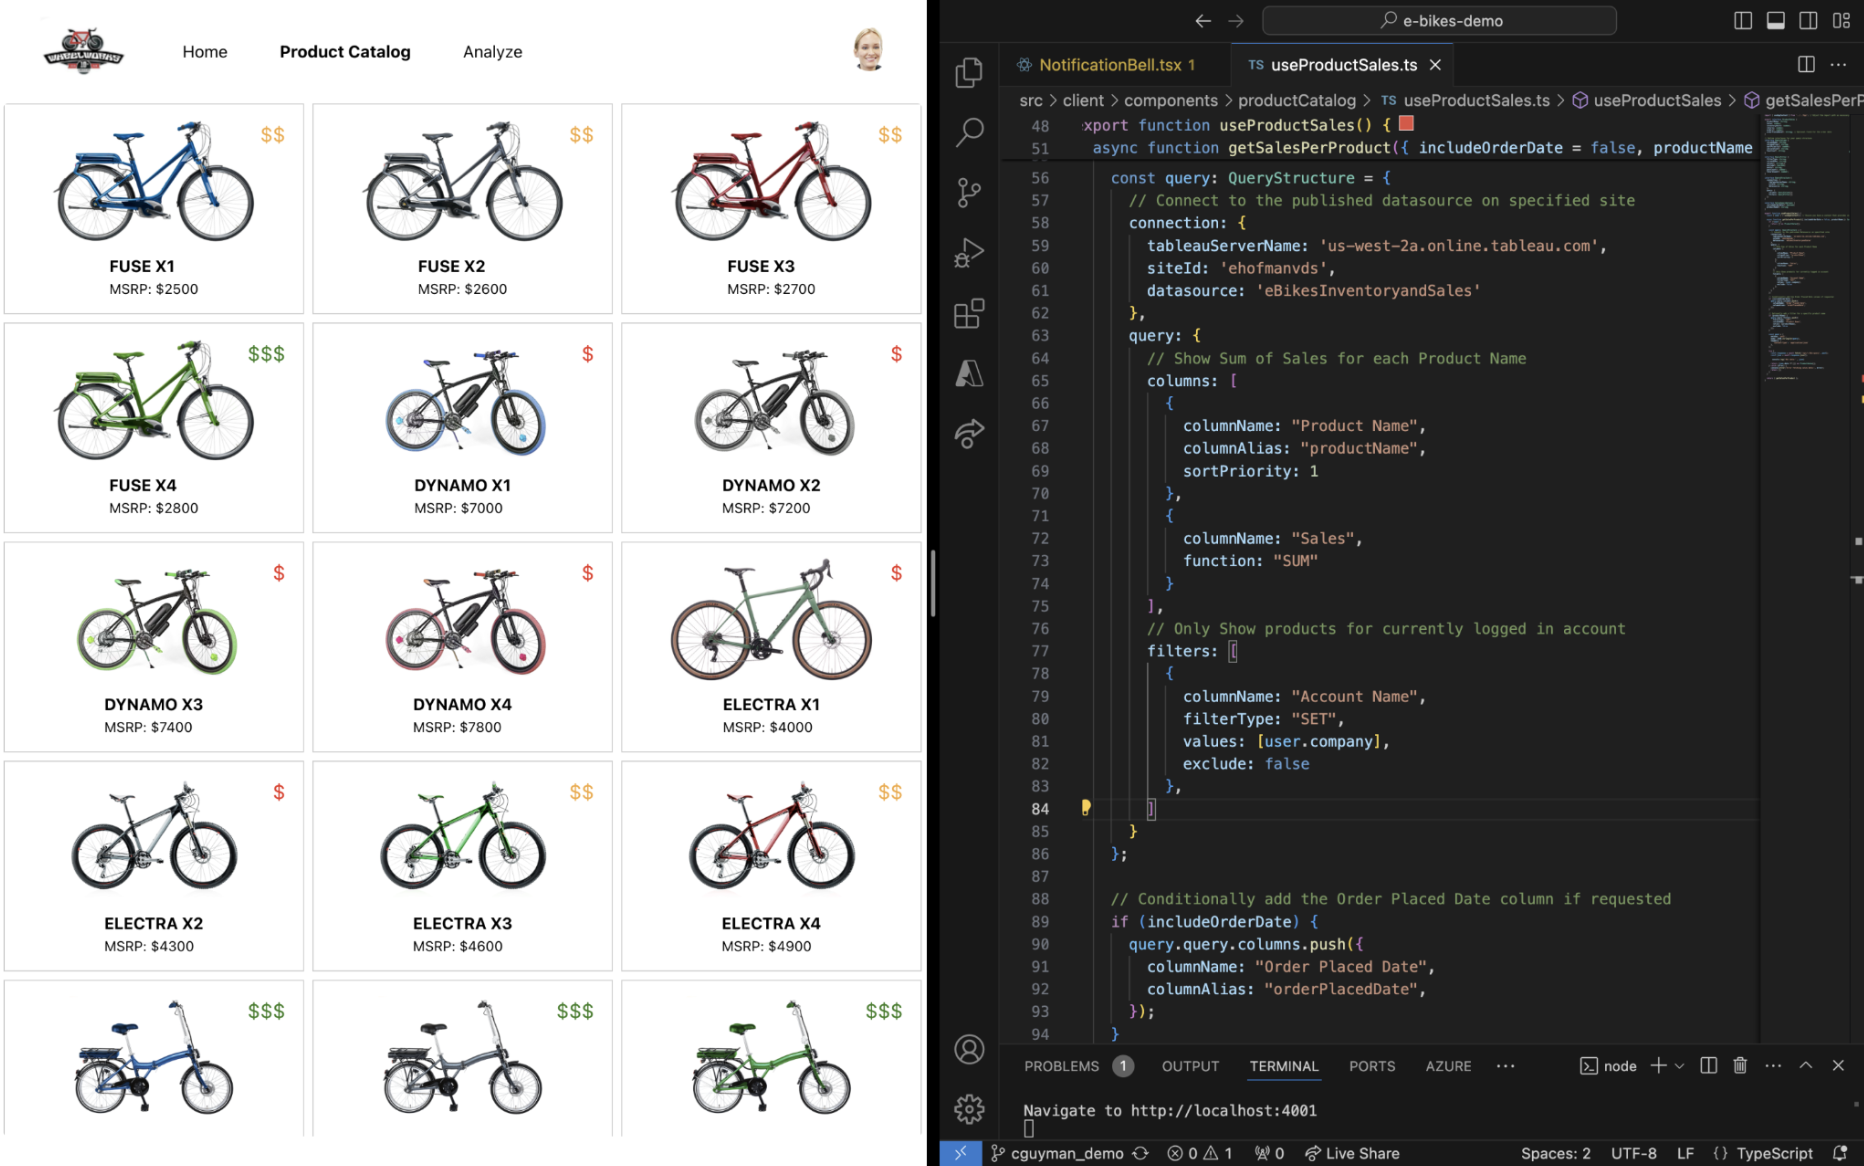
VizQL Data Service API
VizQL Data Service API ช่วยให้ผู้ใช้ Tableau สามารถเข้าถึงข้อมูลของตนเองได้โดยไม่จำเป็นต้องใช้การสร้างภาพข้อมูล ช่วยให้ผู้ใช้สามารถใช้บริการเครื่องมือการวิเคราะห์ของ Tableau เพื่อช่วยปลดล็อกความเป็นไปได้ในการวิเคราะห์แบบใหม่และข้อมูลเชิงลึกโดยใช้ข้อมูลเดียวกันที่สนับสนุนการสร้างภาพข้อมูลของ Tableau
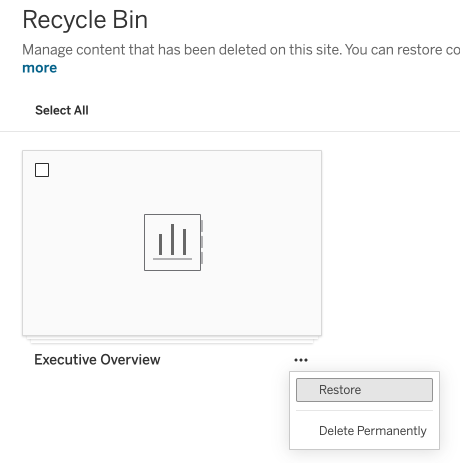
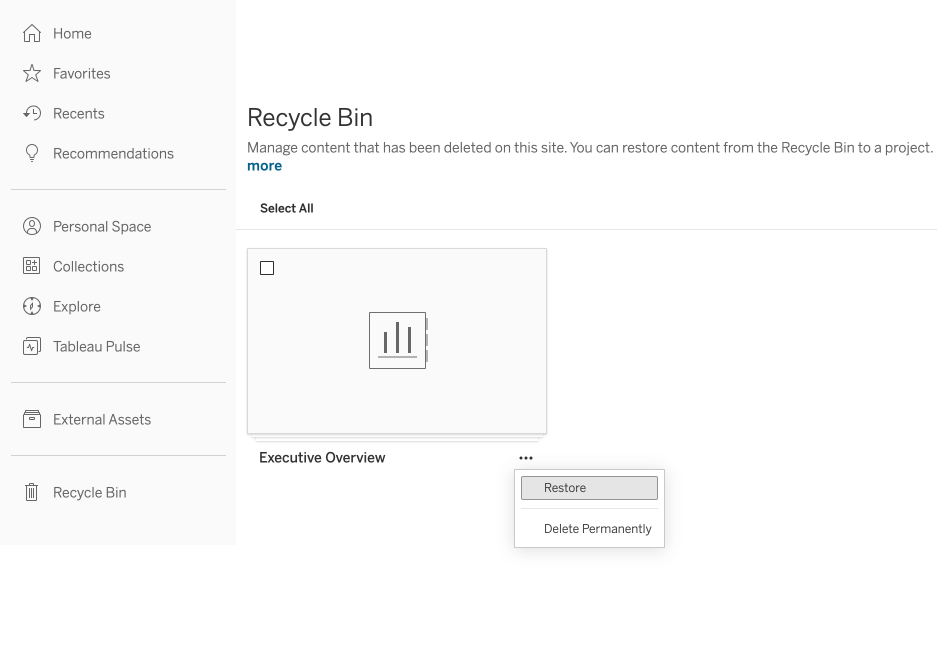
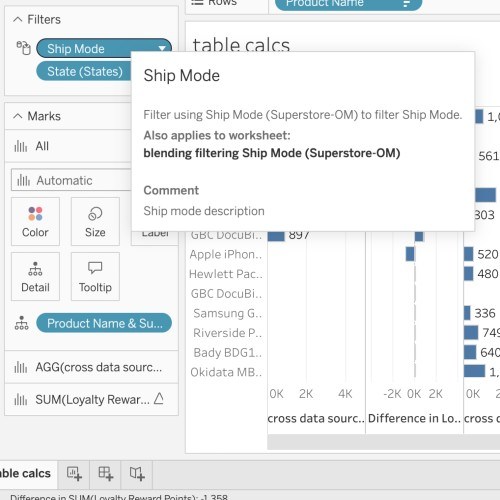
ถังรีไซเคิล
เคยไหมที่ลบอะไรโดยไม่ได้ตั้งใจแล้วอยากเอากลับคืนมา ใครๆ ก็คงเคย ลูกค้า Tableau Server และ Tableau Cloud สามารถเข้าถึงเวิร์กบุ๊ก แหล่งข้อมูล หรือโปรเจกต์ที่ลบไปแล้วทางพื้นที่ถังรีไซเคิลได้เป็นเวลา 30 วัน โดยตัวเลือกนี้จะเปิดใช้งานตามค่าเริ่มต้น ผู้ใช้ทุกคนจะเห็นเนื้อหาที่ตนลบไปแล้ว และผู้ดูแลไซต์จะสามารถดูเนื้อหาที่ผู้ใช้ทั้งหมดบนไซต์ลบได้ คุณสามารถกู้คืนเนื้อหาในถังขยะไปยังตำแหน่งที่ระบุใน Tableau Cloud และ Tableau Server ได้
ฟีเจอร์จากแนวคิดของชุมชน
หมายเหตุ: ฟีเจอร์นี้จะถูกปรับใช้สู่ Tableau Cloud ในการอัปเดตเผยแพร่รายสัปดาห์ในช่วงไม่นานหลังจากการเปิดตัวครั้งแรก 2025.1
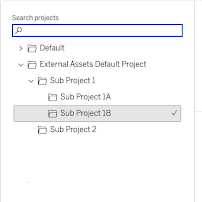
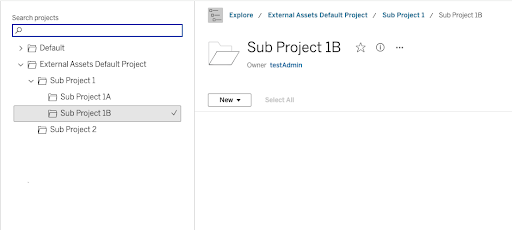
แผนผังโปรเจกต์ใน VizPortal
รับประสบการณ์ที่ดีขึ้นและเร็วขึ้นในการไปยังโปรเจกต์ Tableau ของคุณ มุมมองแผนผังโปรเจกต์เป็นรูปแบบการนำทางที่เป็นทางเลือกซึ่งถูกเพิ่มเข้ากับอินเทอร์เฟซ Vizportal มุมมองนี้เปิดใช้งานตามค่าเริ่มต้น ดังนั้นผู้ใช้ที่มีโปรเจกต์จำนวนมากซ้อนกันหลายระดับสามารถเรียกดูโปรเจกต์ของตนใน Tableau Cloud, Tableau Server, Tableau Desktop และ Tableau Public ได้อย่างง่ายดาย
ฟีเจอร์จากแนวคิดของชุมชน
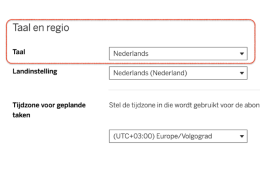
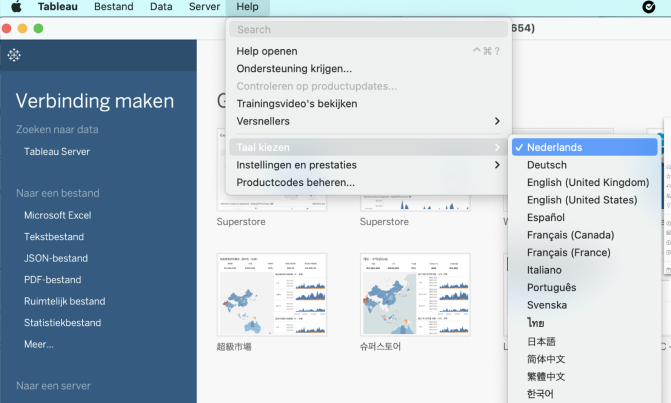
สนับสนุนภาษาดัตช์
ผู้ใช้ในภูมิภาคที่พูดภาษาดัตช์และใช้งาน Tableau ในภาษาของตนเอง เพียงไปที่เมนูความช่วยเหลือ แล้วเลือกการตั้งค่าภาษาสำหรับเดสก์ท็อป - การตั้งค่าบัญชีของฉัน การตั้งค่าภาษาและภูมิภาคสำหรับ Tableau Cloud และ Server เพื่อไปที่ส่วนต่างๆ ของผลิตภัณฑ์ Tableau และหน้าความช่วยเหลือในภาษาดัตช์!
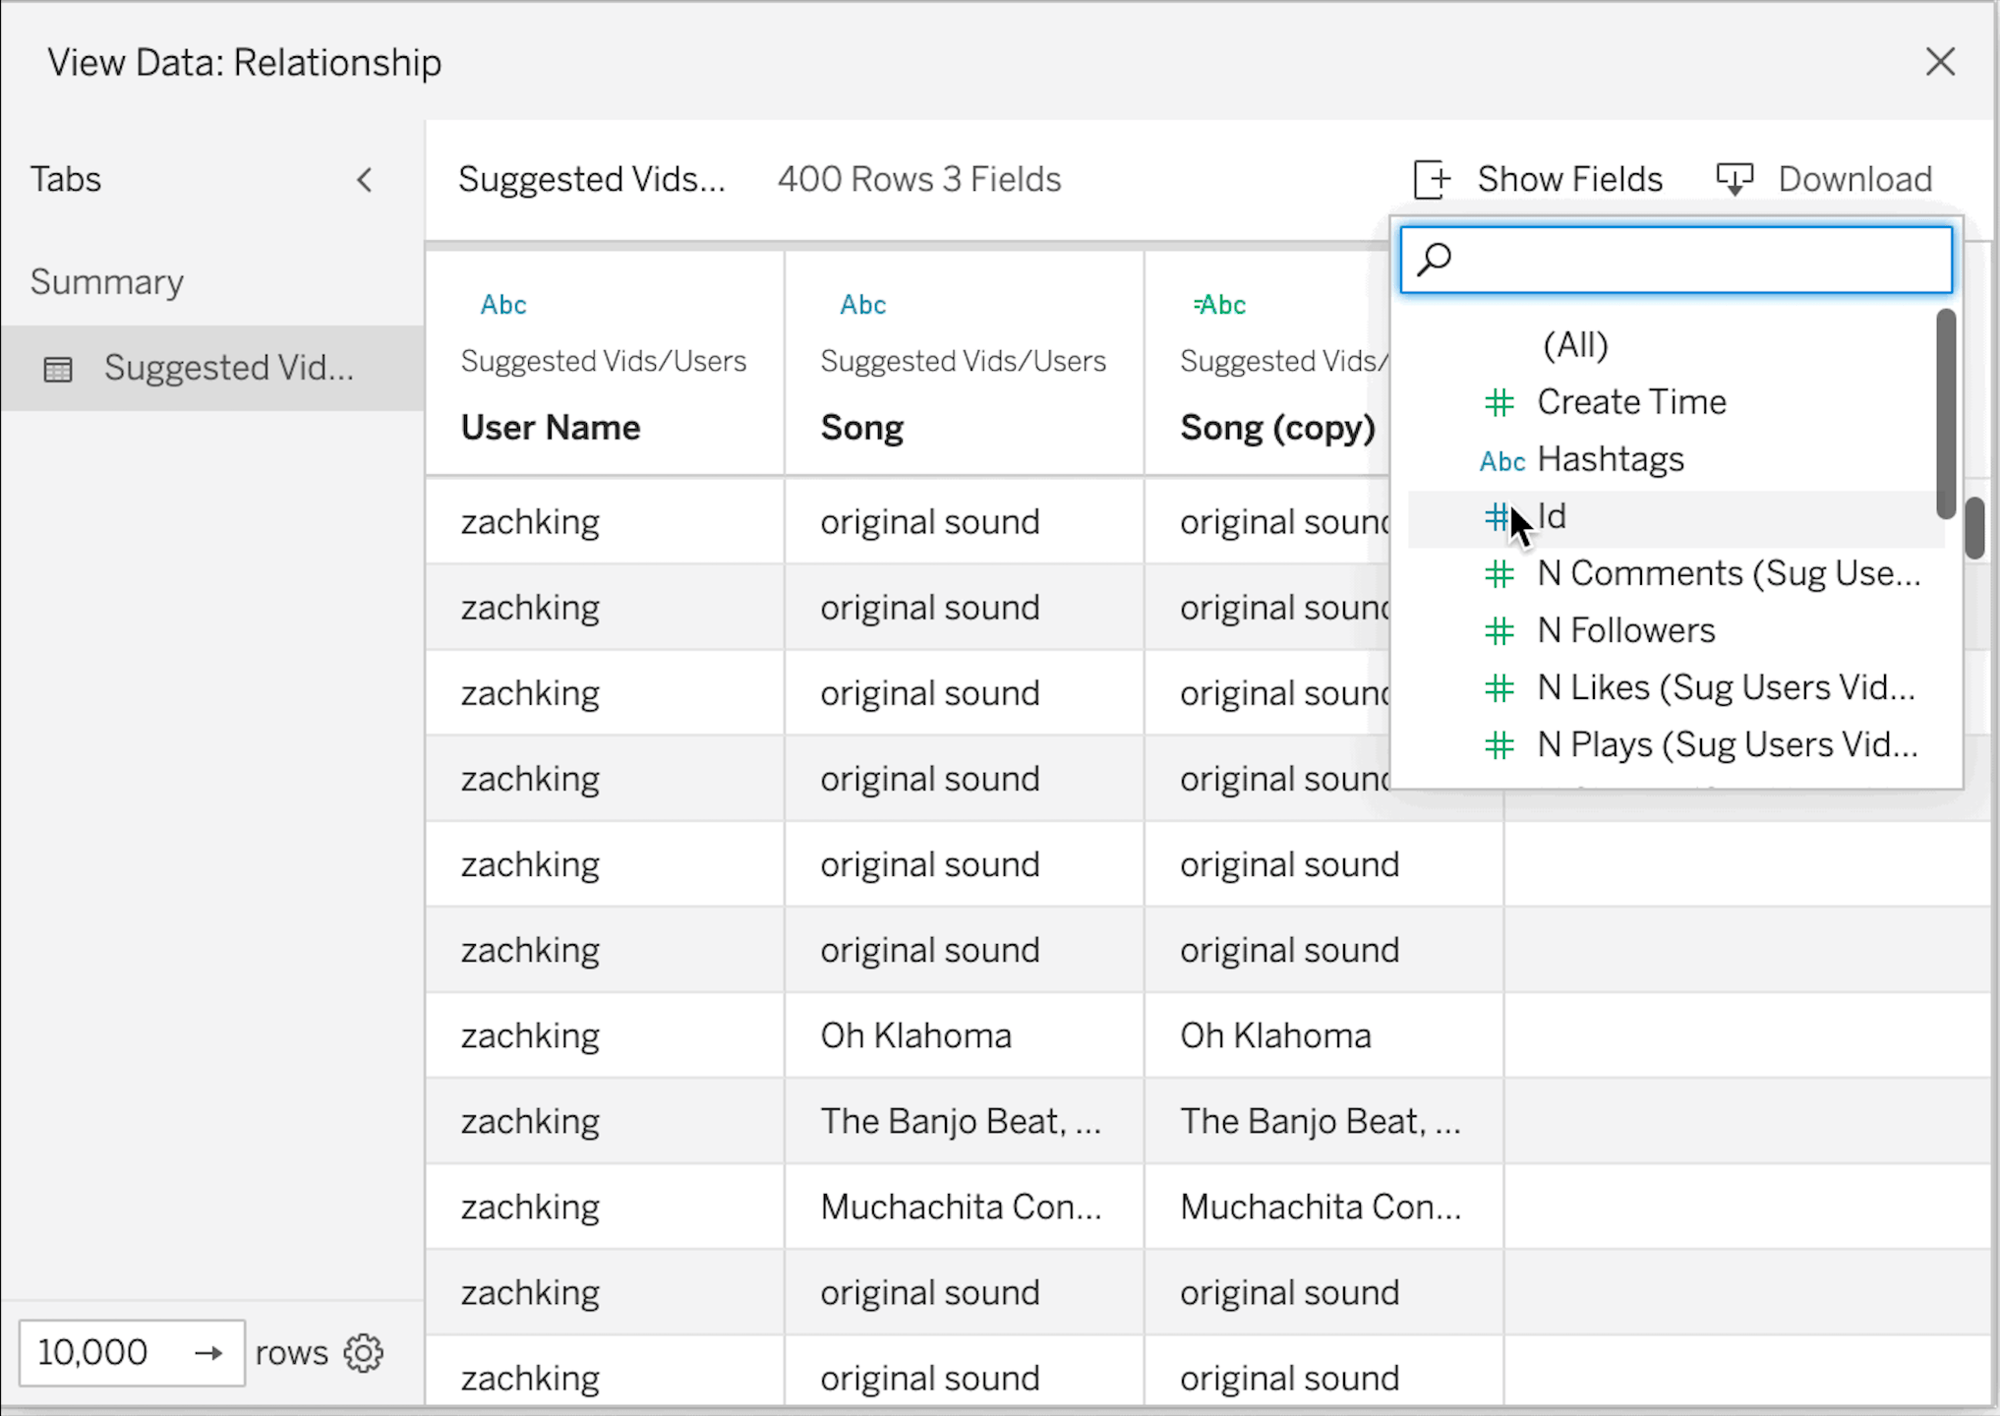
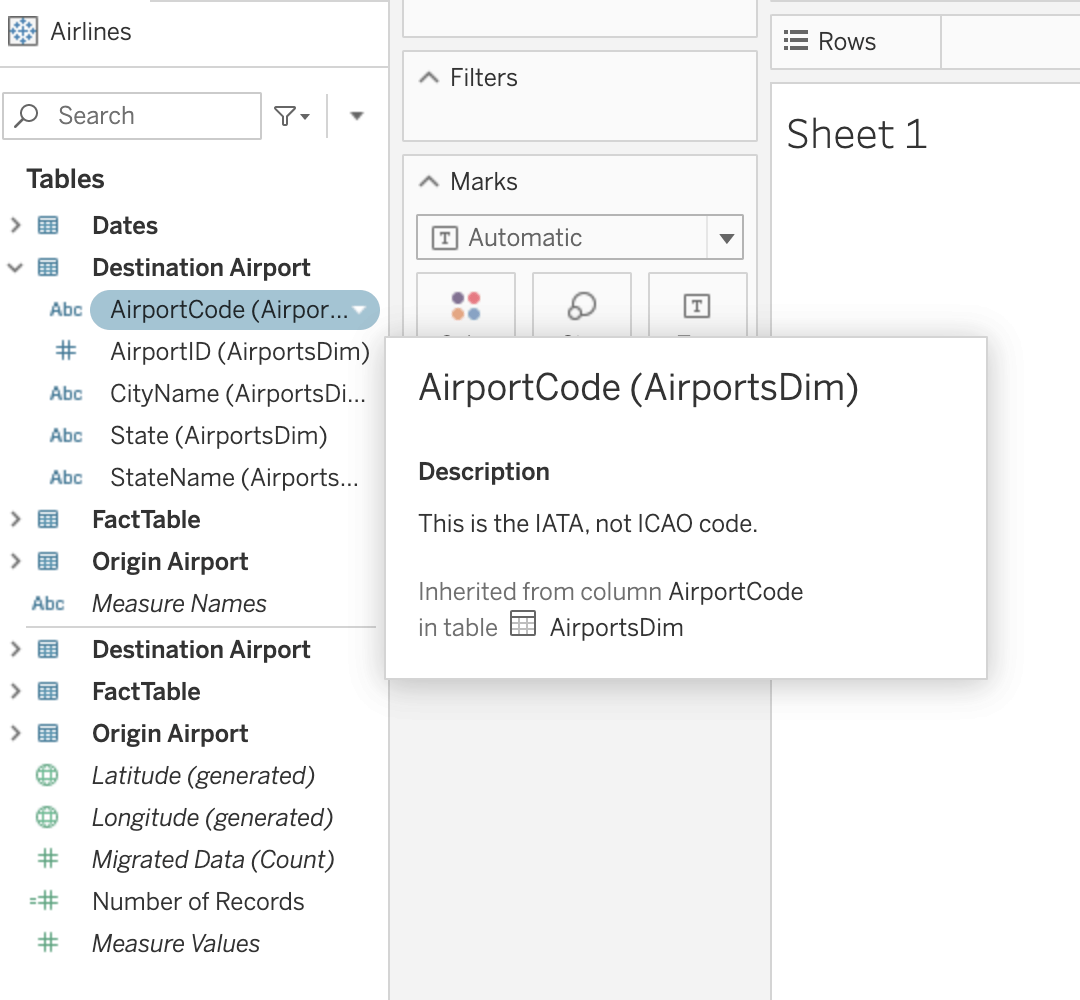
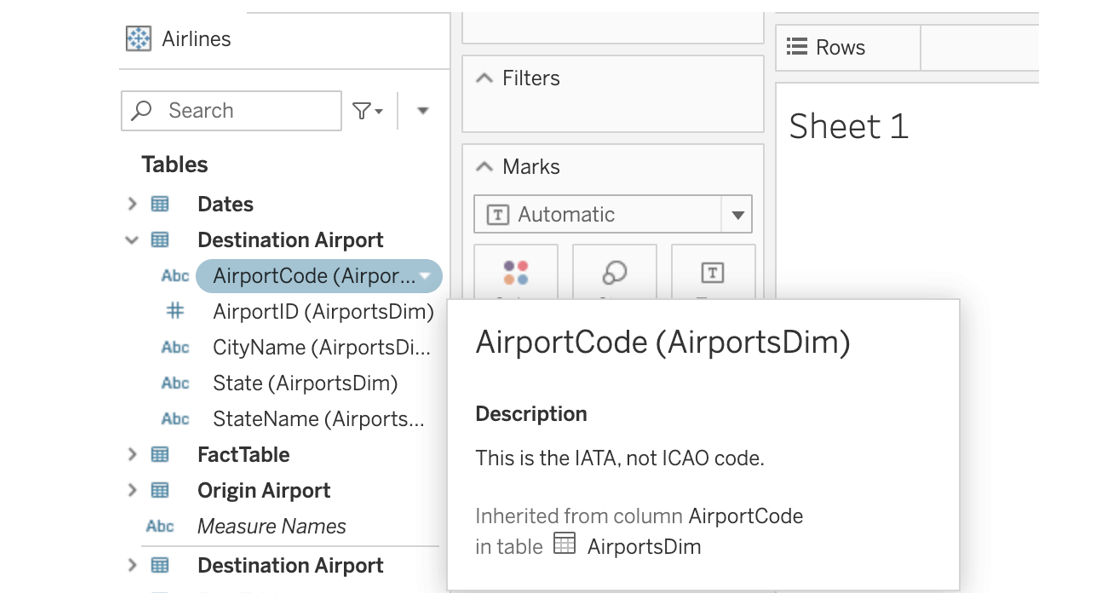
การเข้าถึงโมเดลข้อมูล
การเข้าถึงโมเดลข้อมูลช่วยให้ผู้ใช้ทุกคนสามารถนำทางโมเดลข้อมูลความสัมพันธ์ของ Tableau ได้อย่างง่ายดายโดยใช้การควบคุมด้วยแป้นพิมพ์และโปรแกรมอ่านหน้าจอ นักวิเคราะห์สามารถย้ายไปมาระหว่างตารางและความสัมพันธ์เพื่อทำความเข้าใจได้ดีขึ้นว่าข้อมูลเชื่อมโยงกันอย่างไร ทำให้ทุกคนสามารถสำรวจและวิเคราะห์ข้อมูลได้อย่างมีประสิทธิภาพ
Tableau 2024.3
Tableau 2024.3 เสนอวิธีใหม่ๆ ในการแสดงข้อมูลเป็นภาพและทำให้องค์กรบริหารจัดการด้านการวิเคราะห์ในปริมาณมากได้ง่ายขึ้น ไฮไลต์เด่นรวมถึง Tableau Cloud Manager, ส่วนขยายการแสดงเป็นภาพสำหรับตาราง, พารามิเตอร์เชิงพื้นที่, แอป Tableau Cloud สำหรับ Microsoft Teams และอีกมากมาย
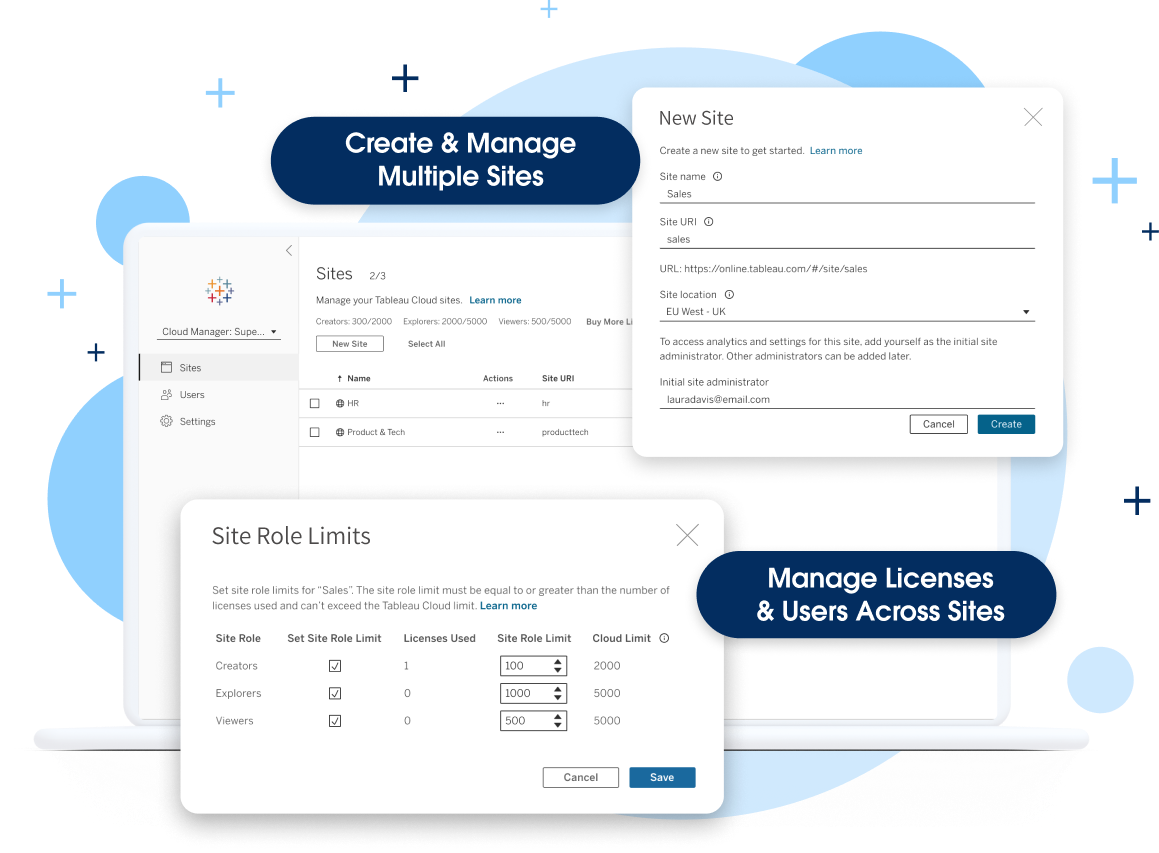
Tableau Cloud Manager
Tableau Cloud Manager ช่วยให้ผู้ดูแลระบบสามารถสร้างและจัดการไซต์ Tableau หลายแห่งในภูมิภาคที่เลือกได้ ผู้ดูแลระบบสามารถจัดการใบอนุญาตและผู้ใช้ข้ามไซต์ได้โดยไม่จำเป็นต้องออกใบอนุญาตผู้ใช้รายเดียวหลายครั้ง ซึ่งจะช่วยลดความยุ่งยากในการขยายและการจัดการสภาพแวดล้อมการวิเคราะห์บนคลาวด์ พร้อมทั้งช่วยตรวจสอบให้แน่ใจว่าจะเป็นไปตามข้อกำหนดด้านการจัดเก็บข้อมูลและมีการปฏิบัติตามการกำกับดูแล
หมายเหตุ: คุณสมบัตินี้จะทยอยปรับใช้ ผู้ดูแลระบบจะได้รับอีเมลล่วงหน้าสองสัปดาห์ก่อนการปรับใช้ฟีเจอร์นี้กับไซต์ที่ดูแล
ส่วนขยายการแสดงเป็นภาพสำหรับตาราง
พัฒนาจากการรายงานแบบเดิมไปสู่การวิเคราะห์ด้วยภาพ พร้อมตอบสนองความต้องการในปัจจุบันของผู้ใช้ ตอนนี้ คุณสามารถเพิ่มตารางรายละเอียดและมุมมองแบบตารางลงในแดชบอร์ดสำหรับผู้ใช้ที่ต้องการมุมมองการรายงานแบบดั้งเดิมได้
พารามิเตอร์เชิงพื้นที่
นำประสบการณ์ Tableau แบบเต็มรูปแบบมาสู่ข้อมูลเชิงพื้นที่ด้วยการรองรับข้อมูลเชิงพื้นที่สำหรับพารามิเตอร์ พารามิเตอร์เชิงพื้นที่จะสร้างแดชบอร์ดแบบอินเทอร์แอคทีฟที่สมบูรณ์แบบเพื่อให้ผู้ใช้สามารถถามและตอบคำถามเกี่ยวกับข้อมูลเชิงพื้นที่ได้
แอป Tableau สำหรับ Microsoft Teams
แอป Tableau ใหม่สำหรับ Microsoft Teams จะช่วยให้ผู้ใช้รวมข้อมูลเชิงลึกที่ขับเคลื่อนด้วยข้อมูลเข้ากับกระบวนงานประจำวันได้อย่างง่ายดาย ส่งผลให้การตัดสินใจรวดเร็วขึ้นและมีประสิทธิภาพมากขึ้น การผสานรวมนี้ช่วยให้แชร์ข้อมูลได้แบบเรียลไทม์ ผู้ใช้จึงสามารถแชร์การแสดงภาพข้อมูล แดชบอร์ด และข้อมูลเชิงลึกของ Tableau ได้โดยตรงภายในแชทและการประชุมใน Teams ได้อย่างง่ายดาย
แบบจำลองข้อมูลการแสดงผลสำหรับแหล่งข้อมูลที่เผยแพร่
ดูและทำความเข้าใจว่าตารางในแบบจำลองข้อมูลของคุณเกี่ยวข้องกันอย่างไรในแหล่งข้อมูลที่เผยแพร่ สร้างภาพข้อมูลที่แม่นยำและทำความเข้าใจความสัมพันธ์ระหว่างตารางและฟิลด์ต่างๆ ใน Tableau เพียงแค่คลิกแผงแหล่งข้อมูลในเวิร์กบุ๊กของ Tableau
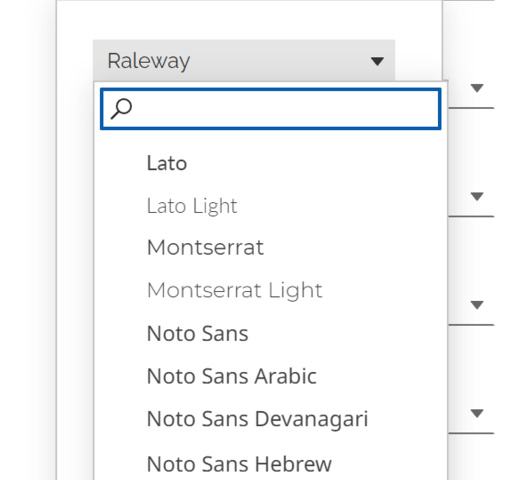
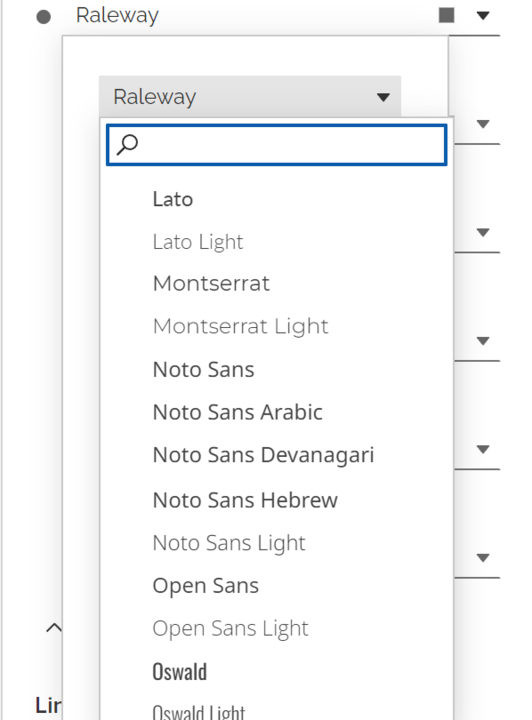
การสนับสนุนแบบอักษรของ Google
ดูตัวเลือกแบบอักษรเพิ่มเติมใน Tableau Cloud ด้วยการรองรับชุดแบบอักษร Google Tableau Cloud รองรับ Lato, Montserrat, Noto Sans, Noto Sans Hebrew, Noto Sans Arabic, Noto Sans Devanagari, Open Sans, Oswald, Poppins และ Raleway แล้ว
Tableau 2024.2
Tableau 2024.2 มีขีดความสามารถใหม่ๆ ที่ช่วยคุณสร้างสรรค์ผลงานด้วยข้อมูลในรูปแบบใหม่ๆ และสำรวจข้อมูลด้วยความช่วยเหลือจาก AI ใน Tableau ไฮไลท์ ได้แก่ Tableau Agent, การปรับปรุง Tableau Pulse, ความสัมพันธ์แบบหลายข้อเท็จจริง, ส่วนขยายการแสดงเป็นภาพ และอีกมากมาย
Einstein Copilot สำหรับ Tableau: การเขียนเว็บ
Einstein Copilot สำหรับ Tableau ช่วยให้ทุกคนตั้งแต่นักวิเคราะห์มือใหม่ไปจนถึงผู้เชี่ยวชาญด้านข้อมูลที่มีประสบการณ์ สามารถสำรวจข้อมูลได้เร็วขึ้นและราบรื่นกว่าที่เคย นี่คือผู้ช่วย AI ที่จะมาเสริมประสบการณ์ใช้งาน Tableau โดยที่คุณสามารถใช้พร้อมท์ภาษาธรรมชาติเพื่อสร้างและแก้ไขการแสดงภาพข้อมูลและการคำนวณ อีกทั้งยังแนะนำคำถามเพื่อช่วยให้คุณเริ่มต้นได้เร็วขึ้นด้วย จะเปิดตัวในเดือนสิงหาคม 2024
Einstein Copilot for Tableau: Prep
ด้วย Einstein Copilot for Tableau การเตรียมข้อมูลสำหรับการวิเคราะห์จะรวดเร็วและง่ายดายยิ่งขึ้น Einstein ช่วยลดความซับซ้อนของงานโดยการทำให้ผู้ใช้ทางเทคนิคและไม่ใช่ทางเทคนิคสามารถสร้างผลการคำนวณได้อย่างง่ายดายโดยใช้ภาษาธรรมดา ผู้ใช้สามารถอธิบายถึงการคำนวณได้อย่างง่ายดาย และ Einstein จะประเมินสูตรสำหรับการคำนวณดังกล่าว ช่วยให้คุณสามารถเพิ่มฟิลด์ที่คำนวณอย่างทรงพลังไปที่โฟลว์ Prep ของคุณได้ด้วยการคลิกเพียงครั้งเดียว
Einstein Copilot for Tableau: แคตตาล็อก
เพิ่มประสิทธิภาพการค้นหาข้อมูลและความน่าเชื่อถือด้วยการปรับปรุง Einstein Copilot for Tableau Catalog ผู้ใช้สามารถสร้างคำอธิบายโดยอัตโนมัติสำหรับแหล่งข้อมูล เวิร์กบุ๊ก และตารางต่างๆ เพื่อขจัดความจำเป็นในการจัดทำเอกสารด้วยตนเอง

Tableau Pulse: คอมโพเนนต์ที่ฝัง
คอมโพเนนต์เว็บของ Tableau Pulse มอบความสามารถให้กับคุณในการผสานรวมหน้าการสำรวจข้อมูลเชิงลึกลงในแอปของคุณ ผู้ใช้จะมีตัวเลือกในการเปิดใช้งาน “โหมดการนำเสนอ” เพื่อแสดงเมตริกเดียวบนหน้าเต็มหรือเมตริกหลายรายการในรูปแบบการ์ดที่จัดกลุ่ม
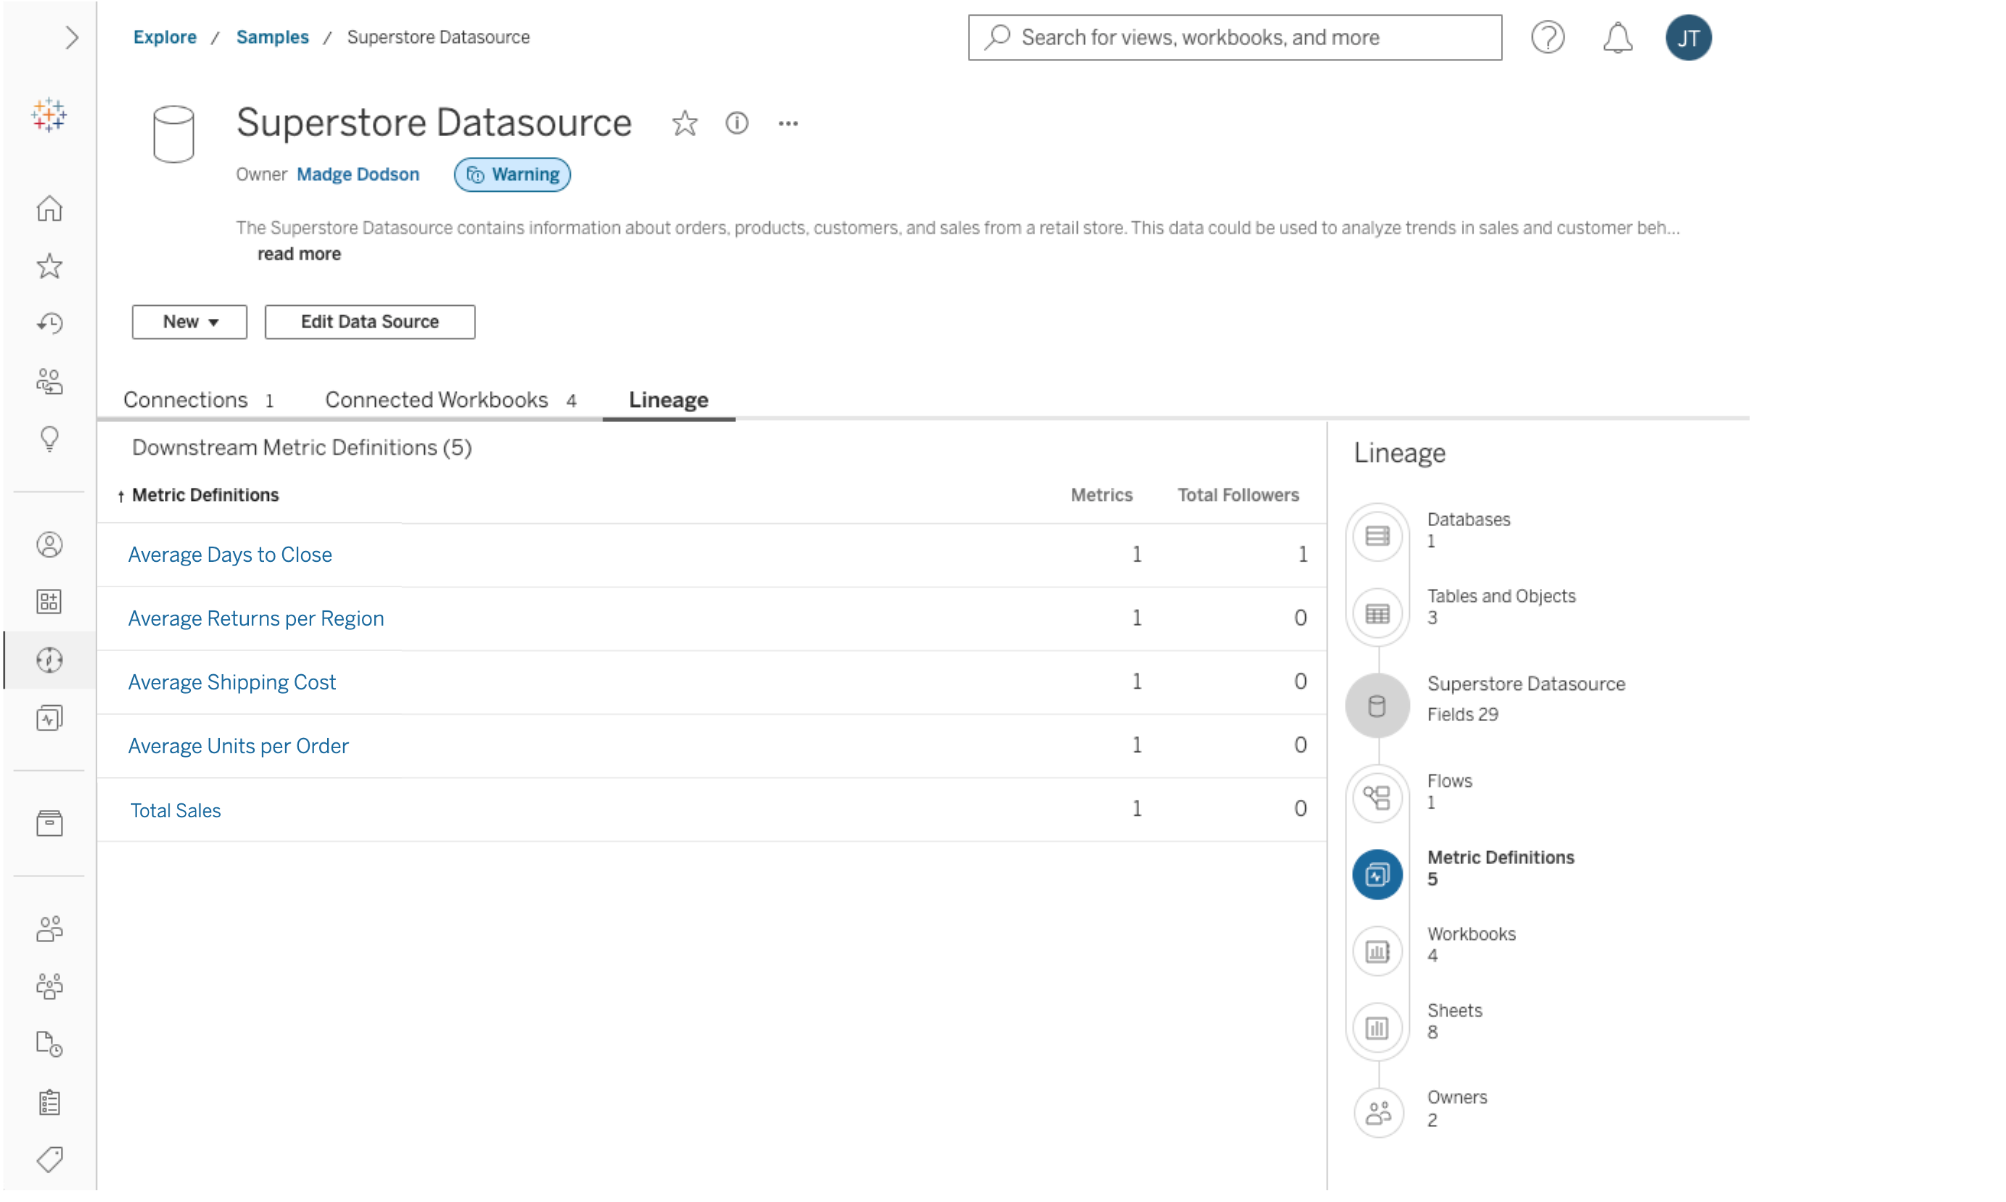
Tableau Pulse: เมตริกในแคตตาล็อก
ทำความเข้าใจจากภาพเกี่ยวกับความสัมพันธ์ของฐานข้อมูลอัปสตรีมและคำจำกัดความของเมตริก ดูว่าเมตริกใดของ Pulse ที่จะได้รับอิทธิพลจากการปรับเปลี่ยนแหล่งข้อมูลที่เผยแพร่ รวมถึงไฟล์อัปสตรีม ตาราง และคอลัมน์ ผู้ดูแลระบบและผู้ดูแลข้อมูลจะมีมุมมองที่ครอบคลุมของผลกระทบต่อฐานข้อมูลเบื้องต้นเมื่อมีการเปลี่ยนแปลงเกิดขึ้น
การวิเคราะห์แบบข้อเท็จจริงหลายรายการ
นักวิเคราะห์สามารถนำชุดข้อมูลที่แตกต่างกันและสร้างความเชื่อมโยงโดยใช้ตารางเดียวกันที่มีมิติต่างๆ ร่วมกัน เช่น ภูมิศาสตร์และเวลา เพื่อให้พวกเขาสามารถตอบคำถามเชิงวิเคราะห์ที่ซับซ้อนได้อย่างง่ายดาย Tableau มอบคำแนะนำเชิงวิเคราะห์เกี่ยวกับวิธีการใช้ประโยชน์จากแบบจำลองข้อมูลเบื้องต้น
Tableau 2024.1
Tableau 2024.1 มีความสามารถใหม่ที่ช่วยให้คุณตัดสินใจได้ดีขึ้นและเร็วขึ้นด้วย AI ที่น่าเชื่อถือ ไฮไลต์เด่นรวมถึง Tableau Pulse, ความพร้อมให้บริการ Amazon Marketplace, Viz Navigation สำหรับตารางข้อความ และอีกมากมาย
Pulse - เส้นแบบประกายไฟใน Slack
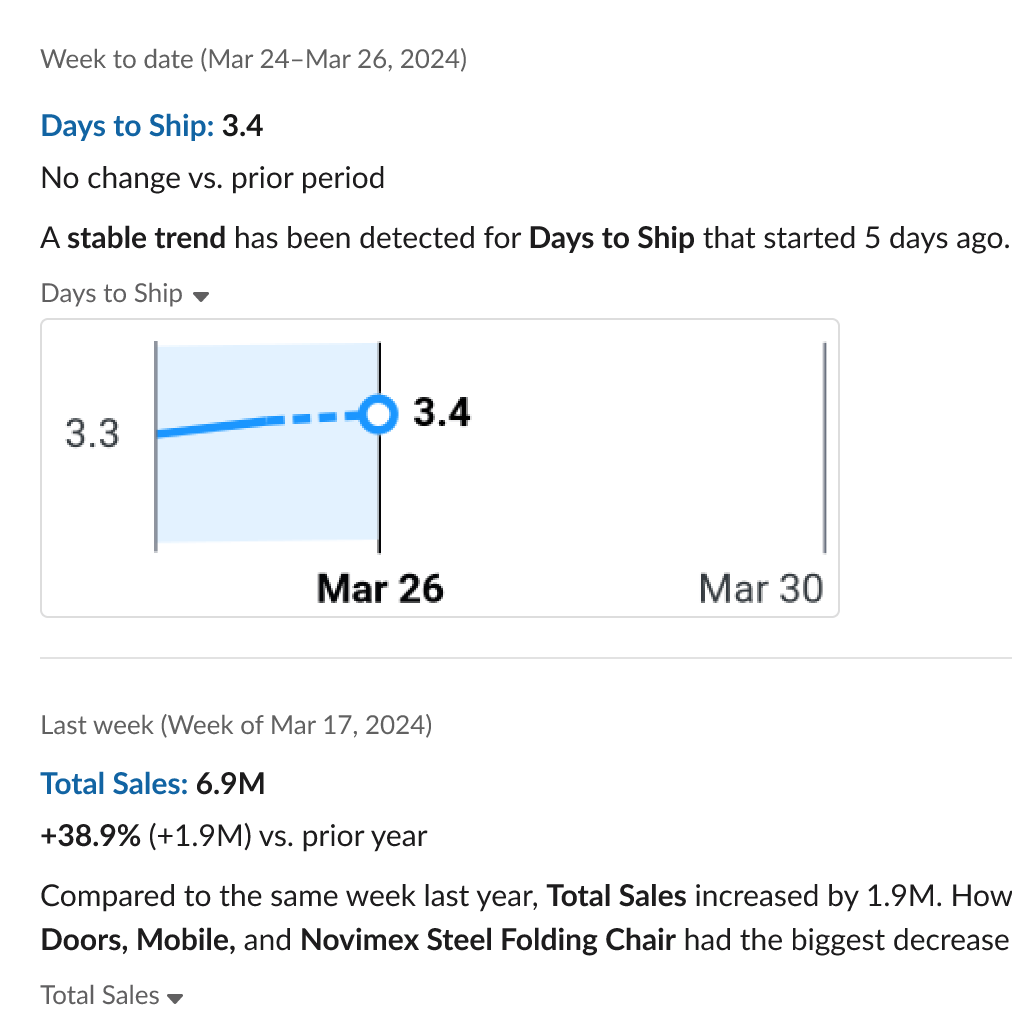
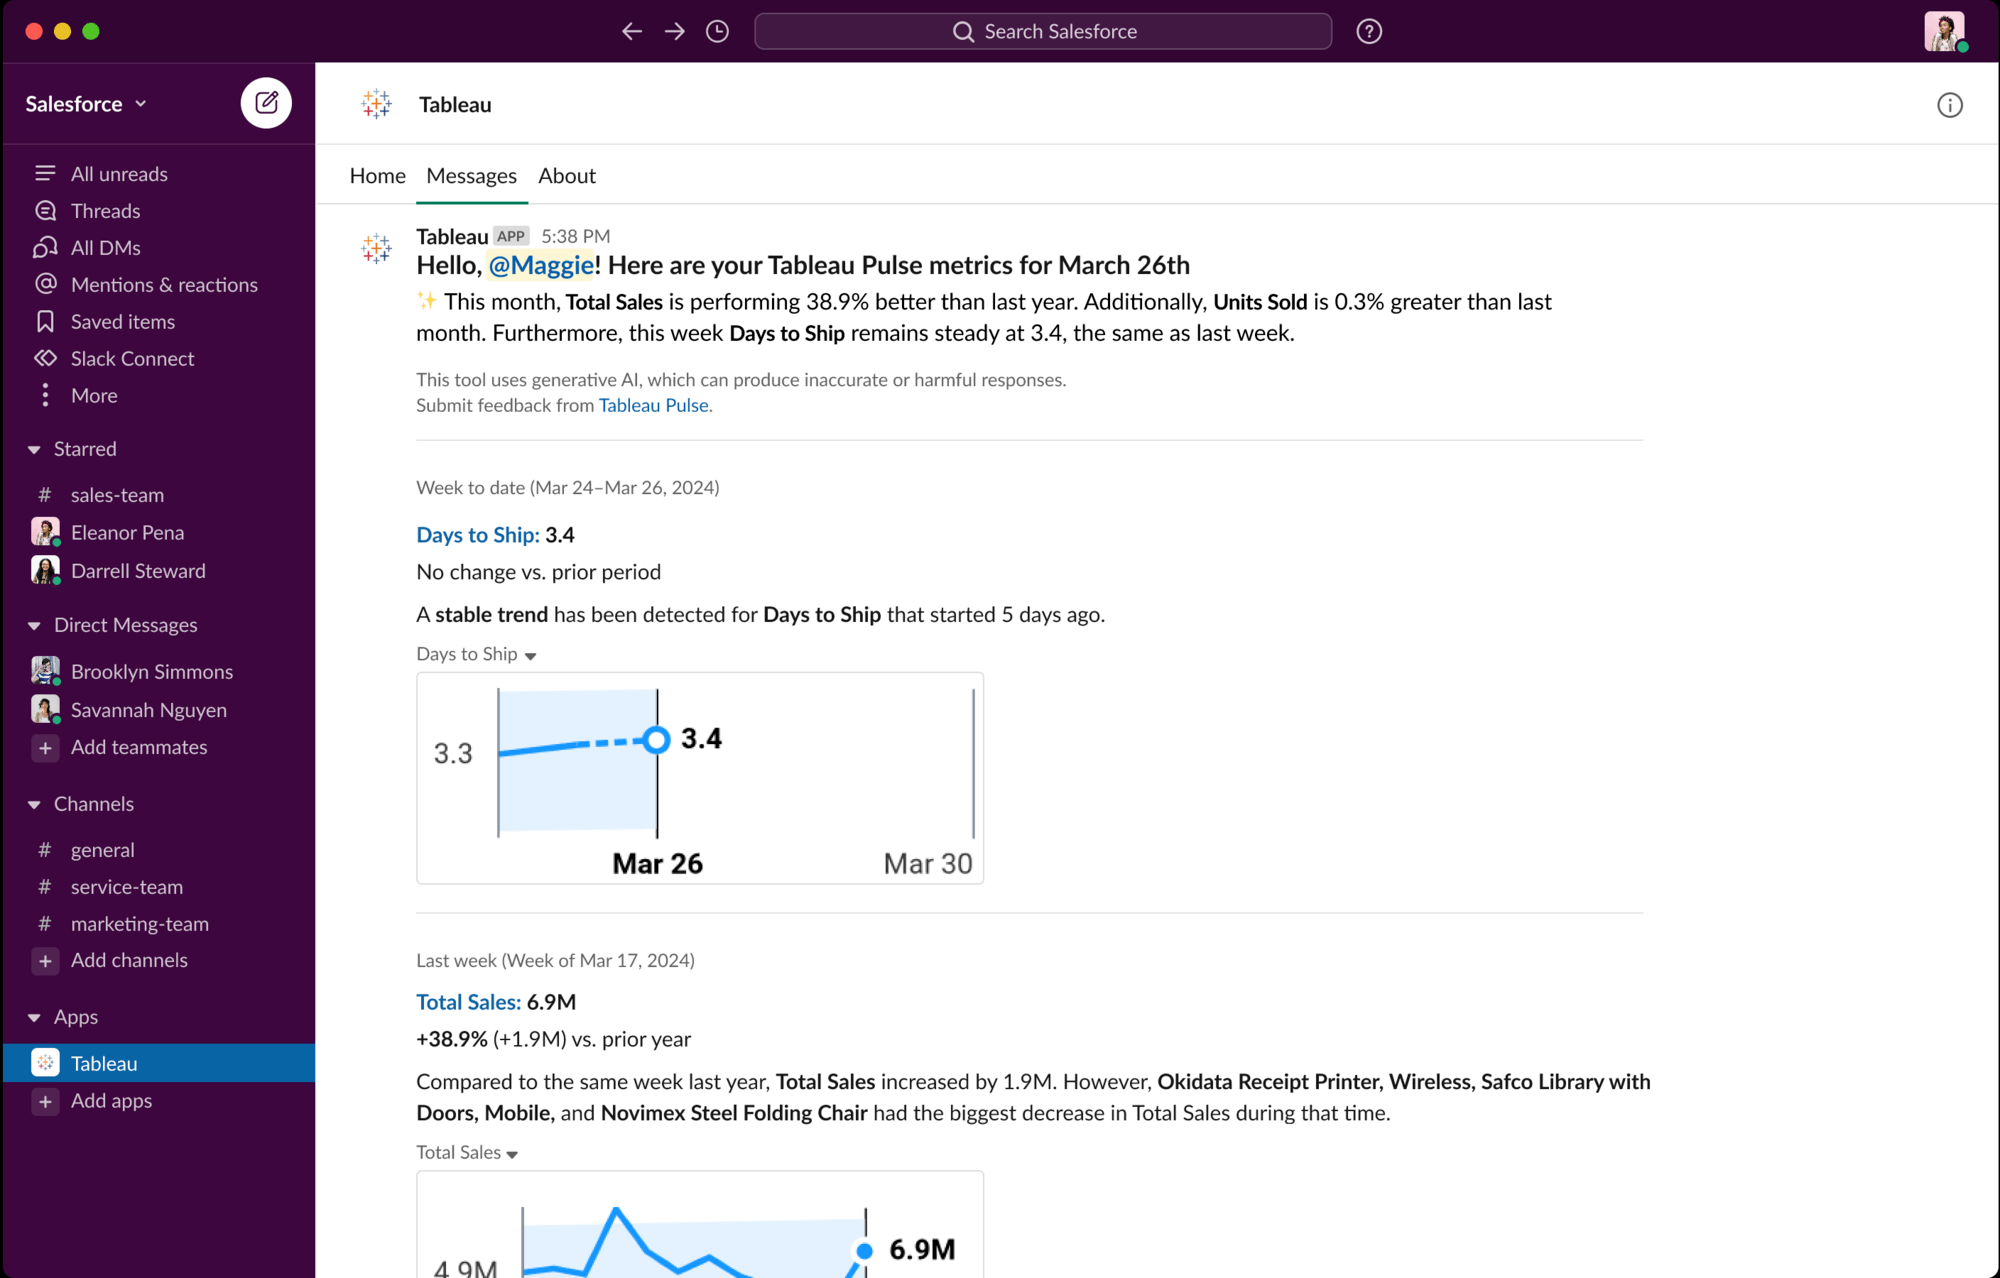
Pulse Digest in Slack ของคุณจะทรงพลังมากขึ้นกว่าที่เคยมีมา ตอนนี้ คุณจะได้รับข้อมูลเชิงลึกของภาษาธรรมชาติพร้อมด้วยคำอธิบายภาพ ทำให้สามารถประเมินการเปลี่ยนแปลงในเมตริกของคุณในลำดับงานได้ง่ายยิ่งขึ้น ระบุถึงแนวโน้มในเมตริกของคุณได้อย่างรวดเร็ว และหากอยู่ภายในช่วงที่คาดการณ์ คุณจะสามารถทำการตัดสินใจได้อย่างเหมาะสมและทันเวลา
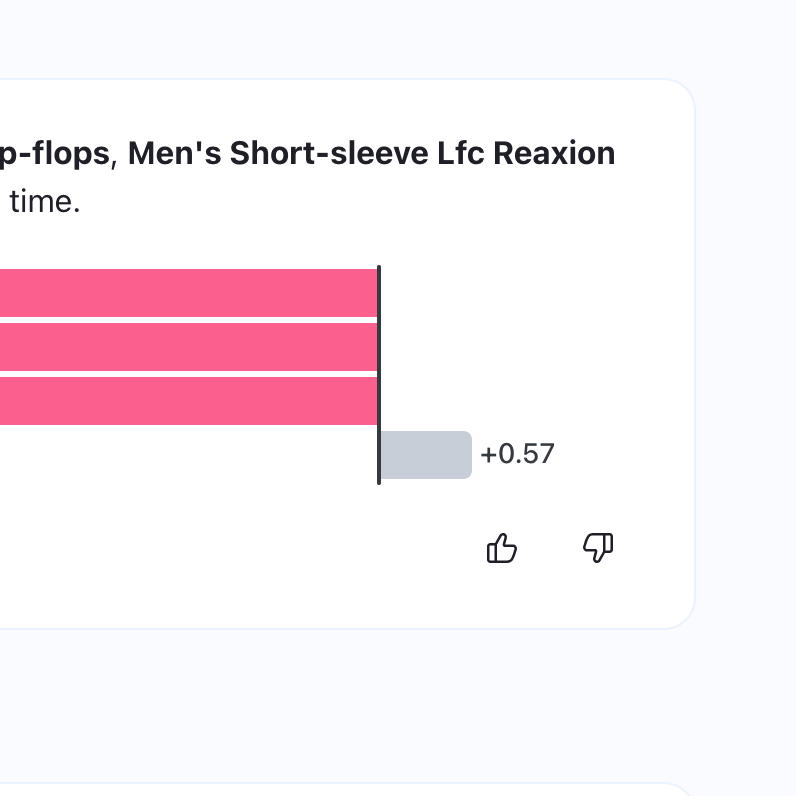
Pulse - การจัดอันดับข้อมูลเชิงลึกส่วนบุคคล
ยกระดับประสบการณ์ของคุณโดยการแจ้งให้ Pulse ทราบว่าข้อมูลเชิงลึกแบบใดที่คุณพบว่ามีประโยชน์มากที่สุด ด้วยการจัดอันดับข้อมูลเชิงลึกส่วนบุคคล ผลตอบกลับด้วยการชูนิ้วโป้งและคว่ำนิ้วโป้งจะส่งผลต่อข้อมูลเชิงลึกที่คุณจะได้เห็นก่อนรายการอื่น รับข้อมูลเชิงลึกที่่ตรงกับความสนใจและความชื่นชอบของคุณ เพื่อปรับปรุงประสบการณ์ผู้ใช้งานโดยรวมในเวิร์กโฟลว์ต่างๆ ไม่ว่าจะเป็นหน้า ข้อมูลสรุป หน้าหลักและหน้ารายละเอียดเมตริก
การเพิ่มประสิทธิภาพการถาม-ตอบของ Pulse
การถาม-ตอบของ Pulse จะเผยให้เห็นวิธีอื่นๆ ในการสำรวจข้อมูลเชิงลึกของคุณผ่านคำถามชี้นำและความสามารถในการถามคำถาม ตอนนี้ คุณจะเห็นปุ่ม “ถาม” ที่เพิ่มเข้ามาอยู่ถัดจากคำถามชี้นำให้คุณไว้ถามคำถามเกี่ยวกับเมตริกที่คุณกำลังตรวจสอบอยู่ การใช้ฟีเจอร์ “ถาม” จะแสดงคำถามแนะนำที่ตรงกับข้อมูลเชิงลึกที่คุณกำลังตรวจสอบ
การเพิ่มประสิทธิภาพการบูทสแตรปเมตริก
ค้นพบเมตริกของ Tableau Pulse ที่ซ่อนอยู่ในภาพข้อมูลแดชบอร์ดซึ่งมีฮิวริสติกที่ชาญฉลาดยิ่งขึ้นและมีบริบทมากขึ้น การเพิ่มประสิทธิภาพจะรวมไปถึงฮิวริสติกที่ดียิ่งขึ้นเพื่อระบุถึงการวัดผลและขนาดหลักๆ ในประเภทภาพข้อมูล Tableau ที่สำคัญ (แผนภูมิแท่ง แผนภูมิพื้นที่ และแผนภูมิเส้น) การรับรู้และการรวมฟิลด์ที่คำนวณไว้ภายในแหล่งข้อมูลที่เผยแพร่ (PDS) รวมถึงการแสดงภาพข้อมูลที่ดีขึ้นของไอคอนต่างๆ สำหรับการวัดผลและขนาดต่างๆ
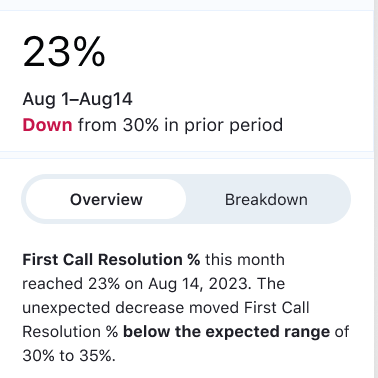
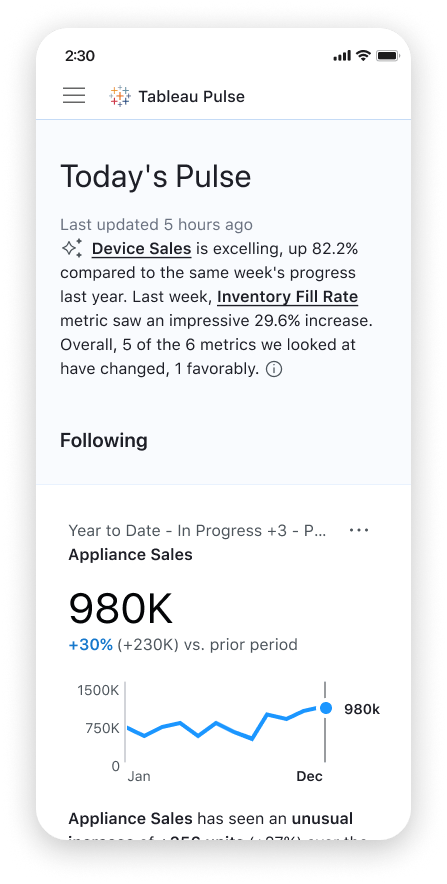
Tableau Pulse บนมือถือ
ตรวจสอบเมตริกของคุณได้ทุกที่ เข้าถึง Tableau Pulse บน Tableau Mobile และสำรวจข้อมูลเชิงลึกเฉพาะส่วนตัวเพื่อช่วยให้คุณเข้าใจแนวโน้ม ค่าผิดปกติ และการเปลี่ยนแปลงอื่นๆ ที่น่าสนใจกับเมตริกที่สำคัญที่สุดสำหรับคุณ Tableau Pulse บนมือถือช่วยให้คุณเข้าถึงข้อมูลเชิงลึกได้อย่างง่ายดายโดยการเชื่อมโยงเมตริกในอีเมล Tableau Pulse และ Slack ไปยังหน้าสำรวจข้อมูลเชิงลึกของแอปโดยตรง เพื่อให้คุณสามารถเจาะลึกได้มากขึ้นด้วยการคลิกเพียงครั้งเดียว
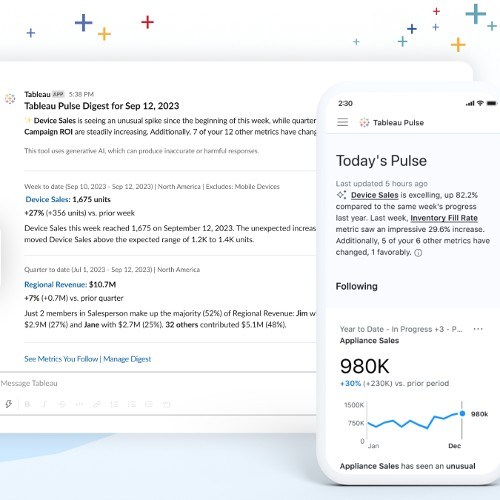
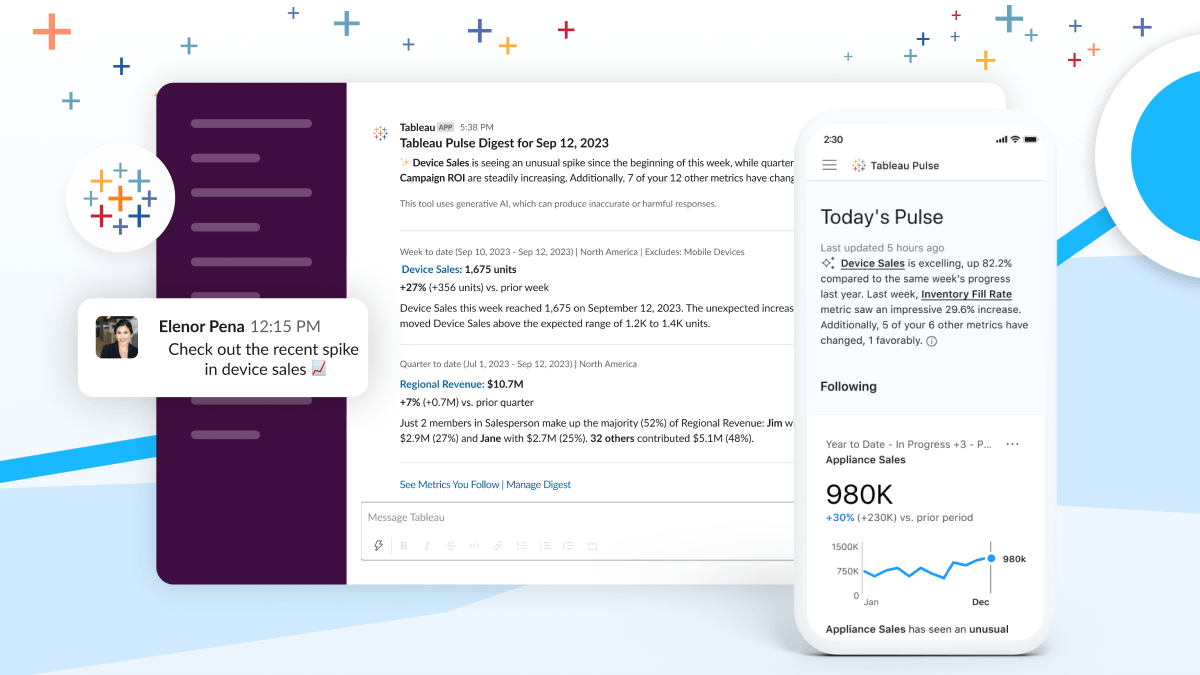
ประสบการณ์ Tableau Pulse รุ่นใหม่
ค้นพบ ติดตาม และแชร์เมตริกธุรกิจที่สำคัญเพื่อระบุข้อมูลเชิงลึกได้อย่างรวดเร็วด้วยประสบการณ์ที่ราบรื่นและใช้งานง่าย ประสบการณ์ Tableau Pulse รุ่นใหม่นำเสนอข้อมูลเชิงลึกที่สามารถนำไปใช้งานได้ ไม่ว่าคุณจะชอบทำงานที่ใดก็ตาม ทั้ง Slack, อีเมล หรือแอปพลิเคชันใดๆ ที่เหนือไปกว่าสิ่งใดก็คือ Tableau Pulse จะแสดงข้อมูลเชิงลึกในเชิงรุกเพื่อให้คุณทำการตัดสินใจได้อย่างทันท่วงที
Tableau 2023.3
Tableau 2023.3 มีความสามารถใหม่ๆ ที่จะช่วยให้คุณดู เข้าใจ และดำเนินการกับข้อมูลของคุณ ไฮไลต์เด่นรวมถึงช่วงแกนแบบไดนามิก, Embedding Playground, คอมโพเนนต์เว็บ Lightning ในระบบของ Tableau และอื่นๆ อีกมากมาย
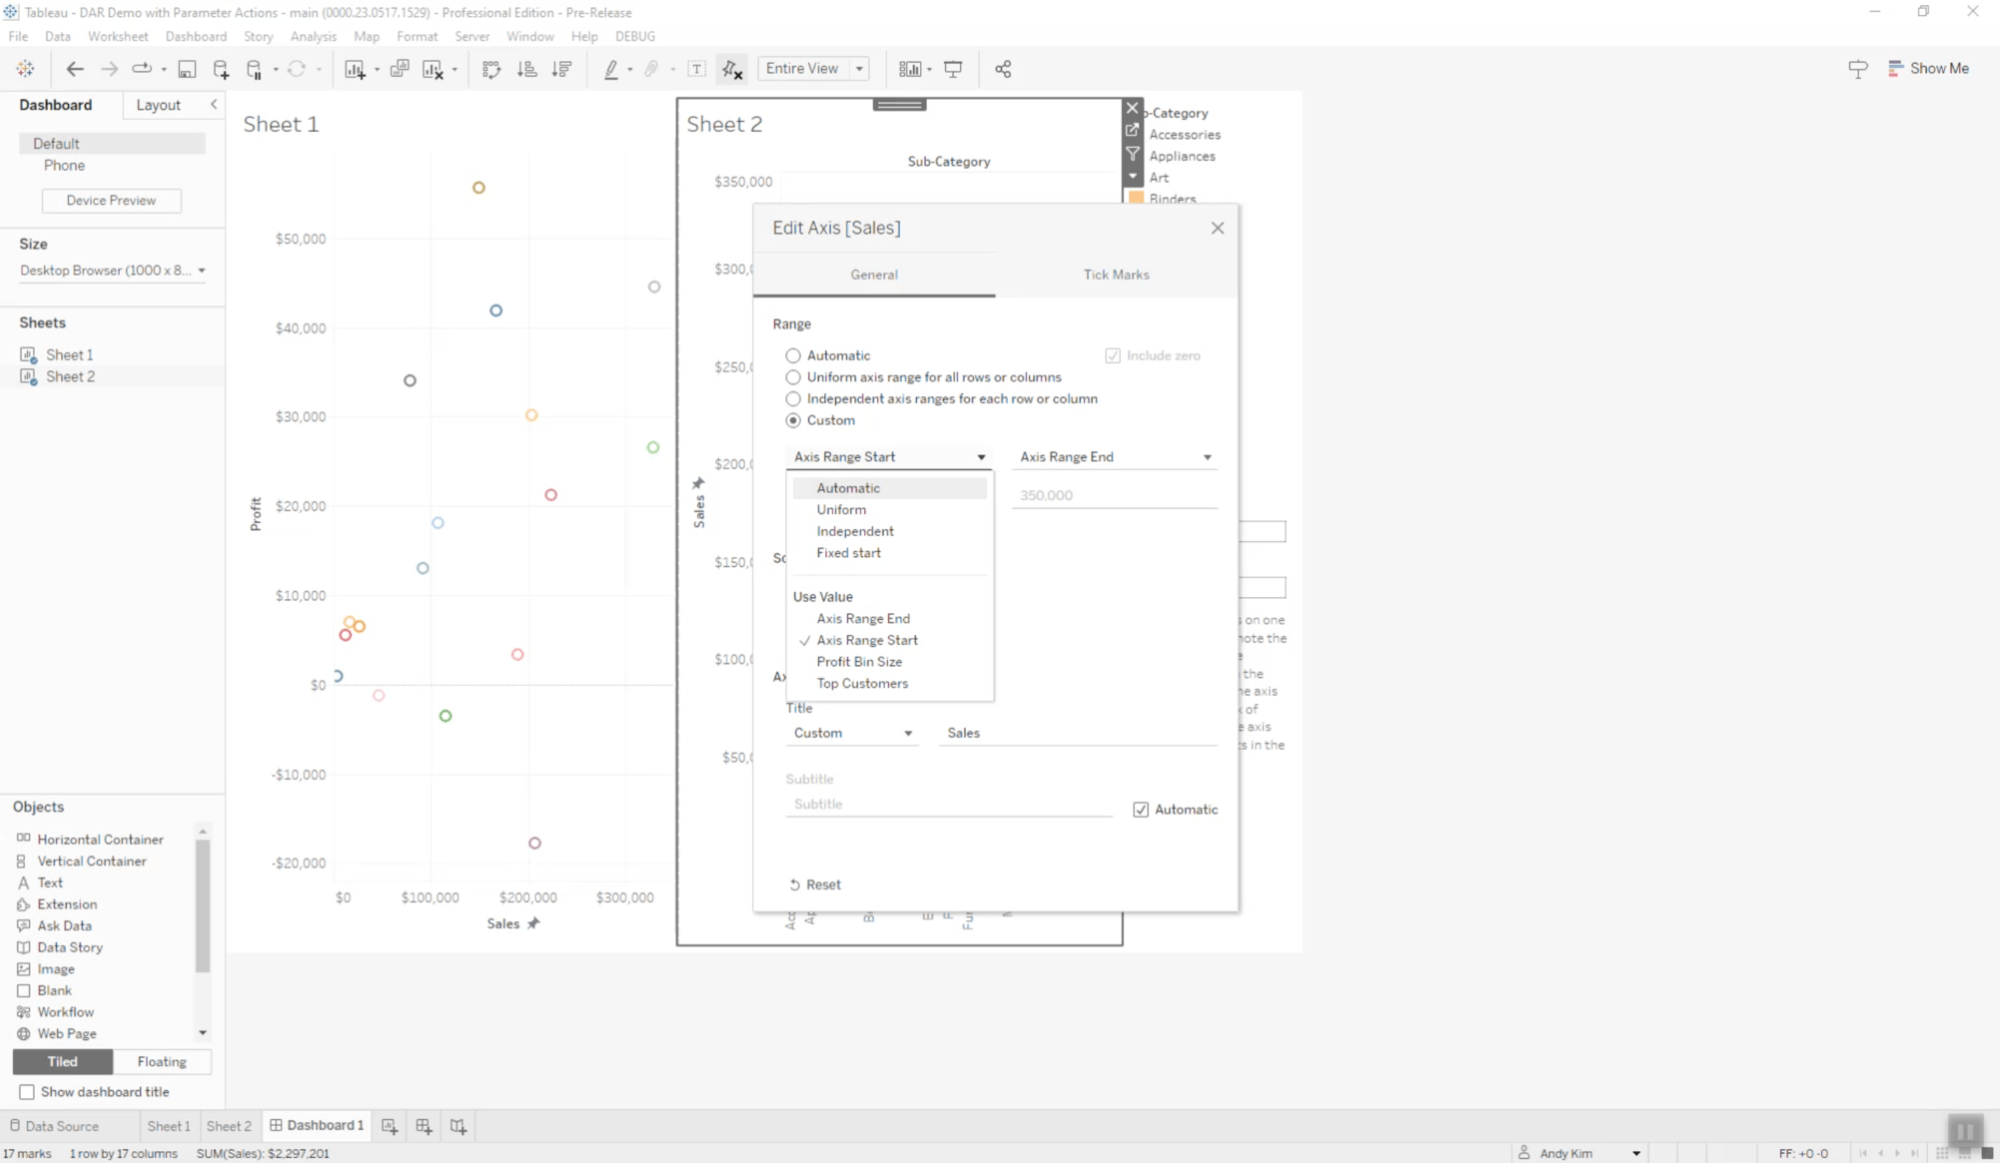
ช่วงแกนแบบไดนามิก
สร้างการแสดงภาพข้อมูลแบบไดนามิกโดยการใช้ค่าของพารามิเตอร์ในเวิร์กบุ๊กเพื่อตั้งค่าช่วงแกน ฟีเจอร์นี้ช่วยให้คุณสามารถเลือกพารามิเตอร์ต่างๆ สำหรับใช้เป็นช่วงแกนแต่ละช่วง คุณสามารถมีขอบเขตแกนไดนามิกเดี่ยวได้ (เฉพาะจุดเริ่มต้นหรือจุดสิ้นสุด) หรือสามารถกำหนดขอบเขตทั้งสองได้โดยใช้ฟิลด์ที่รองรับการใช้งาน
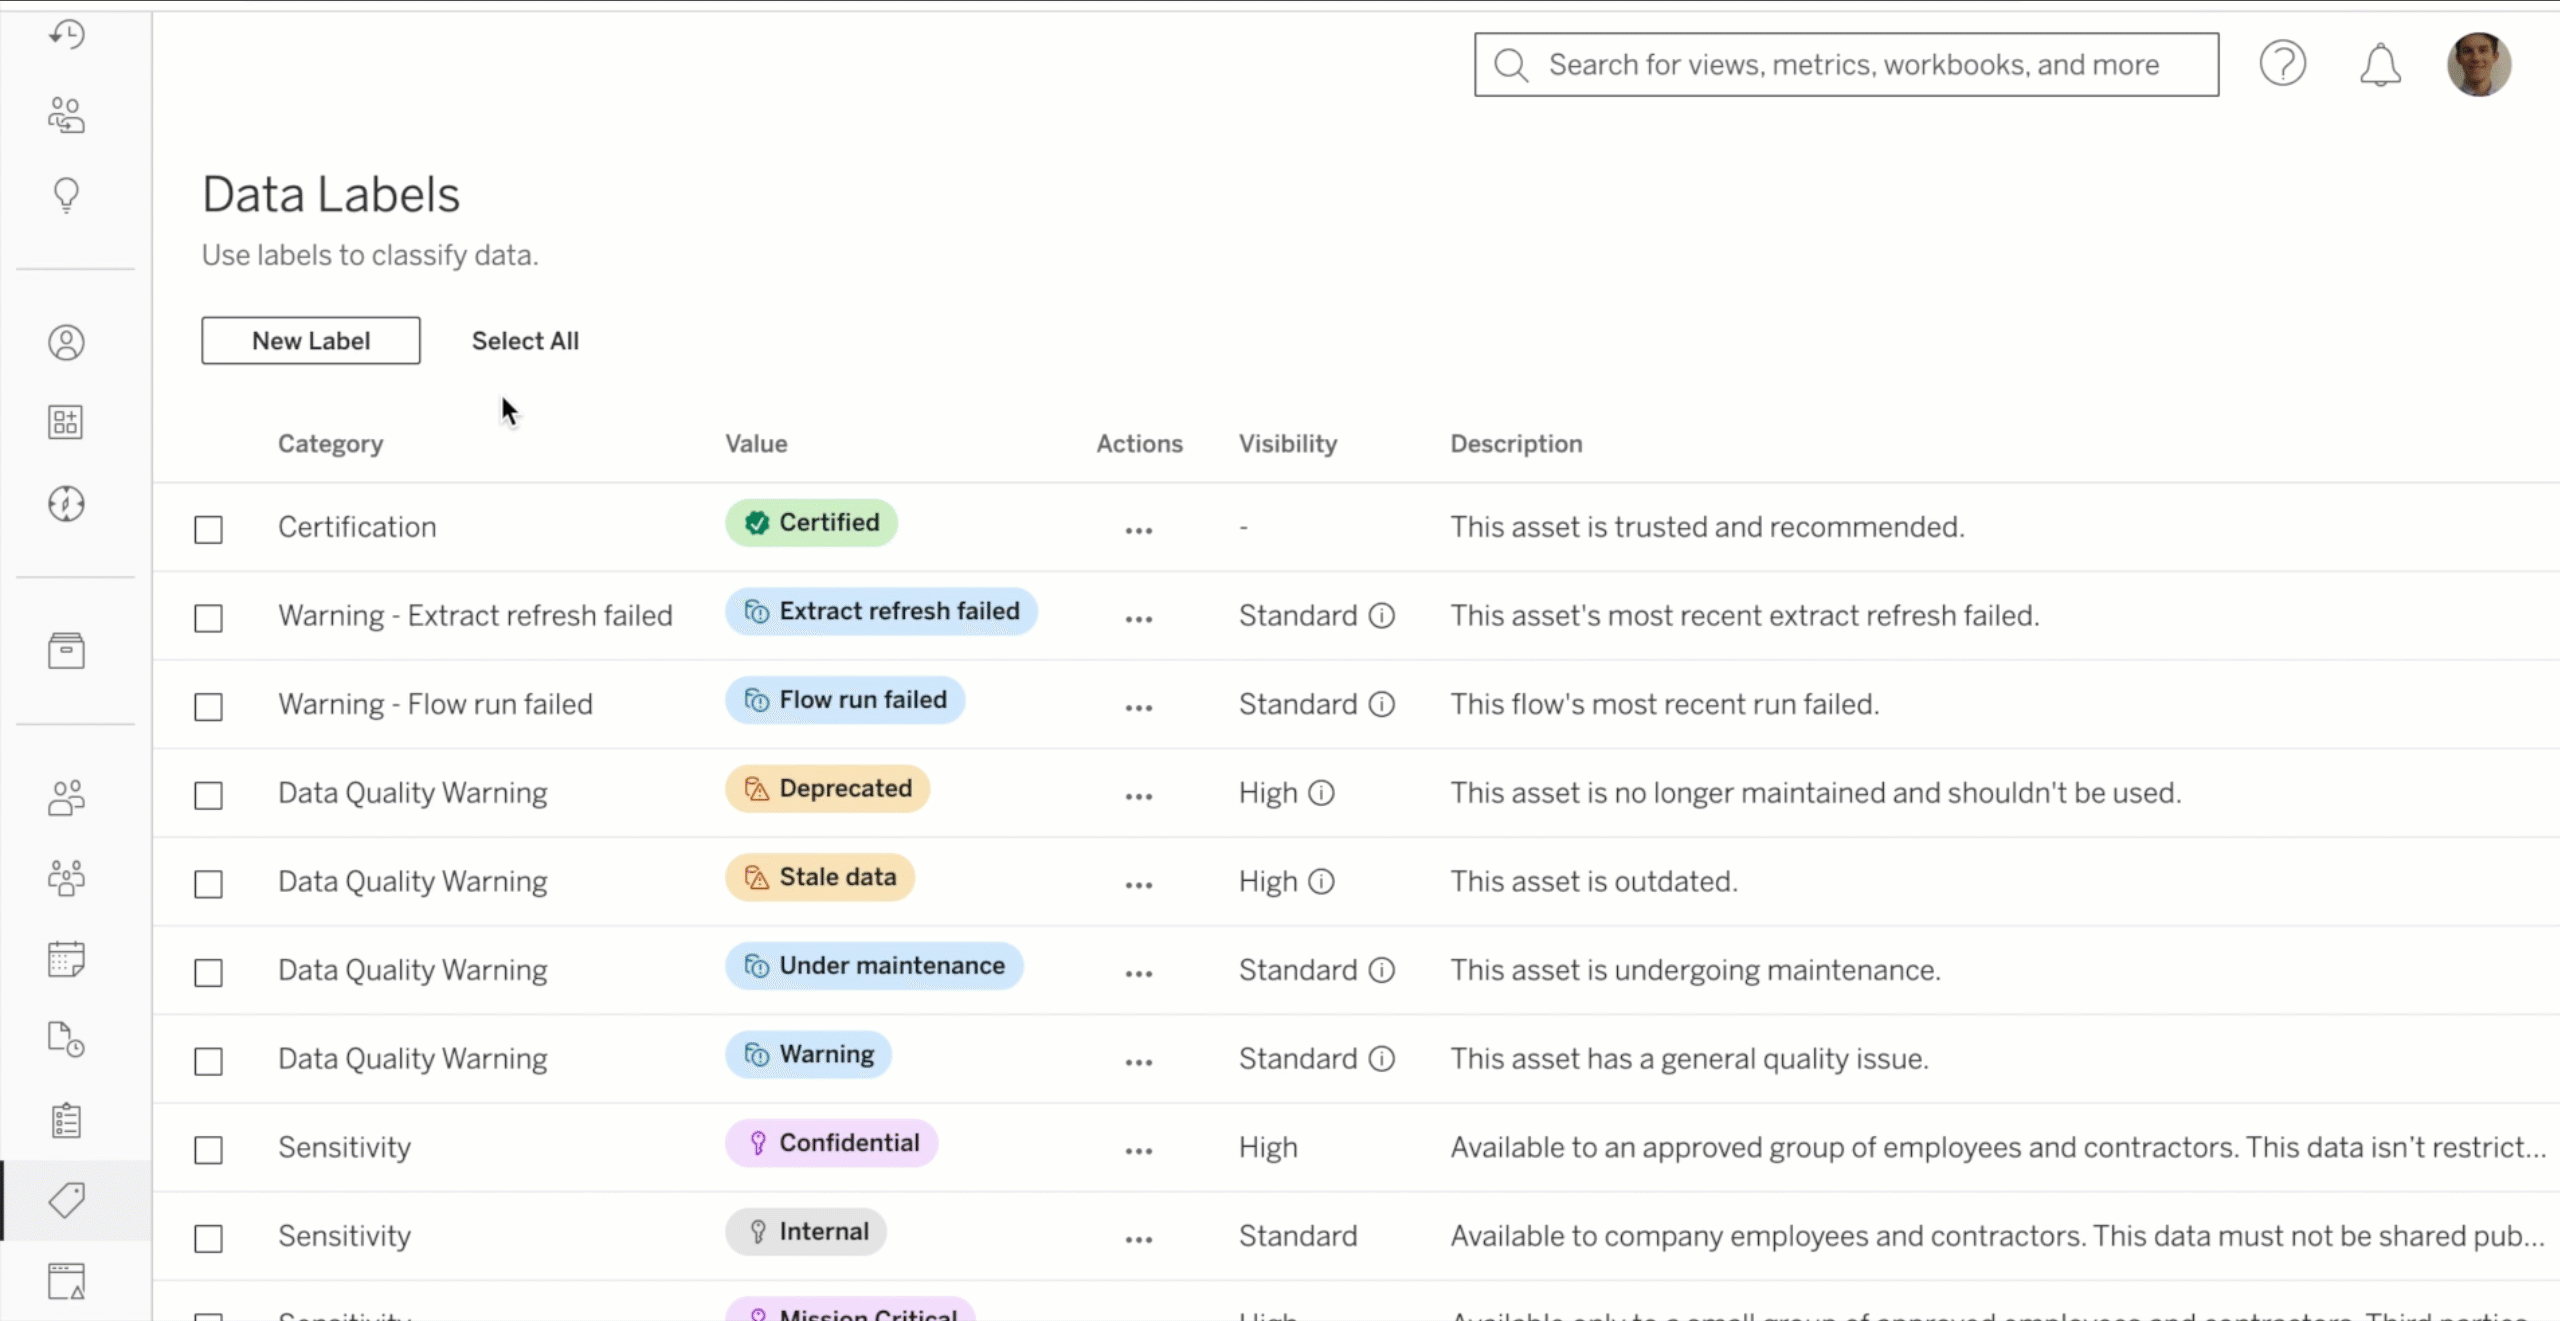
ป้ายกำกับข้อมูลที่กำหนดเอง
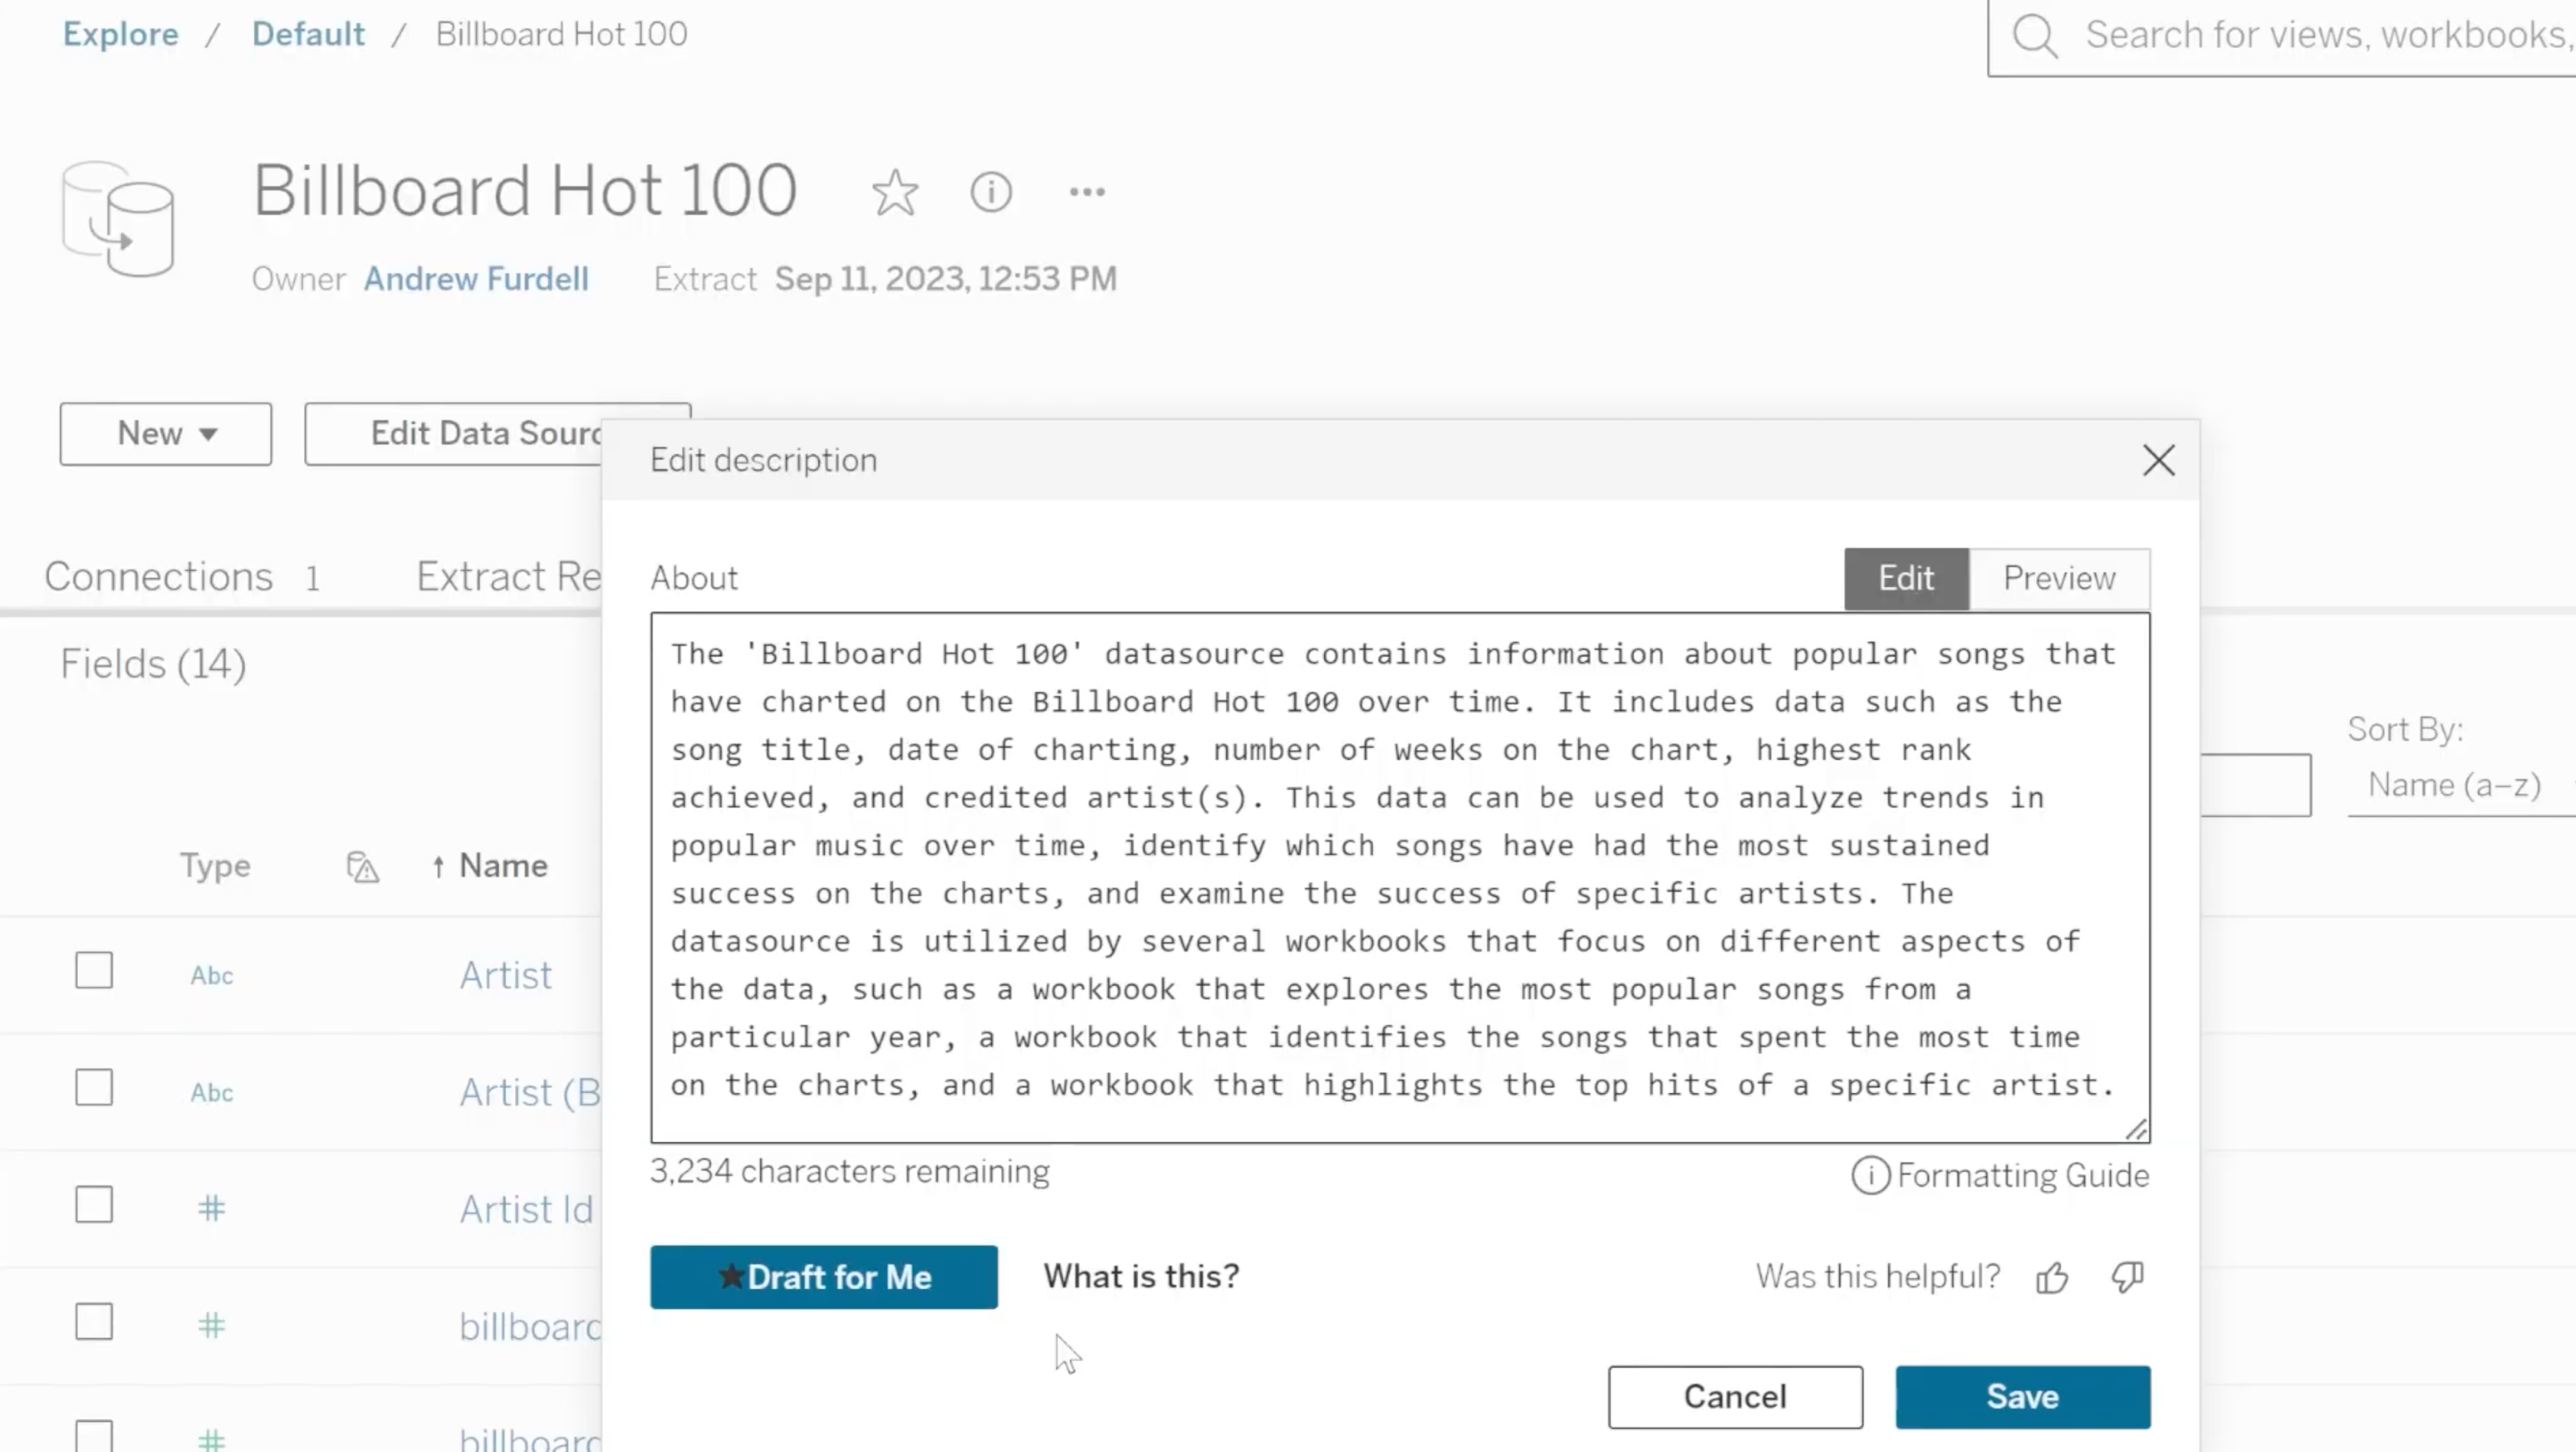
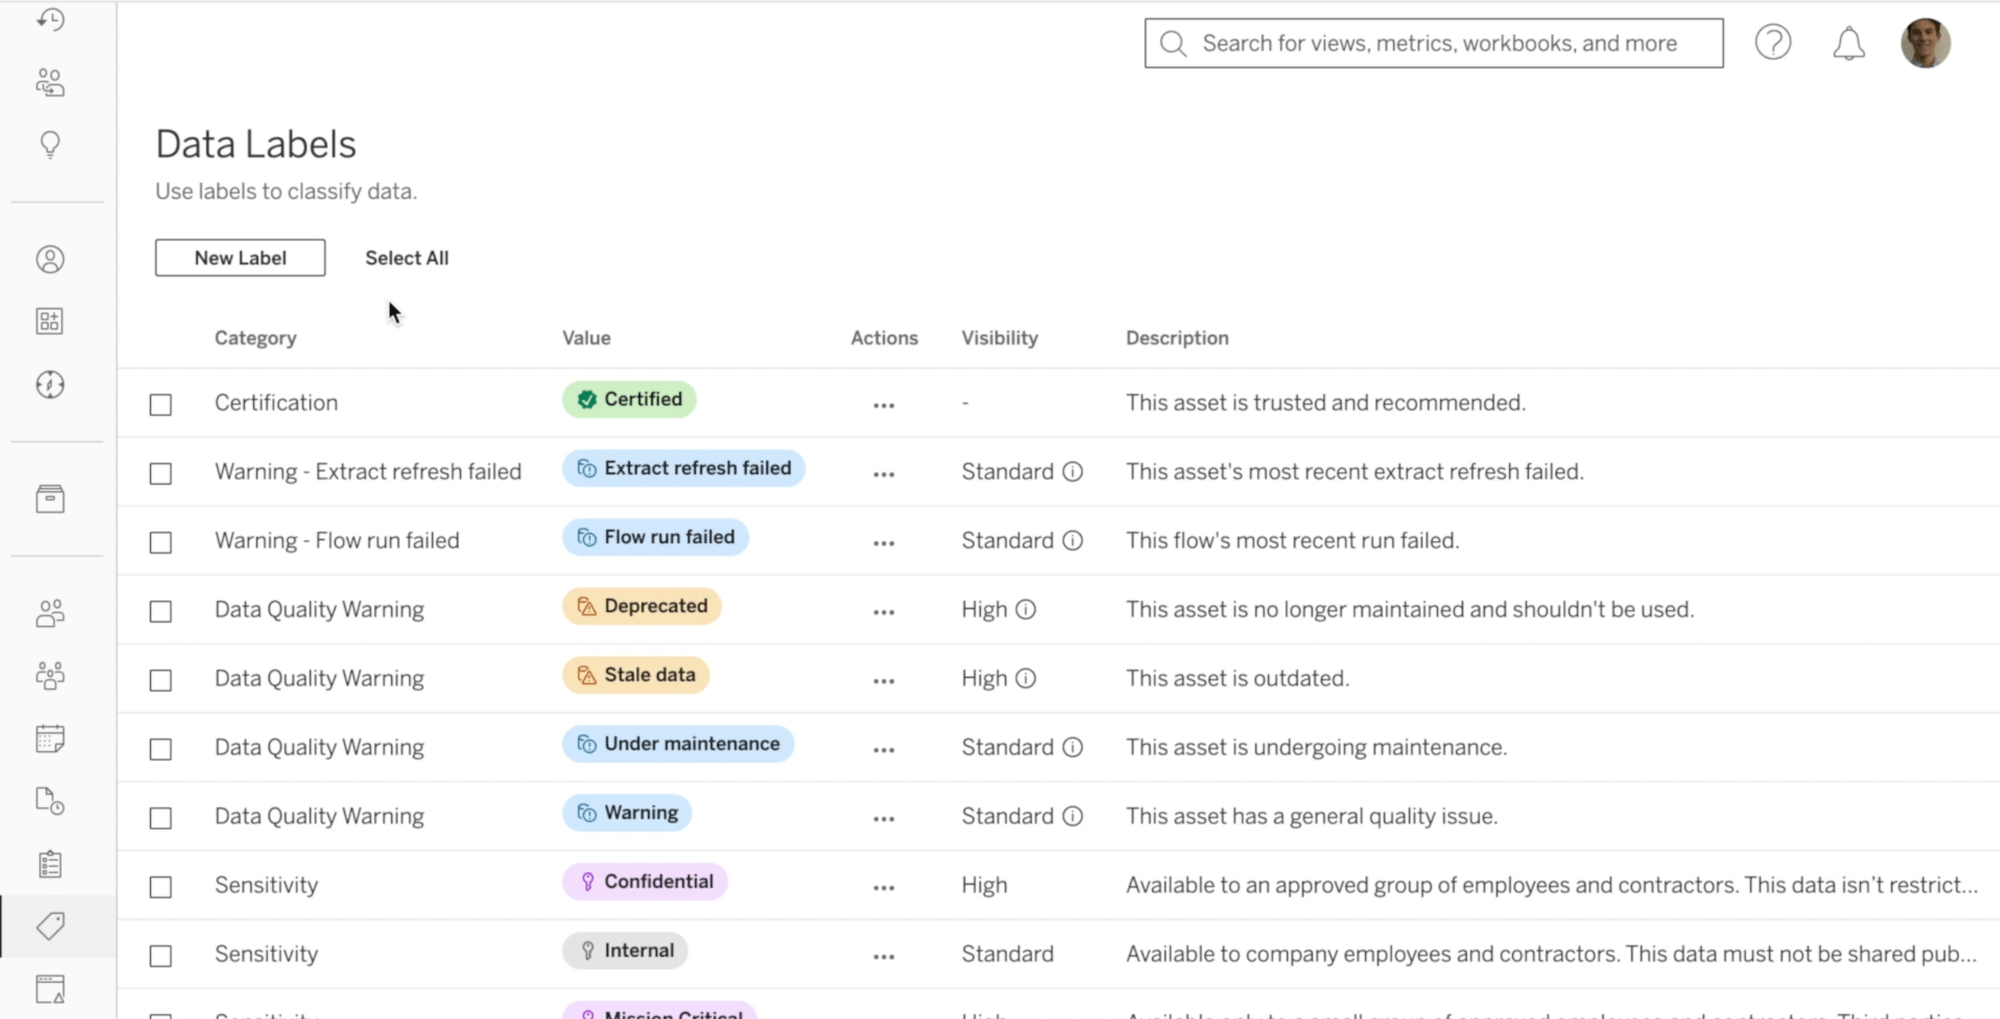
ทำให้ข้อมูลของคุณมีคนค้นพบได้มากขึ้นด้วยการจัดหมวดหมู่ภายใน Tableau ป้ายกำกับข้อมูลที่กำหนดเองเป็นความต่อเนื่องของชุดฟีเจอร์การติดป้ายกำกับที่เรานำไปใช้กับ Tableau ในช่วงหลายปีที่ผ่านมา ซึ่งรวมถึงการรับรอง คำเตือนคุณภาพข้อมูล และป้ายกำกับความละเอียดอ่อน ตอนนี้ผู้ดูแลระบบจะสามารถกำหนดป้ายกำกับข้อมูลที่กำหนดเองที่ Creator และ Explorer สามารถเพิ่มไปยังแอสเซทข้อมูลเพื่อปรับปรุงการสำรวจและการตรวจสอบภายใน Tableau นอกจากนี้คุณยังสามารถใช้ API ของป้ายกำกับข้อมูล เพื่อช่วยให้แอปพลิเคชันของบุคคลที่สามสามารถเพิ่มป้ายกำกับไปยังไซต์ของ Tableau สำหรับเมตาดาต้าที่ไม่ได้สร้างขึ้นใน Tableau อย่างเช่น ข้อมูลในเนื้อหาอัปสตรีมอย่างฐานข้อมูลและตารางต่างๆ
คอมโพเนนต์เว็บแบบ Lightning ในระบบของ Tableau
รับข้อมูลเชิงลึกเกี่ยวกับผู้ใช้ของคุณ ขณะนี้คุณสามารถฝัง Tableau Vizzes ลงใน Salesforce ผ่านทางคอมโพเนนต์เว็บแบบ Lightning และตรวจสอบสิทธิ์ได้อย่างราบรื่นด้วยโทเค็นที่เชื่อถือได้โดยการใช้แอปที่เชื่อมต่อ ซึ่งจะทำให้การวิเคราะห์ราบรื่นมากขึ้นจากการที่คุณสามารถดูแผนภูมิ CRM Analytics และการแสดงภาพของ Tableau ได้ในการใช้งานครั้งเดียวกัน ซึ่งทั้งหมดนี้สามารถทำได้ใน Salesforce นอกจากนี้พารามิเตอร์ของตัวกรองใน Tableau Component ยังช่วยให้สามารถส่งต่อตัวกรองจากแดชบอร์ด CRM Analytics ไปยัง Tableau Component และในทางกลับกันได้ด้วย เพื่อให้ซิงค์กันเสมอ
ส่วนเสริมของ Tableau Cloud สำหรับ Google Workspace
รับข้อมูลเชิงลึกเกี่ยวกับขั้นตอนการทำงาน การร่วมมือกันครั้งล่าสุดกับ Google ช่วยให้ผู้ใช้สามารถดูภาพตัวอย่างของการแสดงภาพข้อมูลของ Tableau Cloud ได้อย่างรวดเร็วจากภายใน Google Docs การผสานรวม Tableau กับ Google Smartchips สำหรับ Google Workspace ทำให้ลิงก์ที่นำไปยังการแสดงภาพข้อมูลของ Tableau Cloud ได้รับการแปลงเป็นมุมมองภาพปกที่แสดงชื่อของการแสดงภาพข้อมูลใน Tableau วันที่อัปเดตล่าสุด และภาพตัวอย่าง ภาพปกจะสร้างขึ้นในทันที และแสดงข้อมูลล่าสุดเสมอ นอกจากนี้คุณยังสามารถคลิกเพื่อเปิดการแสดงภาพข้อมูลใน Tableau Cloud เพื่อสำรวจเพิ่มเติมได้ด้วย พร้อมใช้งานแล้วใน Google Workspace Marketplace
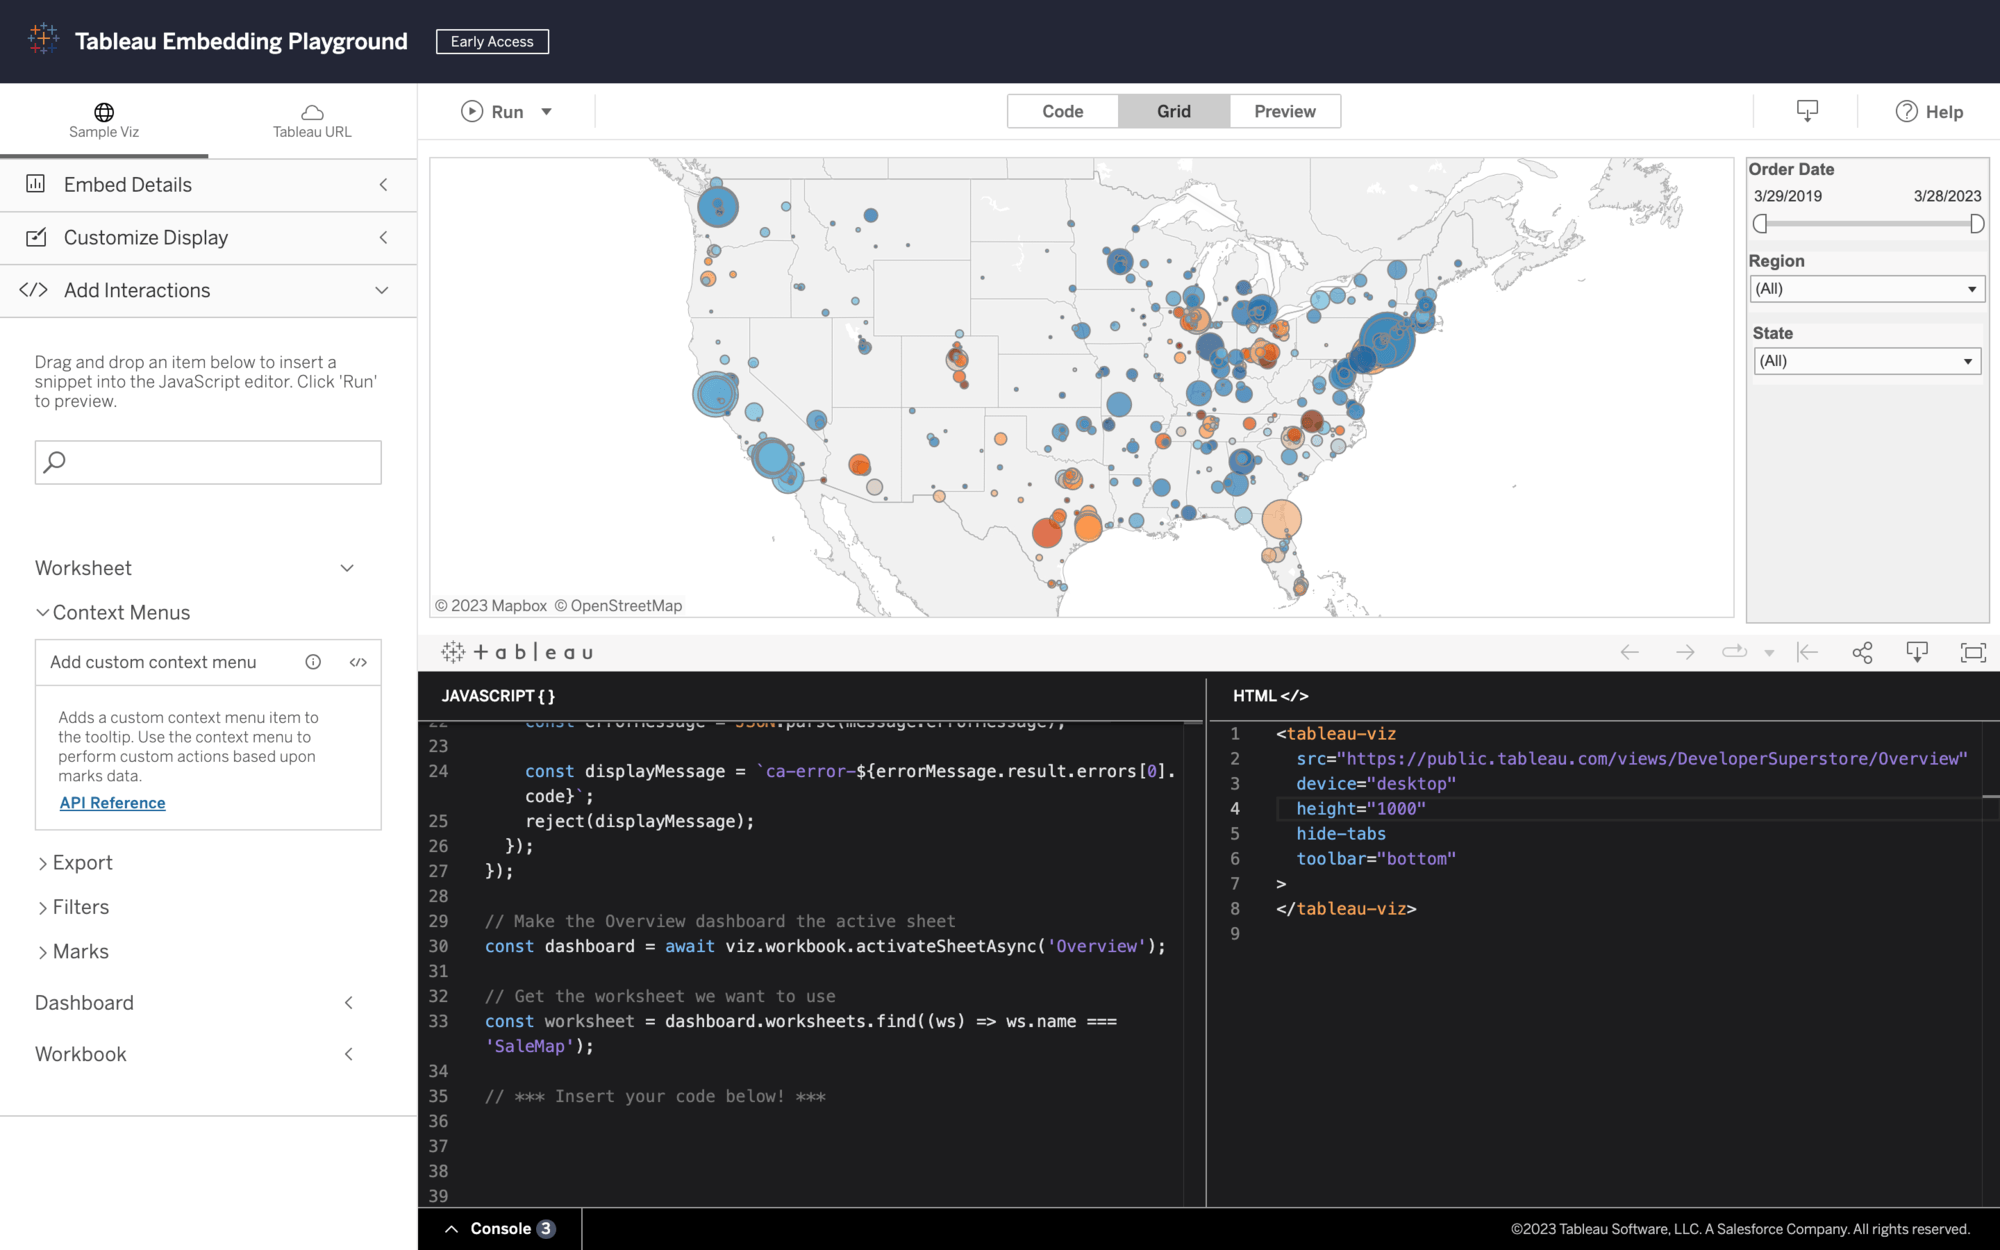
Embedding Playground
พัฒนาโค้ดที่กำหนดเองอย่างรวดเร็วภายในไม่กี่นาที Tableau Embedding Playground เป็นสภาพแวดล้อมการเรียนรู้แบบอินเทอร์แอกทีฟที่คุณจะได้รับประสบการณ์จากการลองใช้ความสามารถของการวิเคราะห์แบบฝังที่สำคัญ ใน Embedding Playground คุณสามารถสร้างโค้ดที่ส่งออกได้อย่างรวดเร็ว เพื่อฝังการแสดงภาพข้อมูลแบบโต้ตอบลงในแอปพลิเคชัน เรียนรู้เพิ่มเติมเกี่ยวกับความเป็นไปได้ใหม่ๆ ทดสอบความสามารถเหล่านี้ และรับแรงบันดาลใจที่จะนำโซลูชันการวิเคราะห์แบบฝังไปยังระดับถัดไป พร้อมให้ใช้งานแล้ว
การเข้าถึงตามความต้องการ
การเข้าถึงตามความต้องการจะช่วยให้ลูกค้าของการให้สิทธิ์อนุญาตตามการใช้งาน Embeded Analytics สามารถสร้างระบบการตรวจสอบสิทธิ์ที่เชื่อมต่อระหว่างแอปพลิเคชันของตนเองกับ Tableau Cloud ได้ เมื่อใช้การเข้าถึงตามความต้องการ ลูกค้าจะสามารถใช้ฟังก์ชันการทำงานของแอปที่เชื่อมต่อของ Tableau เพื่อยืนยันผู้ใช้และสิทธิ์ ณ เวลาที่เข้าถึงได้ ขณะนี้คุณสามารถรักษาแหล่งข้อมูลความจริงเพียงแหล่งเดียวสำหรับข้อมูลประจำตัว บทบาท และสิทธิพิเศษของผู้ใช้ได้ในแอปพลิเคชันของคุณเอง โดยไม่ต้องสร้าง ซิงค์ และ/หรือรักษาบัญชีเหล่านี้ใน Tableau ด้วย
Tableau 2023.2
Tableau 2023.2 มีความสามารถใหม่ๆ ที่จะช่วยคุณวิเคราะห์ข้อมูลได้อย่างมีประสิทธิภาพและมีประสิทธิผลมากขึ้น ไฮไลต์เด่นรวมถึงเคล็ดลับเครื่องมือแบบผสานรวมที่เดียว ตัวเชื่อมต่อระบบคลาวด์ข้อมูล การคำนวณแบบหลายแถวใน Tableau Prep และอื่นๆ มากมาย
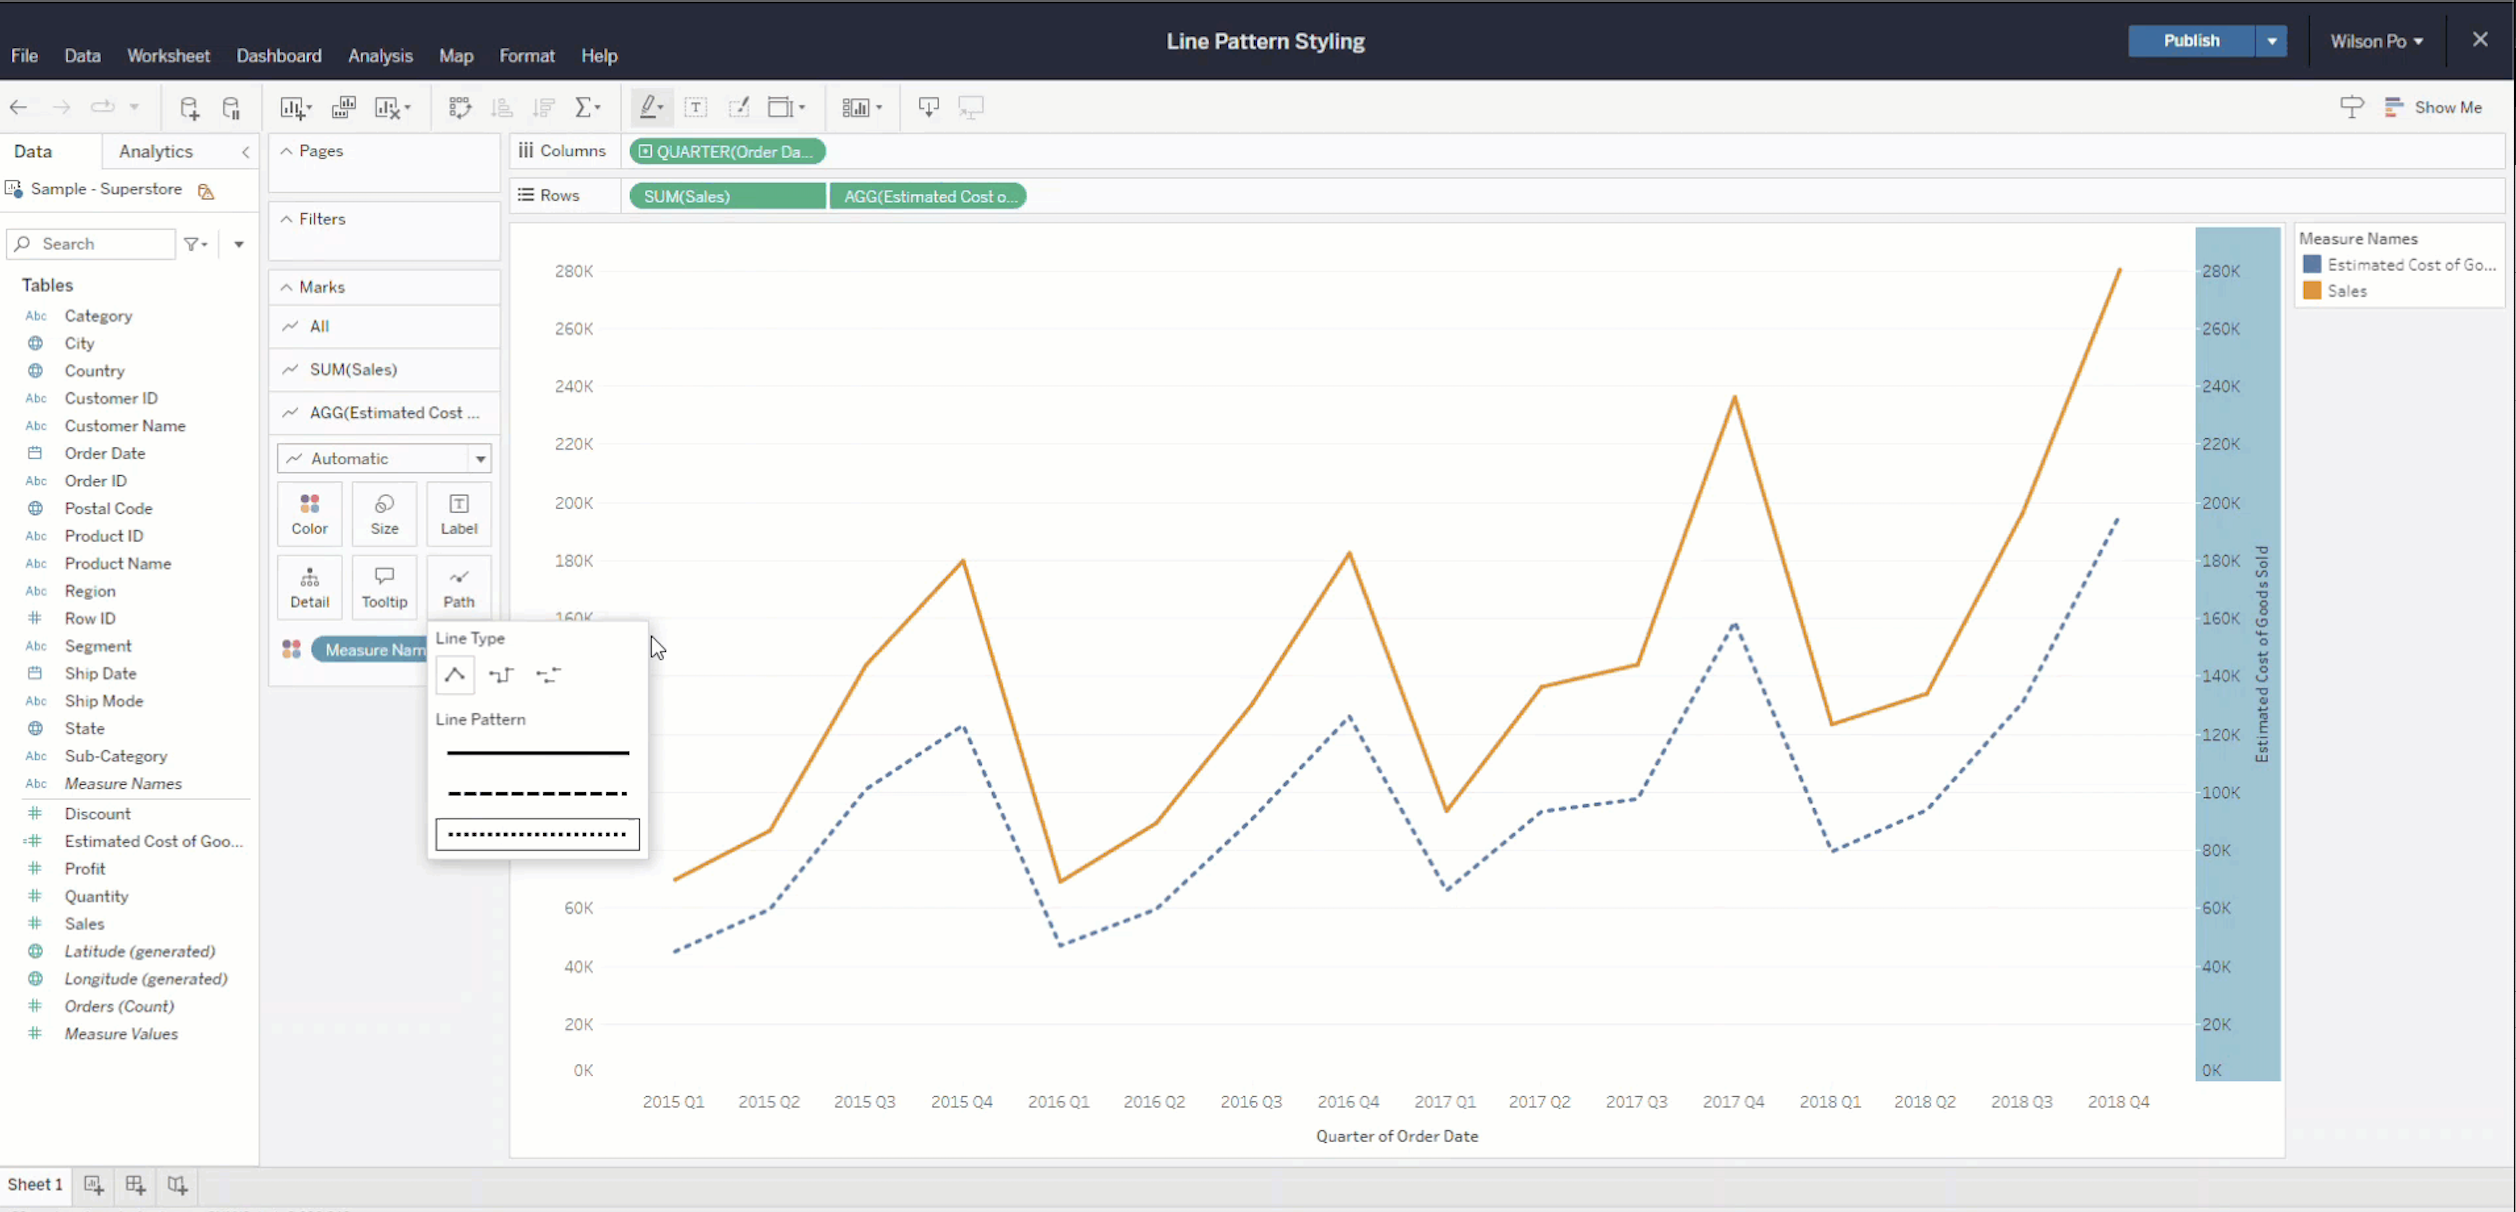
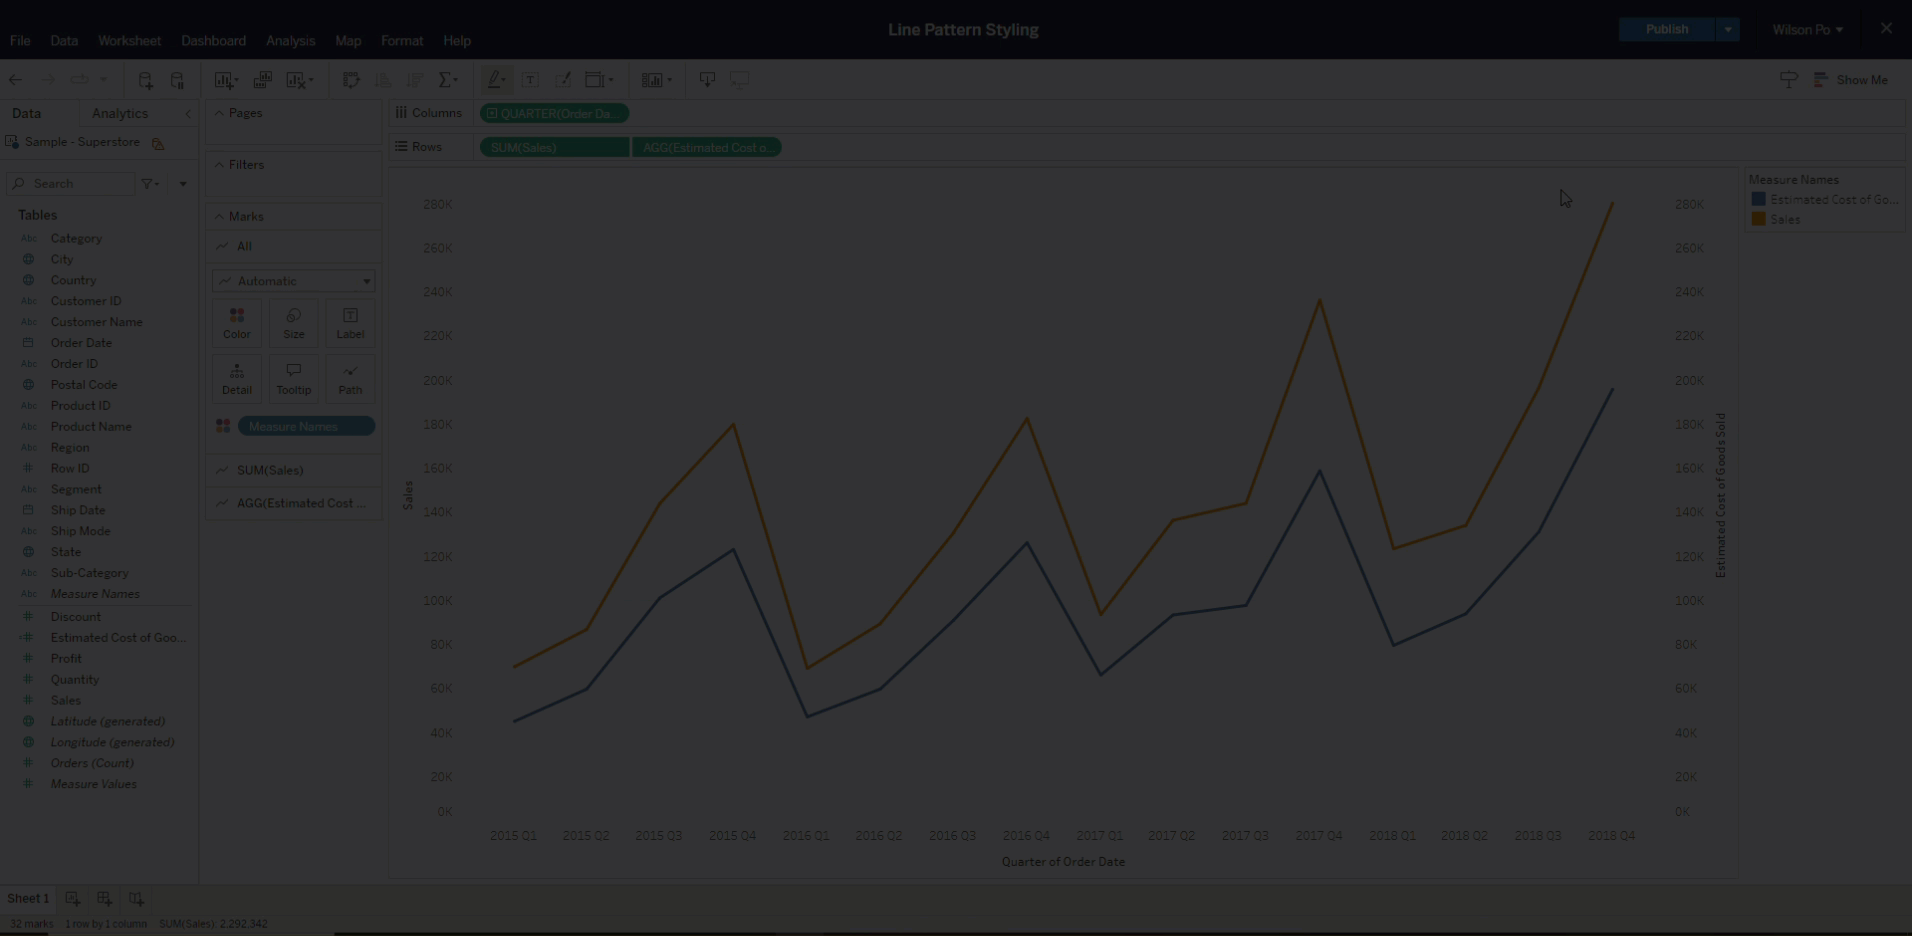
รูปแบบเส้น
รูปแบบเส้นจะมีความสามารถใหม่ในการจัดรูปแบบ ช่วยให้ผู้เขียนสามารถเลือกเส้นแนวโน้มใดก็ได้เพื่อแสดงเป็นเส้นทึบ เส้นประ หรือเส้นจุดไข่ปลา ความสามารถใหม่นี้ช่วยให้คุณแสดงรายละเอียดปลีกย่อยได้ง่ายขึ้นเมื่อต้องแสดงแนวโน้มหลายรายการ โดยการจัดรูปแบบจะช่วยในการแสดงเนื้อหาได้เมื่อบางบรรทัดแสดงบริบทเฉพาะ เช่น เกณฑ์หรือจุดข้อมูลแบบจำลอง
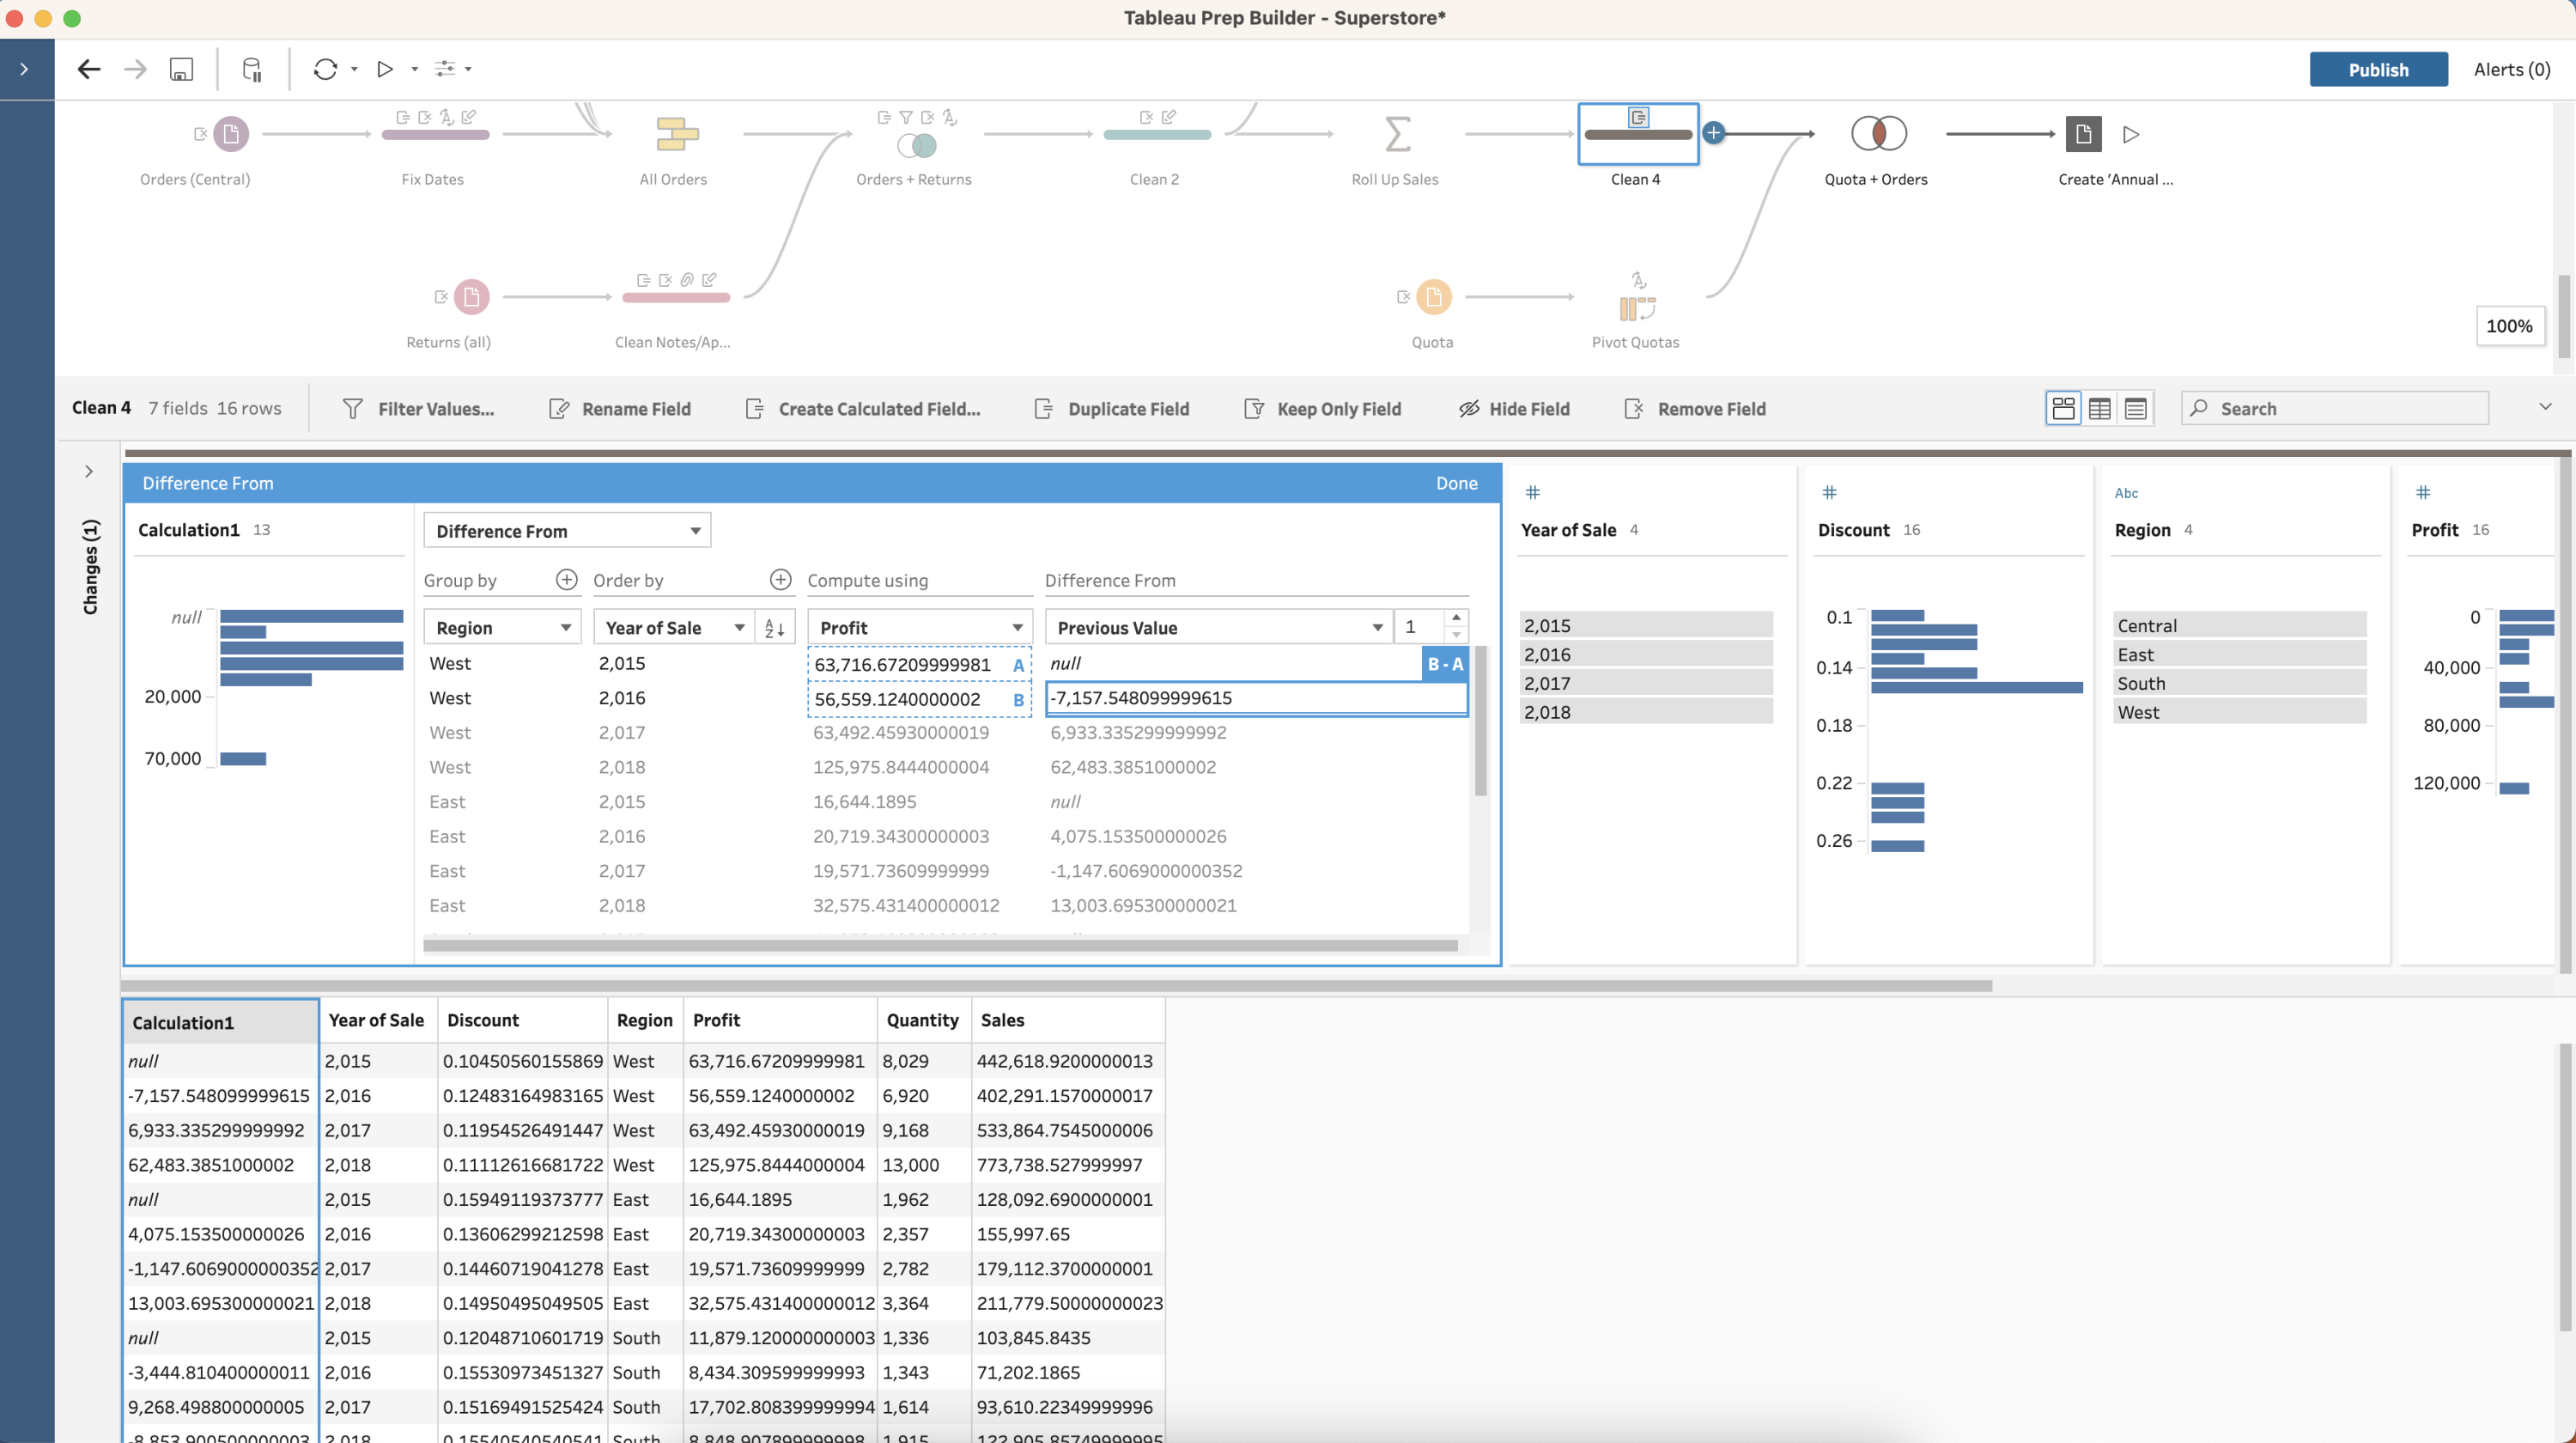
การคำนวณหลายแถวใน Tableau Prep
คุณสามารถใช้การคำนวณหลายแถวใน Tableau Prep เพื่อคำนวณตารางในขณะที่คุณเตรียมข้อมูลได้ ใช้การคลิกเพื่อคำนวณผลต่างจาก เปอร์เซ็นต์ผลต่างจาก และการคำนวณแบบเคลื่อนที่ได้ง่ายกว่าที่เคยโดยไม่ต้องใช้โค้ดหรือการคำนวณที่ซับซ้อน และตอนนี้คุณยังสามารถเขียนการคำนวณ LOOKUP ในตัวแก้ไขนิพจน์ของ Tableau Prep ได้อีกด้วย
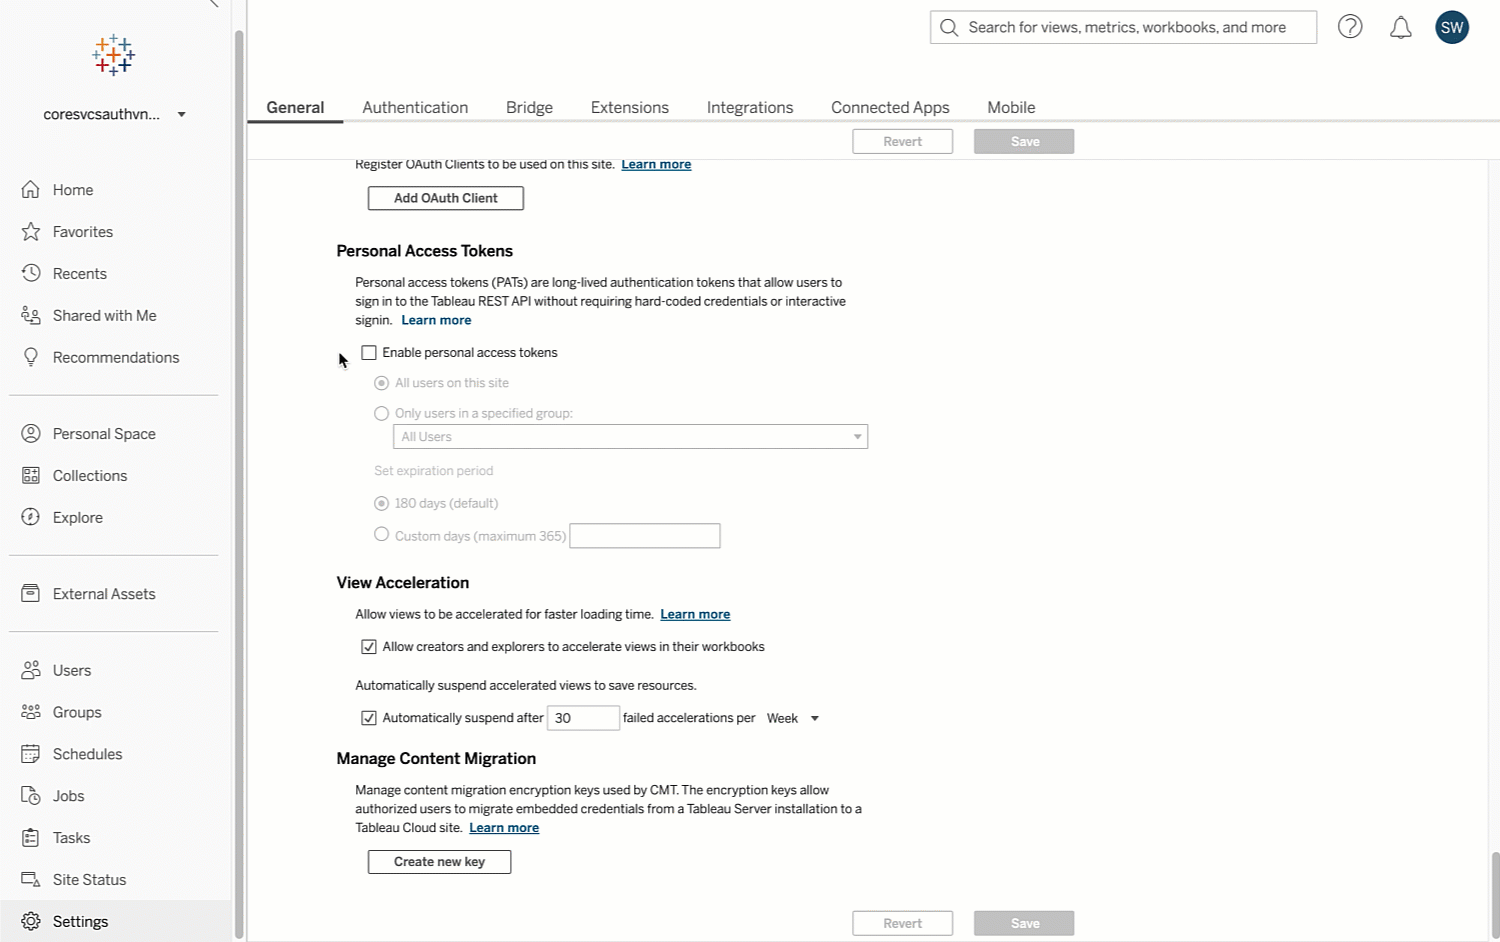
การควบคุมผู้ดูแลระบบโทเค็นการเข้าถึงส่วนบุคคล
ปฏิบัติตามข้อกำหนดด้านความปลอดภัยขององค์กรด้วยการควบคุมโทเค็นการเข้าถึงส่วนบุคคล (PAT) เพิ่มเติมใน Tableau Cloud
การเปลี่ยนแปลงสำหรับไซต์ Tableau Cloud ทั้งหมดมีดังนี้
- ขณะนี้ผู้ดูแลไซต์สามารถควบคุมได้ว่าใครสามารถสร้าง PAT ได้
- ขณะนี้ผู้ดูแลไซต์สามารถควบคุมระยะเวลาที่ PAT สามารถใช้ได้ ตั้งแต่ 1 ถึง 365 วัน
การเปลี่ยนแปลงสำหรับไซต์ Tableau Cloud ที่สร้างขึ้นหลังจาก 23 กุมภาพันธ์มีดังนี้
- PAT จะถูกปิดใช้งานตามค่าเริ่มต้น
- วันหมดอายุเริ่มต้นของ PAT ลดลงเหลือ 180 วัน
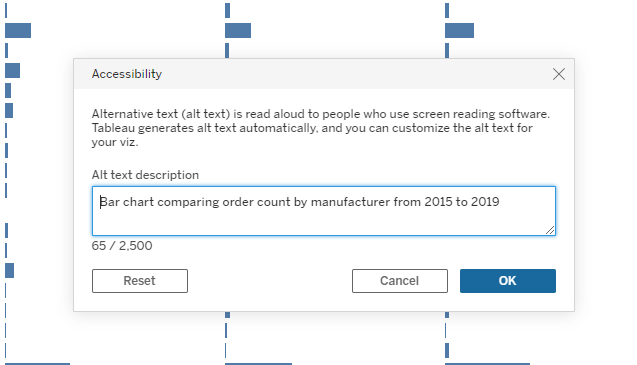
ข้อความแสดงแทนภาพที่แก้ไขได้
ตอนนี้คุณสามารถแก้ไขข้อความแสดงแทนที่สร้างขึ้นโดยอัตโนมัติได้แล้ว ตามค่าเริ่มต้น Tableau จะสร้างข้อความสำหรับโปรแกรมอ่านหน้าจอโดยอัตโนมัติ เพื่อความมั่นใจว่าจะมีการอ่านคำอธิบายการแสดงเป็นภาพออนไลน์ทั้งหมดโดยโปรแกรมอ่านหน้าจอ รวมถึงการแสดงผลฝั่งไคลเอ็นต์และเซิร์ฟเวอร์และการแสดงเป็นภาพแบบฝัง ตอนนี้ผู้เขียนเนื้อหาจะสามารถแก้ไขข้อความแสดงแทนได้จากแผงคู่มือข้อมูล หรือโดยการเลือก “การช่วยเหลือพิเศษ” ในเมนูดรอปดาวน์ของเวิร์กชีต ผู้เขียนสามารถเพิ่มข้อความแสดงแทนได้สูงสุด 2500 อักขระ ซึ่งจะให้ข้อมูลเชิงลึกเกี่ยวกับเนื้อหาของการแสดงภาพ
เคล็ดลับเครื่องมือที่รวมในที่เดียว
ดูบริบทเพิ่มเติมสำหรับชิ้นข้อมูลในแถบของคุณด้วยเคล็ดลับเครื่องมือใหม่ เคล็ดลับเครื่องมือที่รวมอยู่ในที่เดียวจะรวมเคล็ดลับเครื่องมือก่อนหน้าสูงสุดหกรายการไว้เป็นเคล็ดลับเดียว โดยจัดลำดับความสำคัญของข้อมูลตามความเกี่ยวข้อง ดูชื่อฟิลด์ รายละเอียดการคำนวณตาราง และความคิดเห็นในฟิลด์ได้จากในที่เดียว ตอนนี้ข้อความแสดงข้อผิดพลาดหรือข้อมูลตัวกรองจะแสดงในเคล็ดลับเครื่องมือเดียวกัน เคล็ดลับเครื่องมือที่รวมในที่เดียวนี้จะใช้ได้กับชิ้นข้อมูลในทุกแถบ
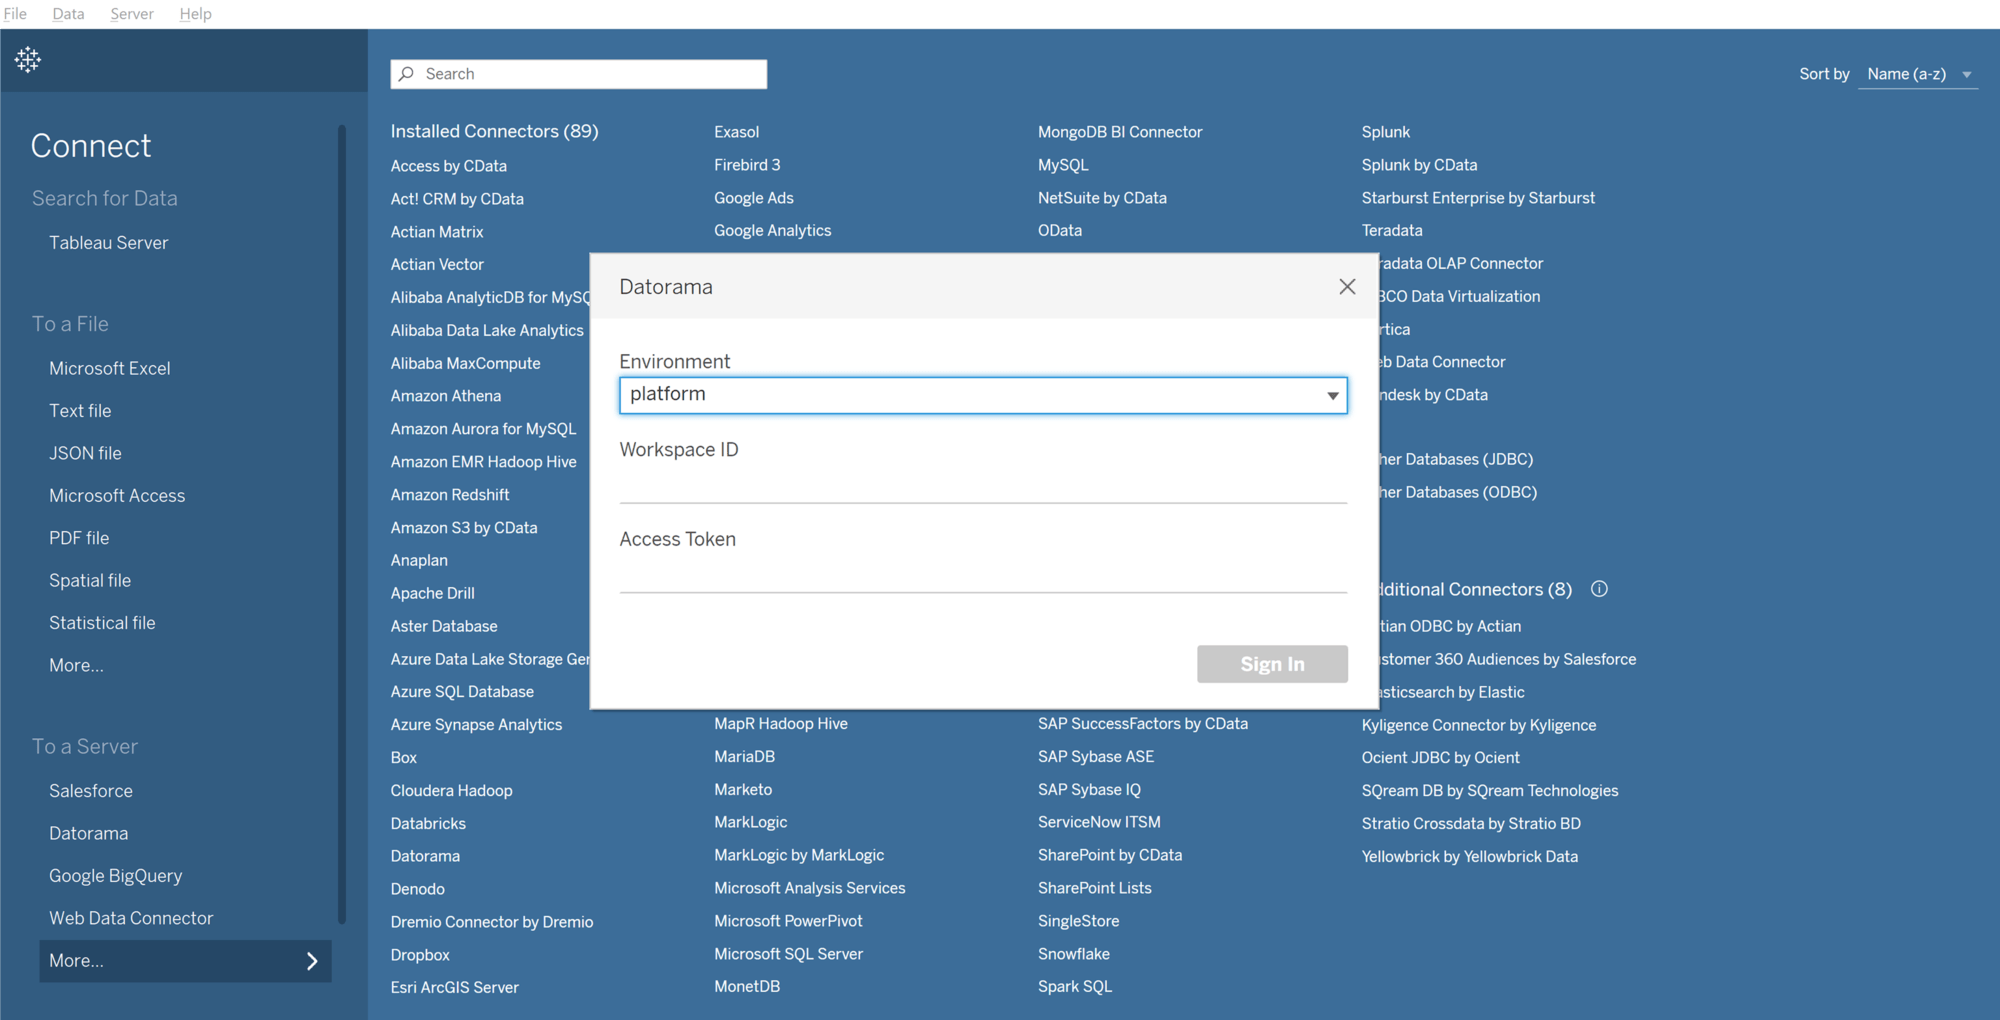
ตัวเชื่อมต่อ Salesforce Data Cloud
ตัวเชื่อมต่อ Salesforce Data Cloud ทำให้การวิเคราะห์ข้อมูลจาก Data Cloud ใน Tableau เป็นไปอย่างราบรื่น ตัวเชื่อมต่อ Data Cloud ไม่ต้องใช้ไดรเวอร์ จึงไม่ต้องติดตั้ง และเมื่อมี Data Space จะช่วยให้คุณสร้างการแสดงเป็นภาพที่กำหนดสำหรับ Data Space ได้ Data Spaces เป็นพาร์ติชันย่อยสำหรับจัดระเบียบข้อมูลเมตา ข้อมูล และกระบวนการสำหรับผู้มีส่วนได้เสียที่เกี่ยวข้องใน Data Cloud นอกจากนี้ ตัวเชื่อมต่อ Data Cloud จะแสดงป้ายกำกับอ็อบเจกต์แทนการแสดงชื่อ API ของอ็อบเจกต์ใน UI การเชื่อมต่อของ Tableau วิธีการนี้จะสร้างประสบการณ์ที่เป็นมิตรต่อผู้ใช้มากขึ้นเมื่อเลือกตารางเพื่อสร้างแหล่งข้อมูล ตัวเชื่อมต่อยังรองรับฟังก์ชันเพิ่มเติม 11 รายการ รวมถึงฟังก์ชันวันที่เวลา เพื่อปรับปรุงกระบวนการสร้างเนื้อหาและวิเคราะห์ข้อมูล
Tableau 2023.1
Tableau 2023.1 มีความสามารถใหม่ที่ช่วยให้ทุกคนสามารถตัดสินใจโดยใช้ข้อมูลเป็นหลัก ไฮไลท์รวมถึง Accelerator Data Mapping, Tableau เพื่อเพิ่มประสิทธิภาพ Slack, พูลข้อมูลประจำตัว และอีกมากมาย
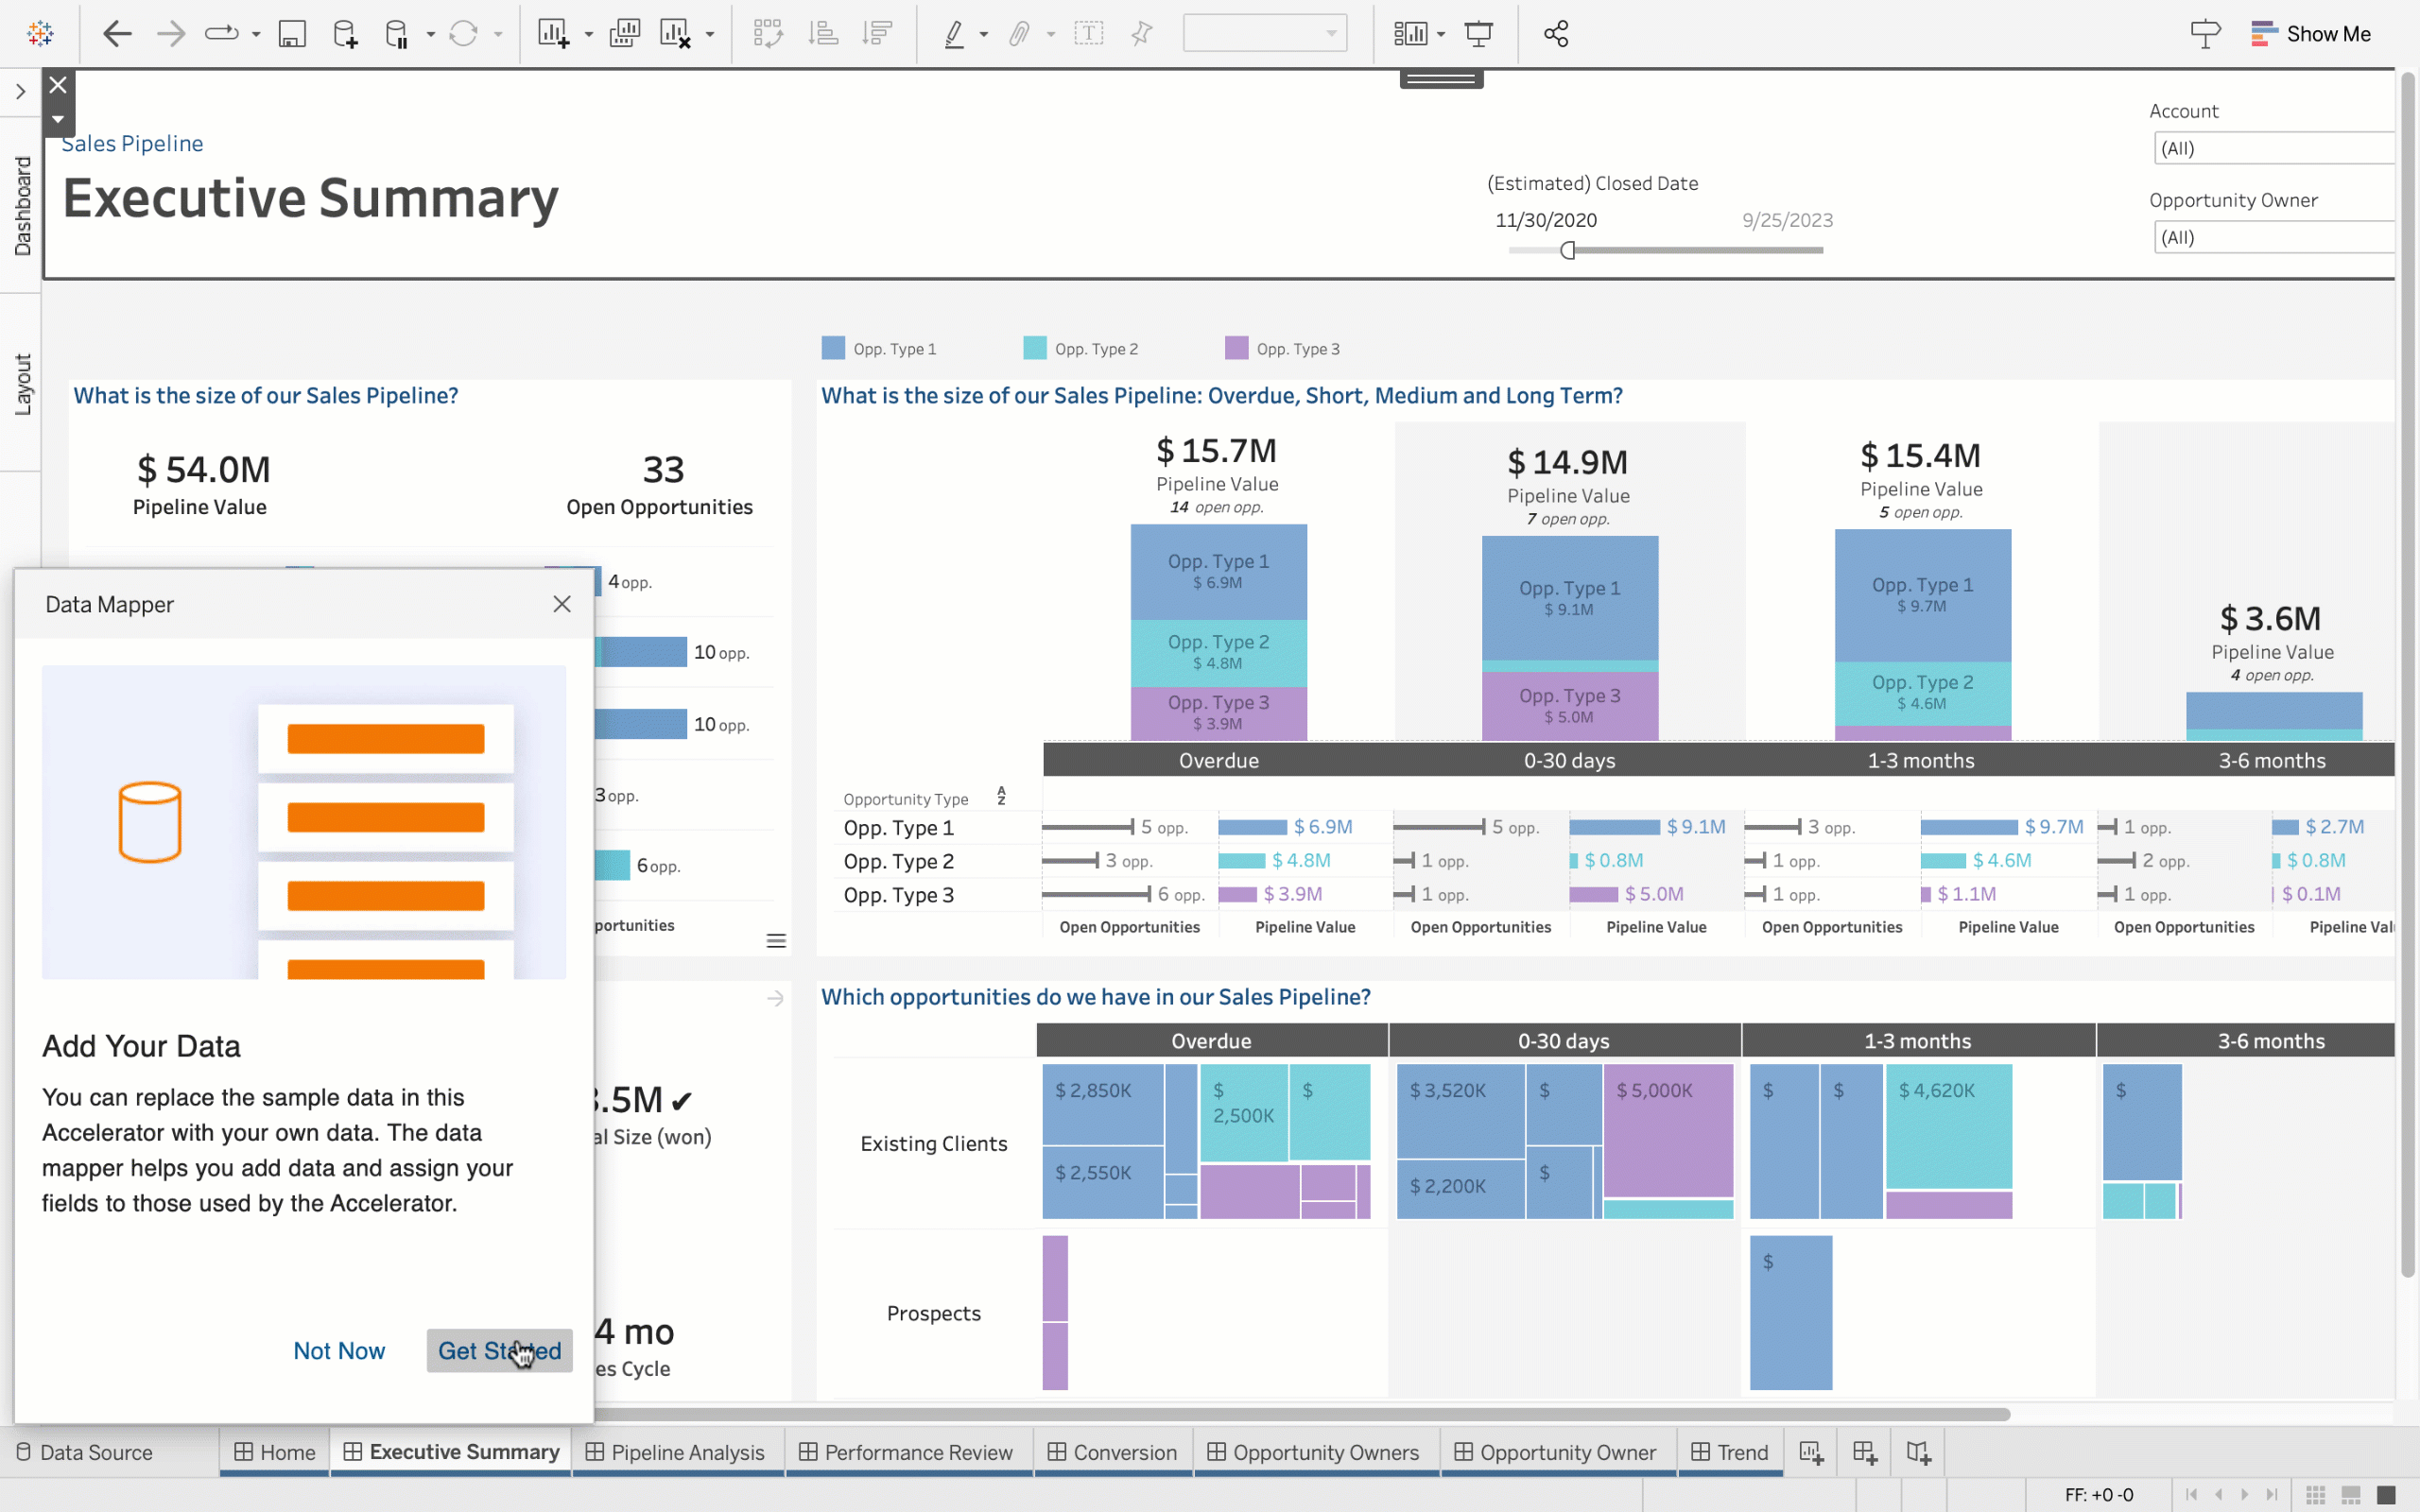
Accelerator Data Mapping
With Data Mapping you can jump start your analytics even faster by reducing the time and effort required to set up an Accelerator’s ready-to-use dashboards. Now, when configuring an Accelerator, the Data Mapper allows users to pull outside data into the Accelerator and map fields from their data source into the fields the Accelerator expects. This will be made possible via the Data Mapping UI - a hybrid dialogue box that opens by default with any Data Mapping enabled Accelerator.
Tableau เพื่อเพิ่มประสิทธิภาพ Slack
ทำงานร่วมกันในข้อมูลเชิงลึกได้อย่างมีประสิทธิภาพยิ่งขึ้นด้วย Tableau สำหรับแอป Slack การปรับปรุงใหม่ล่าสุดทำให้คุณอ้างอิงข้อมูลเป็นศูนย์กลางในทุกการสนทนาและการตัดสินใจได้ง่ายๆ ตอนนี้คุณสามารถทำสิ่งต่อไปนี้ได้แล้ว
- แชร์เนื้อหา Tableau ที่มีบริบท ตอนนี้ลิงก์มาพร้อมการแสดงตัวอย่าง เพื่อให้ทีมของคุณสามารถจดจำและดำเนินการข้อมูลที่เกี่ยวข้องได้อย่างรวดเร็ว
- ค้นหาและแชร์เนื้อหา Tableau ได้ง่ายๆ ในข้อความและช่องทางโดยตรง
- ได้ข้อมูลเชิงลึกเร็วขึ้นโดยเข้าถึงข้อมูลล่าสุดที่คุณชื่นชอบจากหน้าหลักของแอปได้อย่างสะดวก
ชื่อแกนแบบไดนามิก
ผู้ใช้สามารถเปลี่ยนชื่อของแกนตามค่าพารามิเตอร์หรือฟิลด์ข้อมูลแบบค่าเดี่ยวด้วยชื่อแกนแบบไดนามิก
พูลข้อมูลประจำตัวสำหรับ Tableau Server
พูลข้อมูลประจำตัวจะช่วยให้คุณขยายข้อจำกัดของที่จัดเก็บข้อมูลประจำตัวเดียวอันแสนเข้มงวดใน Tableau Server พูลข้อมูลประจำตัวคือการรวมกันของ “แหล่งที่มาของผู้ใช้” ซึ่งแต่เดิมเรียกว่าที่จัดเก็บข้อมูลประจำตัว (Identity Store) และกลไกการตรวจสอบสิทธิ์ ฟีเจอร์นี้จะช่วยให้คุณสามารถเพิ่มกลุ่มเพิ่มเติม โดยที่คุณสามารถกำหนดให้แหล่งที่มาของผู้ใช้อยู่ในที่เก็บข้อมูลประจำตัวภายในเครื่อง และให้รับการตรวจสอบสิทธิ์ด้วย OpenID Connect สำหรับการตรวจสอบสิทธิ์แบบใหม่ การเพิ่มความยืดหยุ่นนี้จะเป็นประโยชน์อย่างยิ่งสำหรับองค์กรที่มีชุดผู้ใช้ภายนอกที่ต้องการเข้าถึง Tableau แต่ไม่สามารถเชิญให้เข้าร่วม Active Directory ขององค์กรได้
ฟังก์ชันแอตทริบิวต์ผู้ใช้ (User Attribute Function - UAF)
ฟังก์ชันแอตทริบิวต์ผู้ใช้ (UAF) คือฟังก์ชันผู้ใช้ใหม่ล่าสุด - UserAttribute() และ UserAttributeMatches() ที่ช่วยให้คุณใช้แอตทริบิวต์ของผู้ใช้ที่กำหนดระหว่างขั้นตอนการเข้าสู่ระบบแอปที่เชื่อมต่อในการคำนวณได้ โดยสามารถใช้ฟังก์ชันเหล่านี้เพื่อสร้างตัวกรองแหล่งข้อมูลสำหรับการรักษาความปลอดภัยระดับแถว นอกเหนือจากชื่อผู้ใช้และกลุ่ม (เช่น แผนก ภูมิภาค ฯลฯ) ซึ่งช่วยให้คุณปรับแต่งการเข้าถึงข้อมูลของผู้ใช้ในสถานการณ์แบบฝังได้

รองรับเบราว์เซอร์ที่ไม่ใช่ Safari สำหรับการตรวจสอบสิทธิ์บนมือถือ
ตอนนี้ผู้ดูแลระบบสามารถระบุเบราว์เซอร์ เช่น Microsoft Edge เพื่อให้การตรวจสอบสิทธิ์ใช้ตรวจสอบการเข้าถึงแบบมีเงื่อนไขได้แล้ว ผู้ดูแลระบบสามารถแทนที่เบราว์เซอร์เริ่มต้นที่ใช้สำหรับการตรวจสิทธิ์ด้วยการกำหนดค่าที่เหมาะสมสำหรับ Tableau Mobile และสภาพแวดล้อม Microsoft Intune ของคุณ
Tableau 2022.4
Tableau 2022.4 นำเสนอความสามารถใหม่เพื่อประหยัดเวลาและความพยายามของคุณ จุดเด่นประกอบด้วยการดำเนินการภายนอกของ Tableau, Reviewed เมตริกการใช้งาน, แนวคิดจากชุมชน Tableau และอื่นๆ
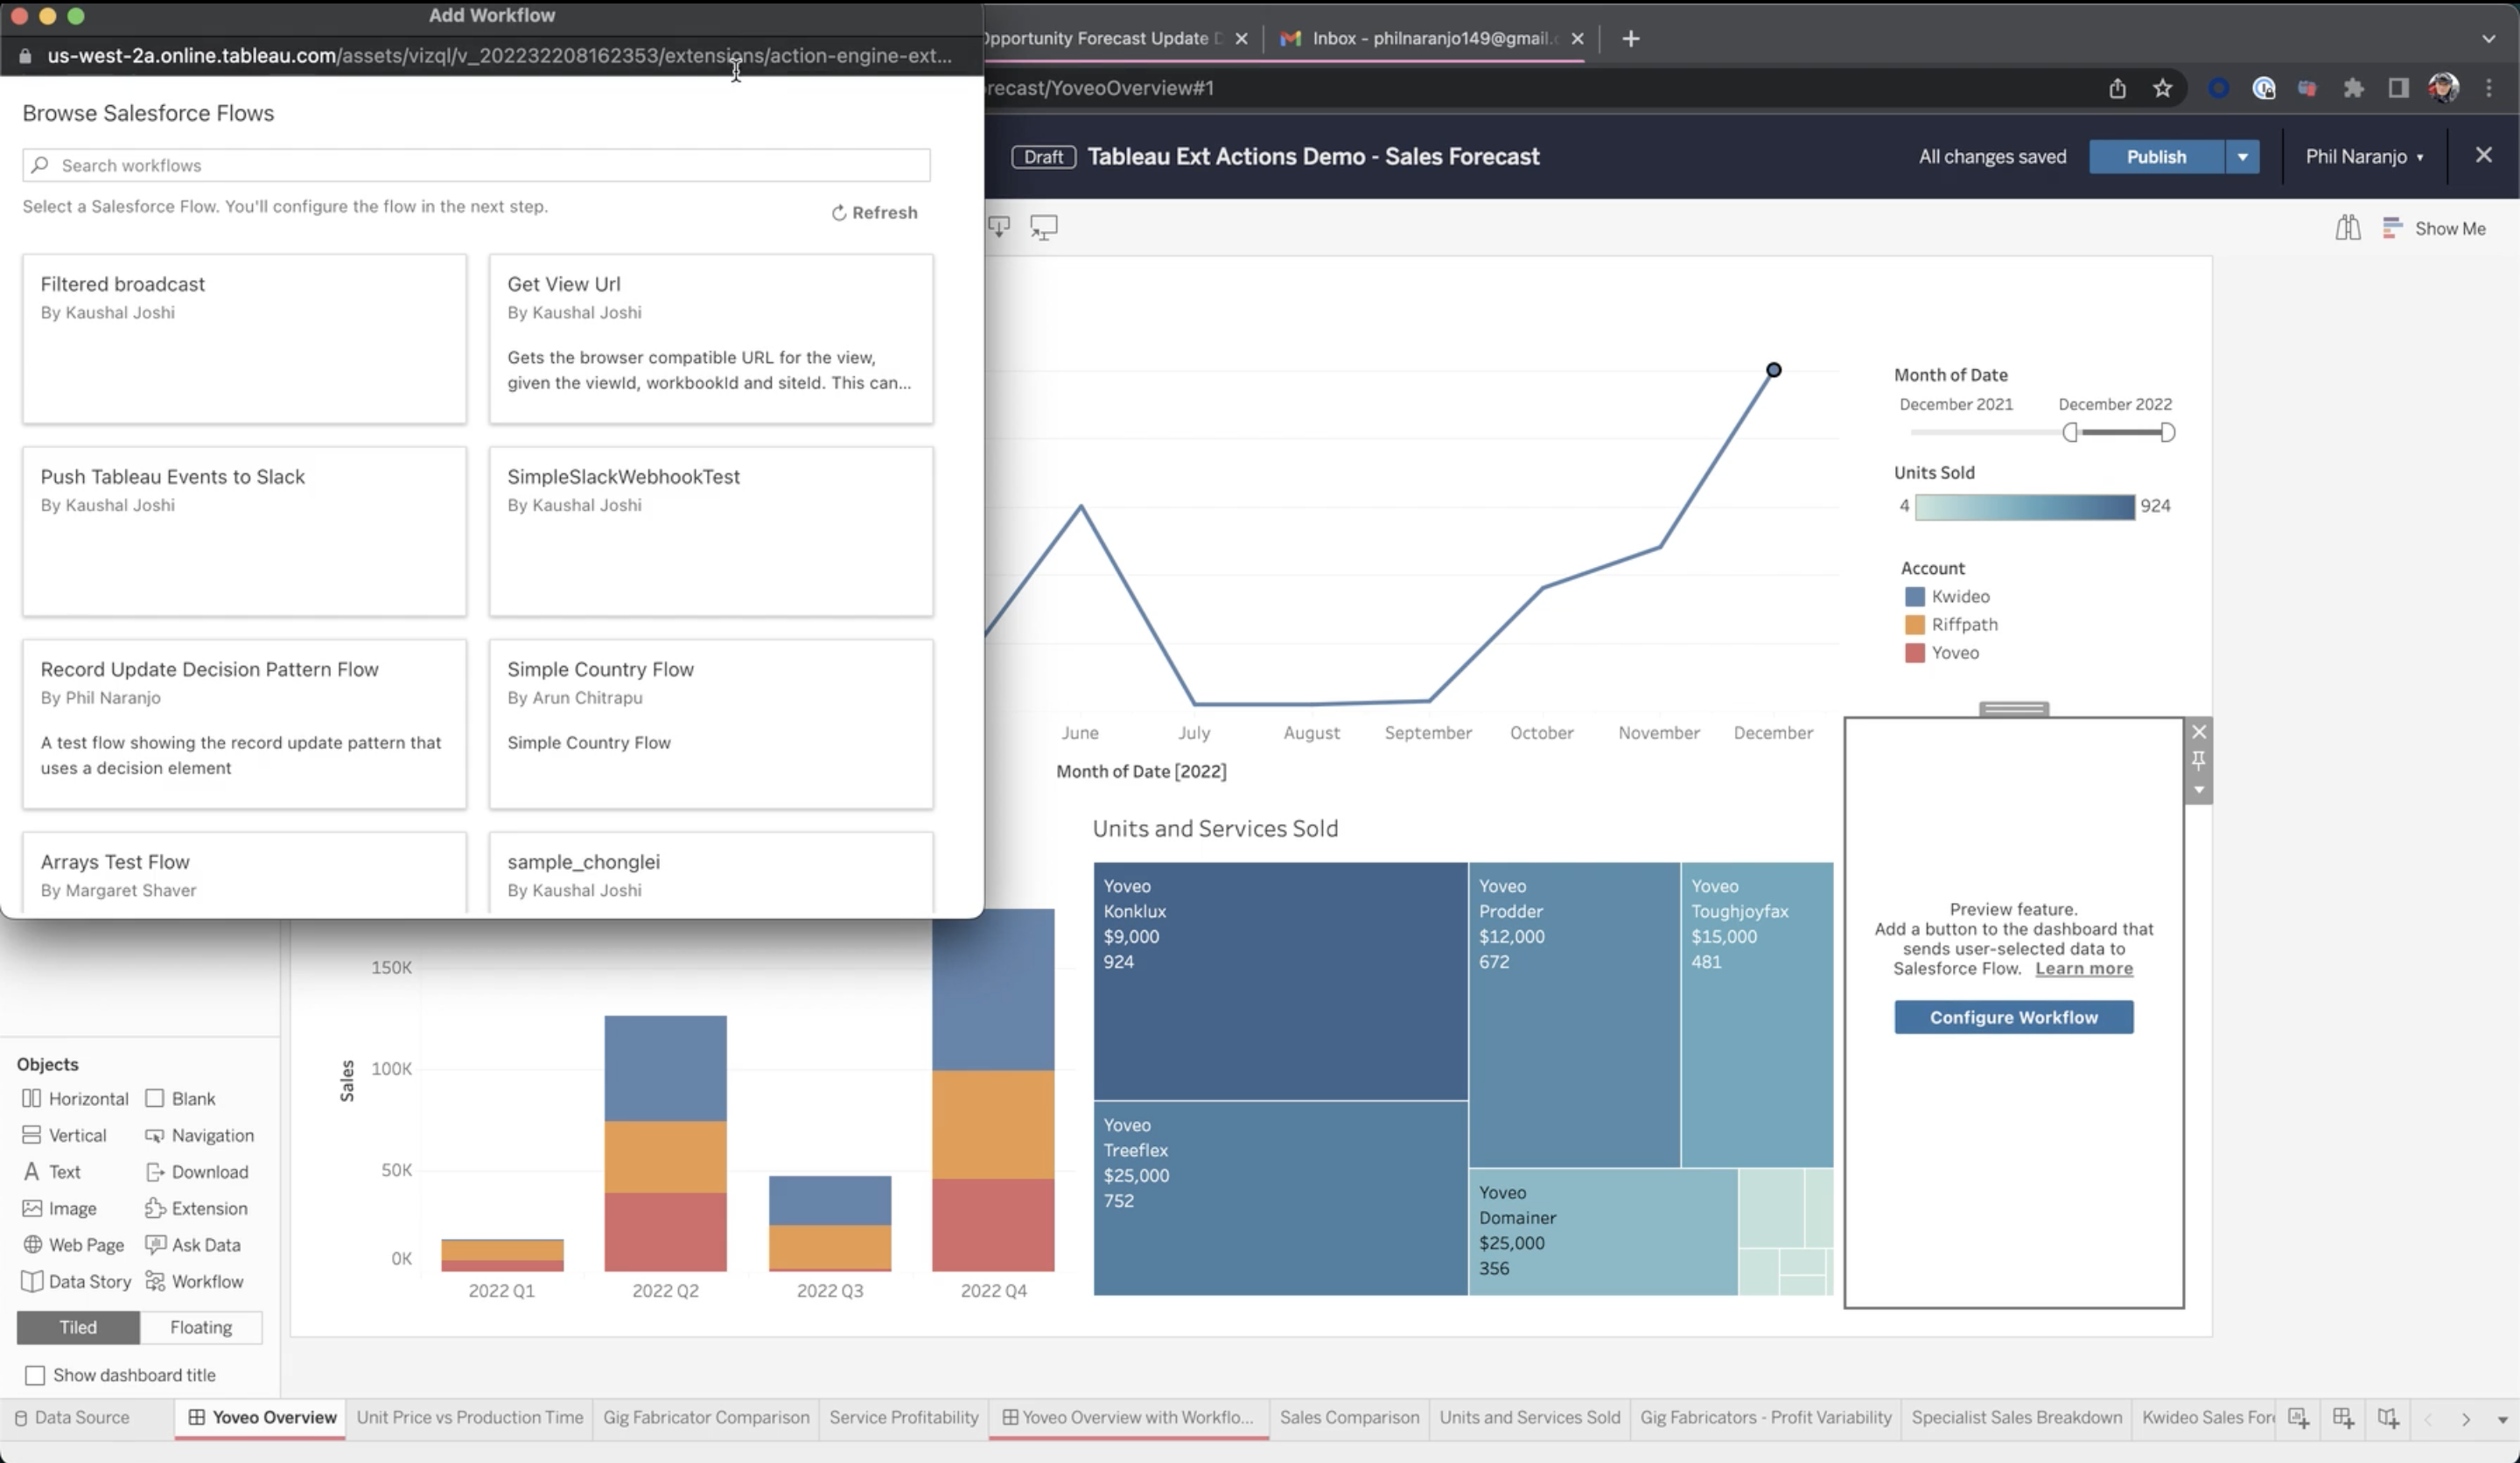
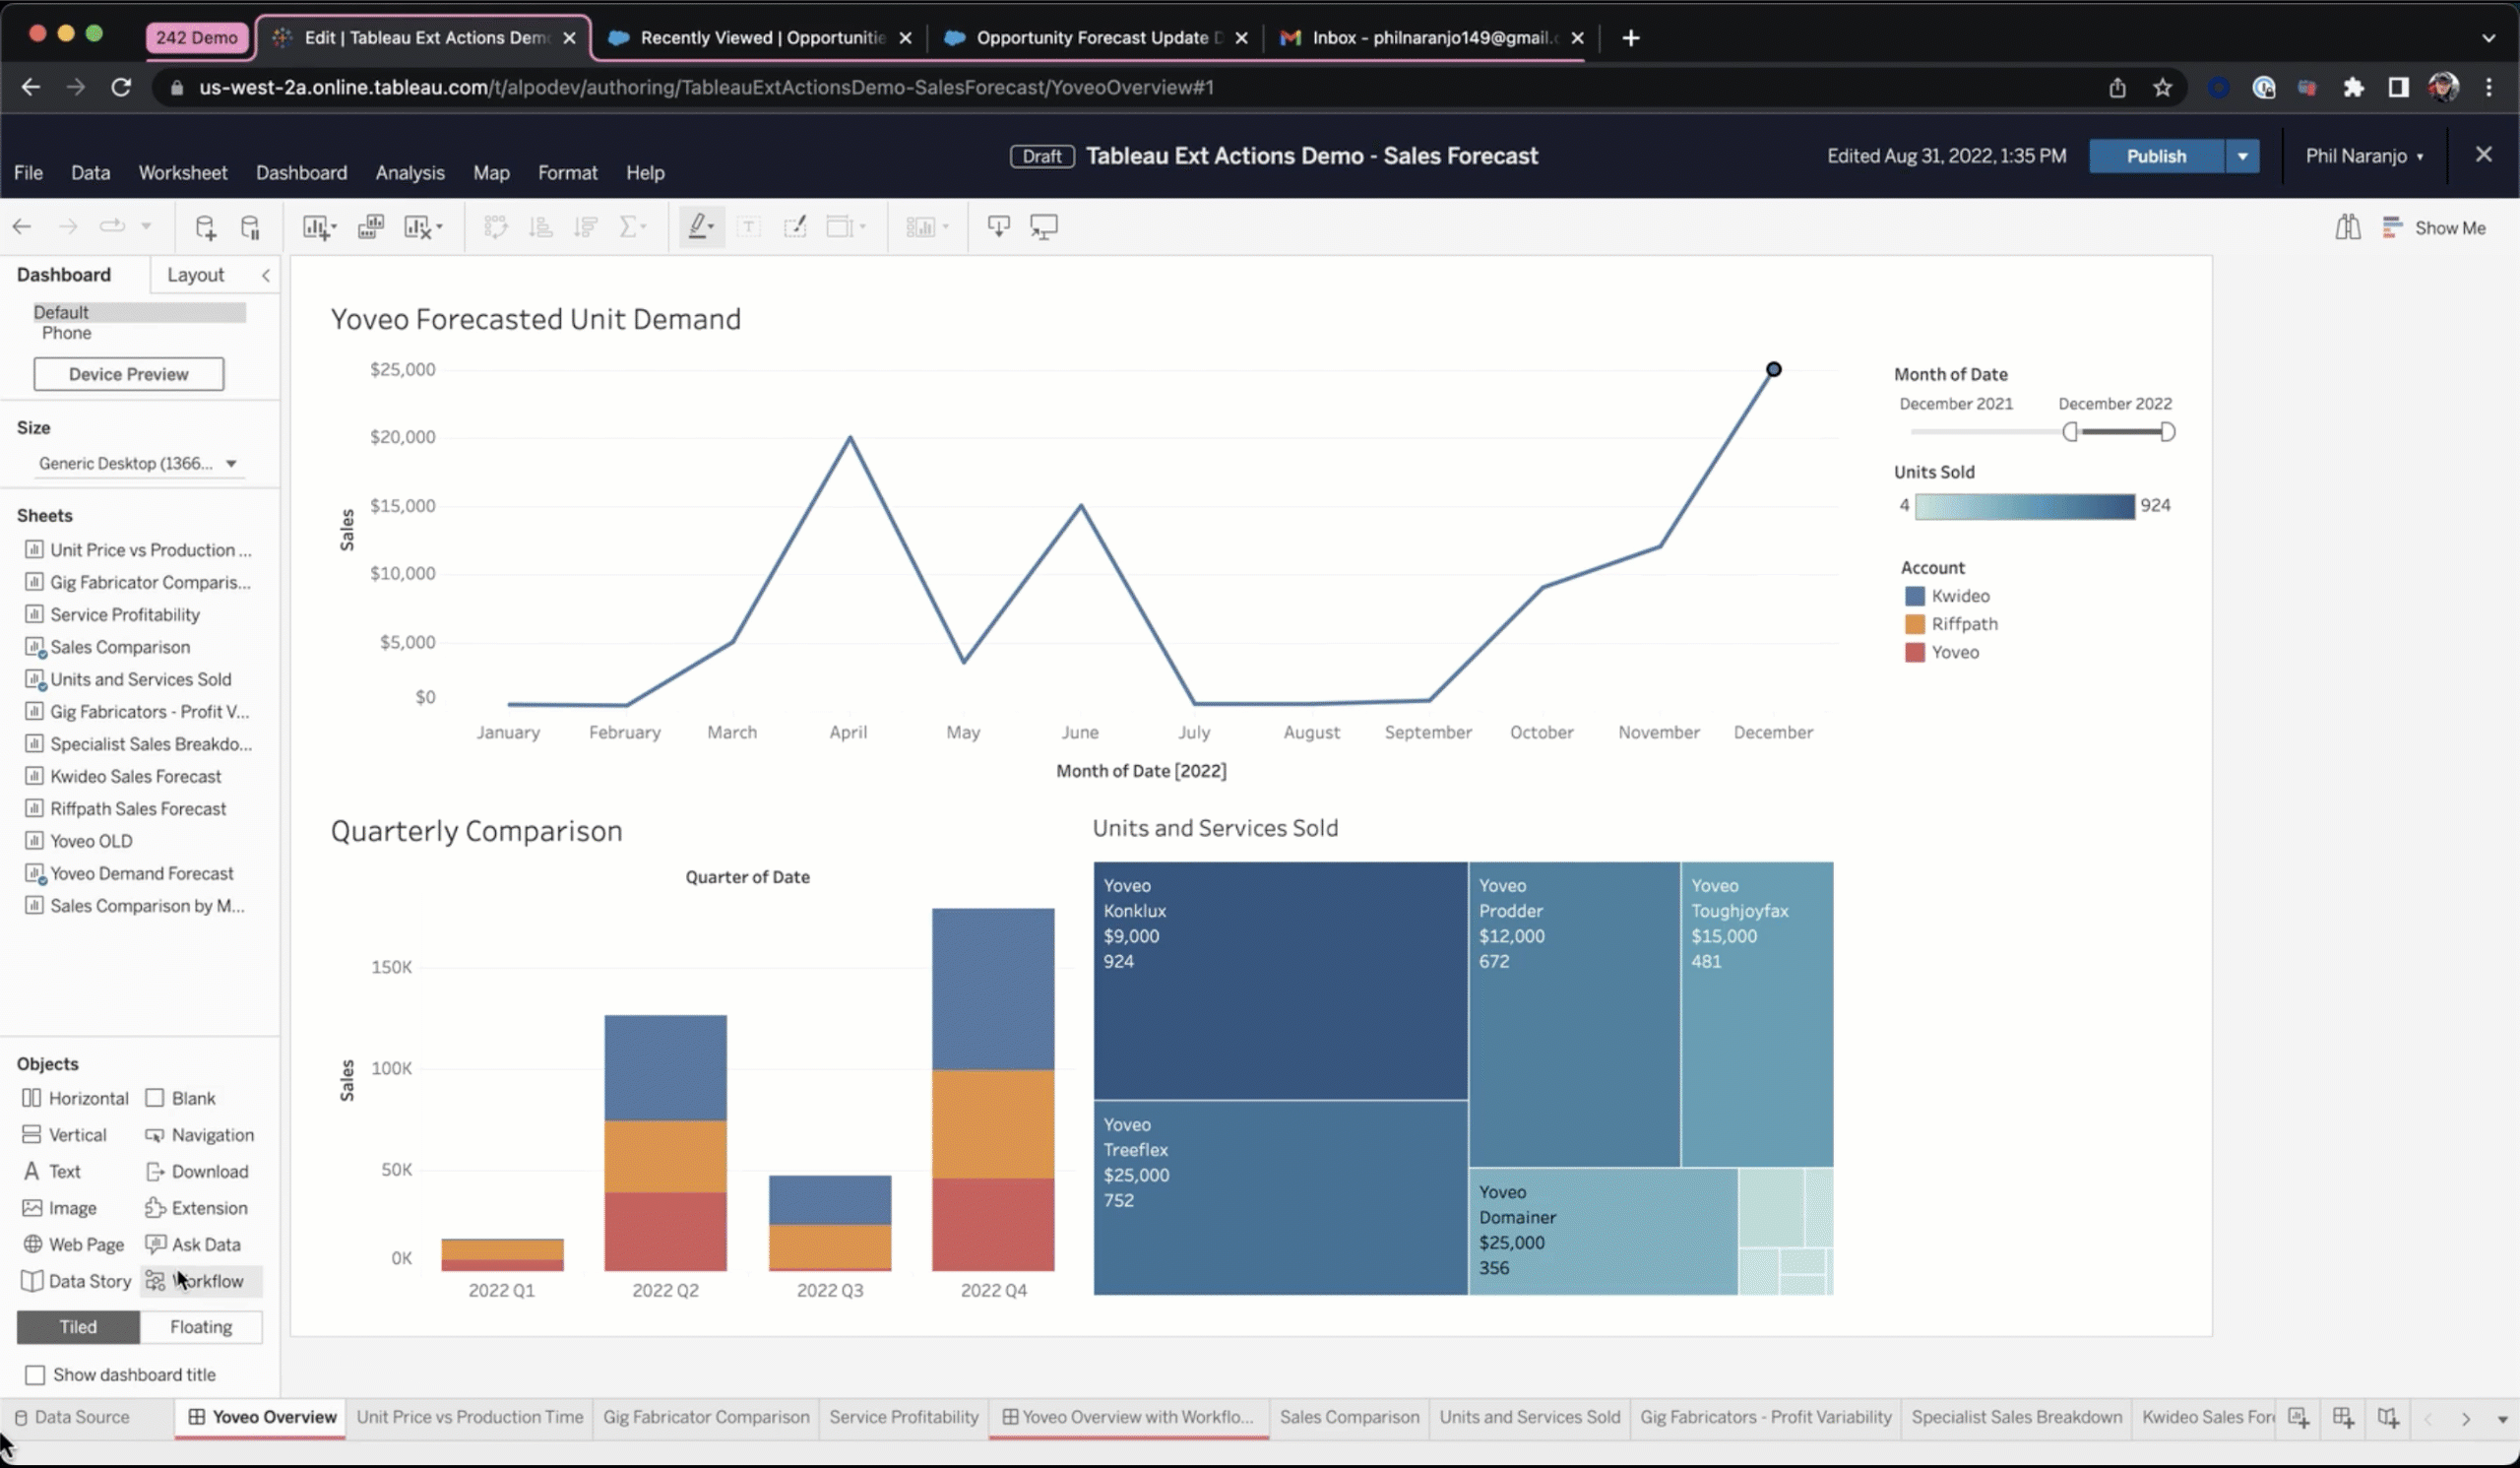
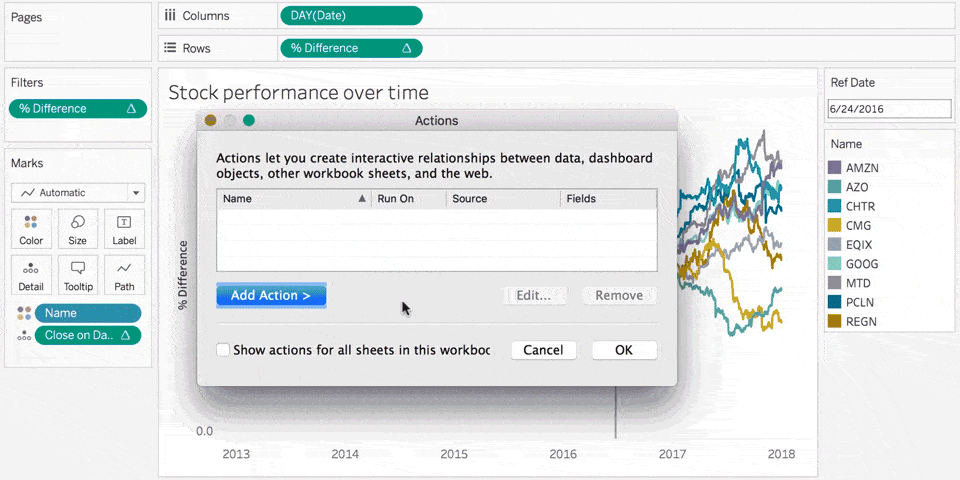
Tableau External Actions
Tableau External Actions มอบการผสานรวมการทำงานแบบเนทีฟกับ Salesforce Flows เพื่อทำให้กระบวนการทางธุรกิจเป็นระบบอัตโนมัติซึ่งจะช่วยประหยัดเวลาและค่าใช้จ่ายของคุณ เมื่อเชื่อมต่อแดชบอร์ดของคุณกับ Salesforce คุณจะสามารถทำการตัดสินใจในบริบทและเรียกใช้โฟลว์ได้โดยไม่ต้องออกจาก Tableau ตอนนี้ คุณสามารถส่งต่อกรณี ส่งใบแจ้งหนี้ของลูกค้า และอื่นๆ ได้ด้วยการคลิกเพียงปุ่มเดียว
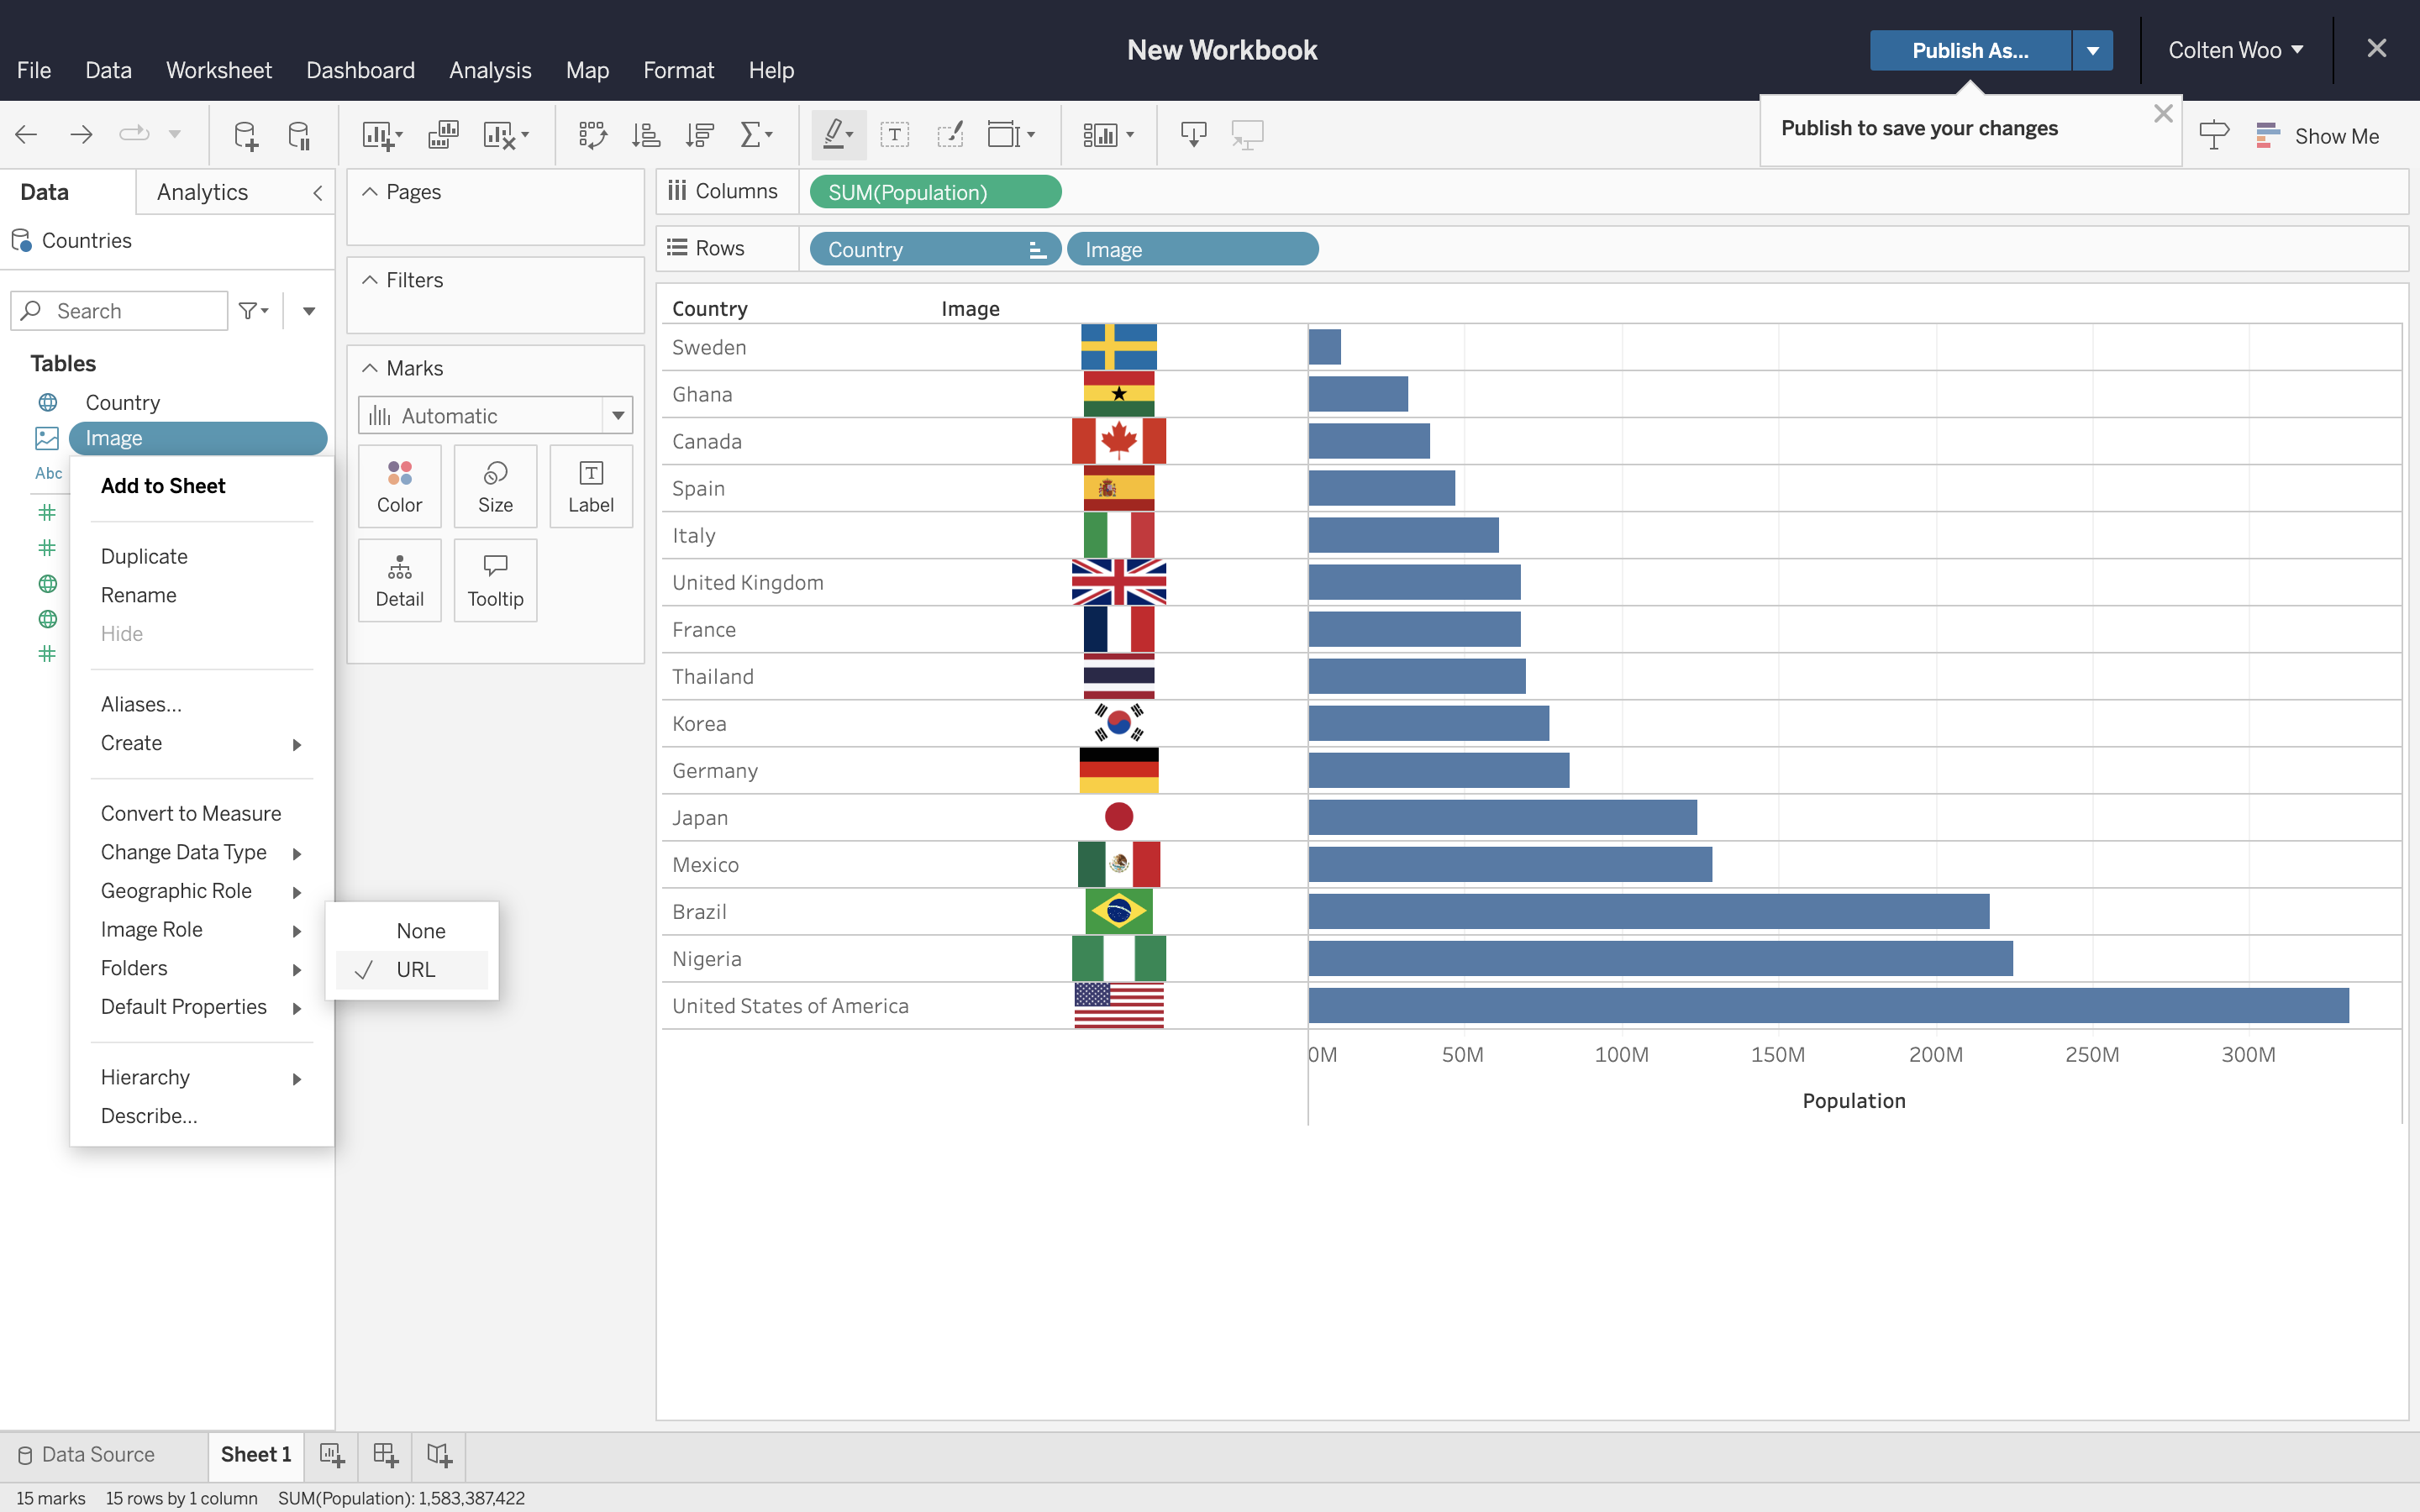
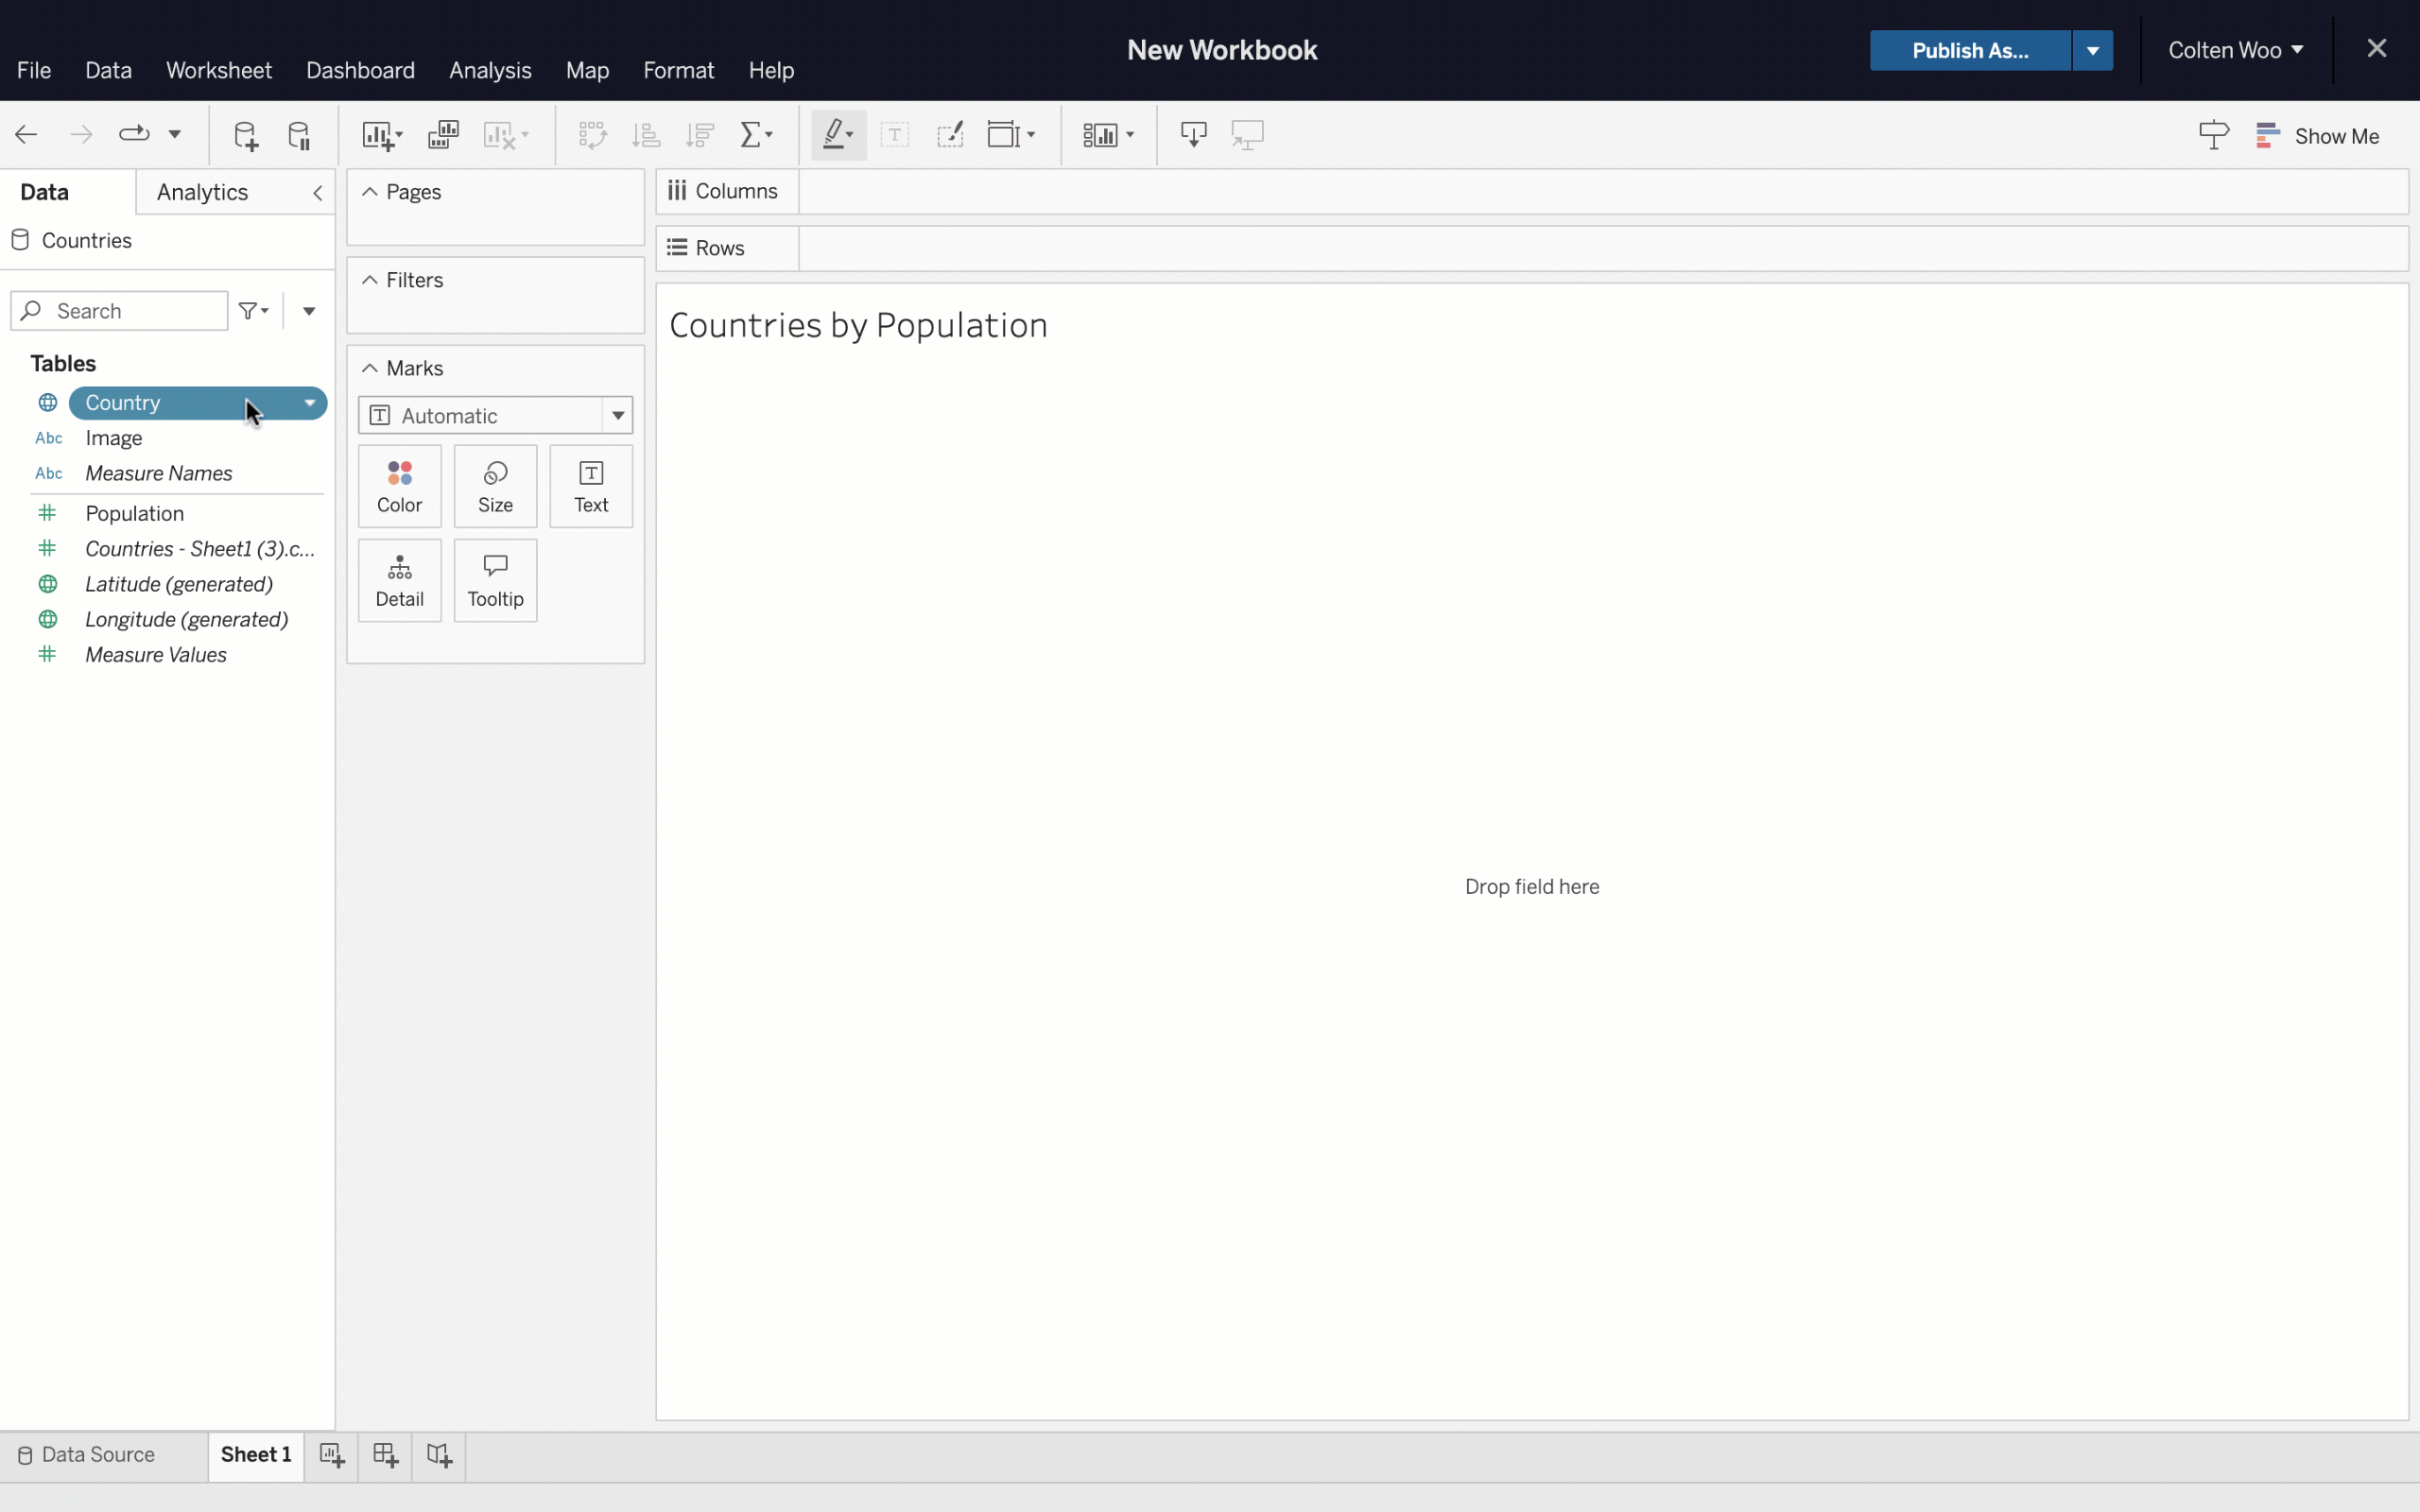
Image Role
ปรับปรุงความเข้าใจเชิงลึกและช่วยให้ผู้ใช้เชื่อมต่อและเข้าใจการแสดงภาพได้ดีขึ้นโดยใช้ Image Role Image Role เป็นความหมายช่องข้อมูลใหม่ที่จะให้วิธีที่ปรับขนาดได้และเป็นอัตโนมัติในการนำเนื้อหารูปภาพมายัง Tableau ตอนนี้ Tableau สามารถแมปรูปภาพแบบไดนามิกกับลิงก์ในข้อมูลของคุณ และเข้ารหัสเป็นแถวหรือส่วนหัวของคอลัมน์ที่สามารถส่งออกได้ ความสามารถใหม่นี้จะทำให้สามารถจัดการเนื้อหารูปภาพจากภายนอกเพื่อป้องกันไม่ให้ขนาดของเวิร์กบุ๊กใหญ่เกินไปที่จะเก็บรักษาและแชร์ได้ ข้อมูลเพิ่มเติมที่นี่
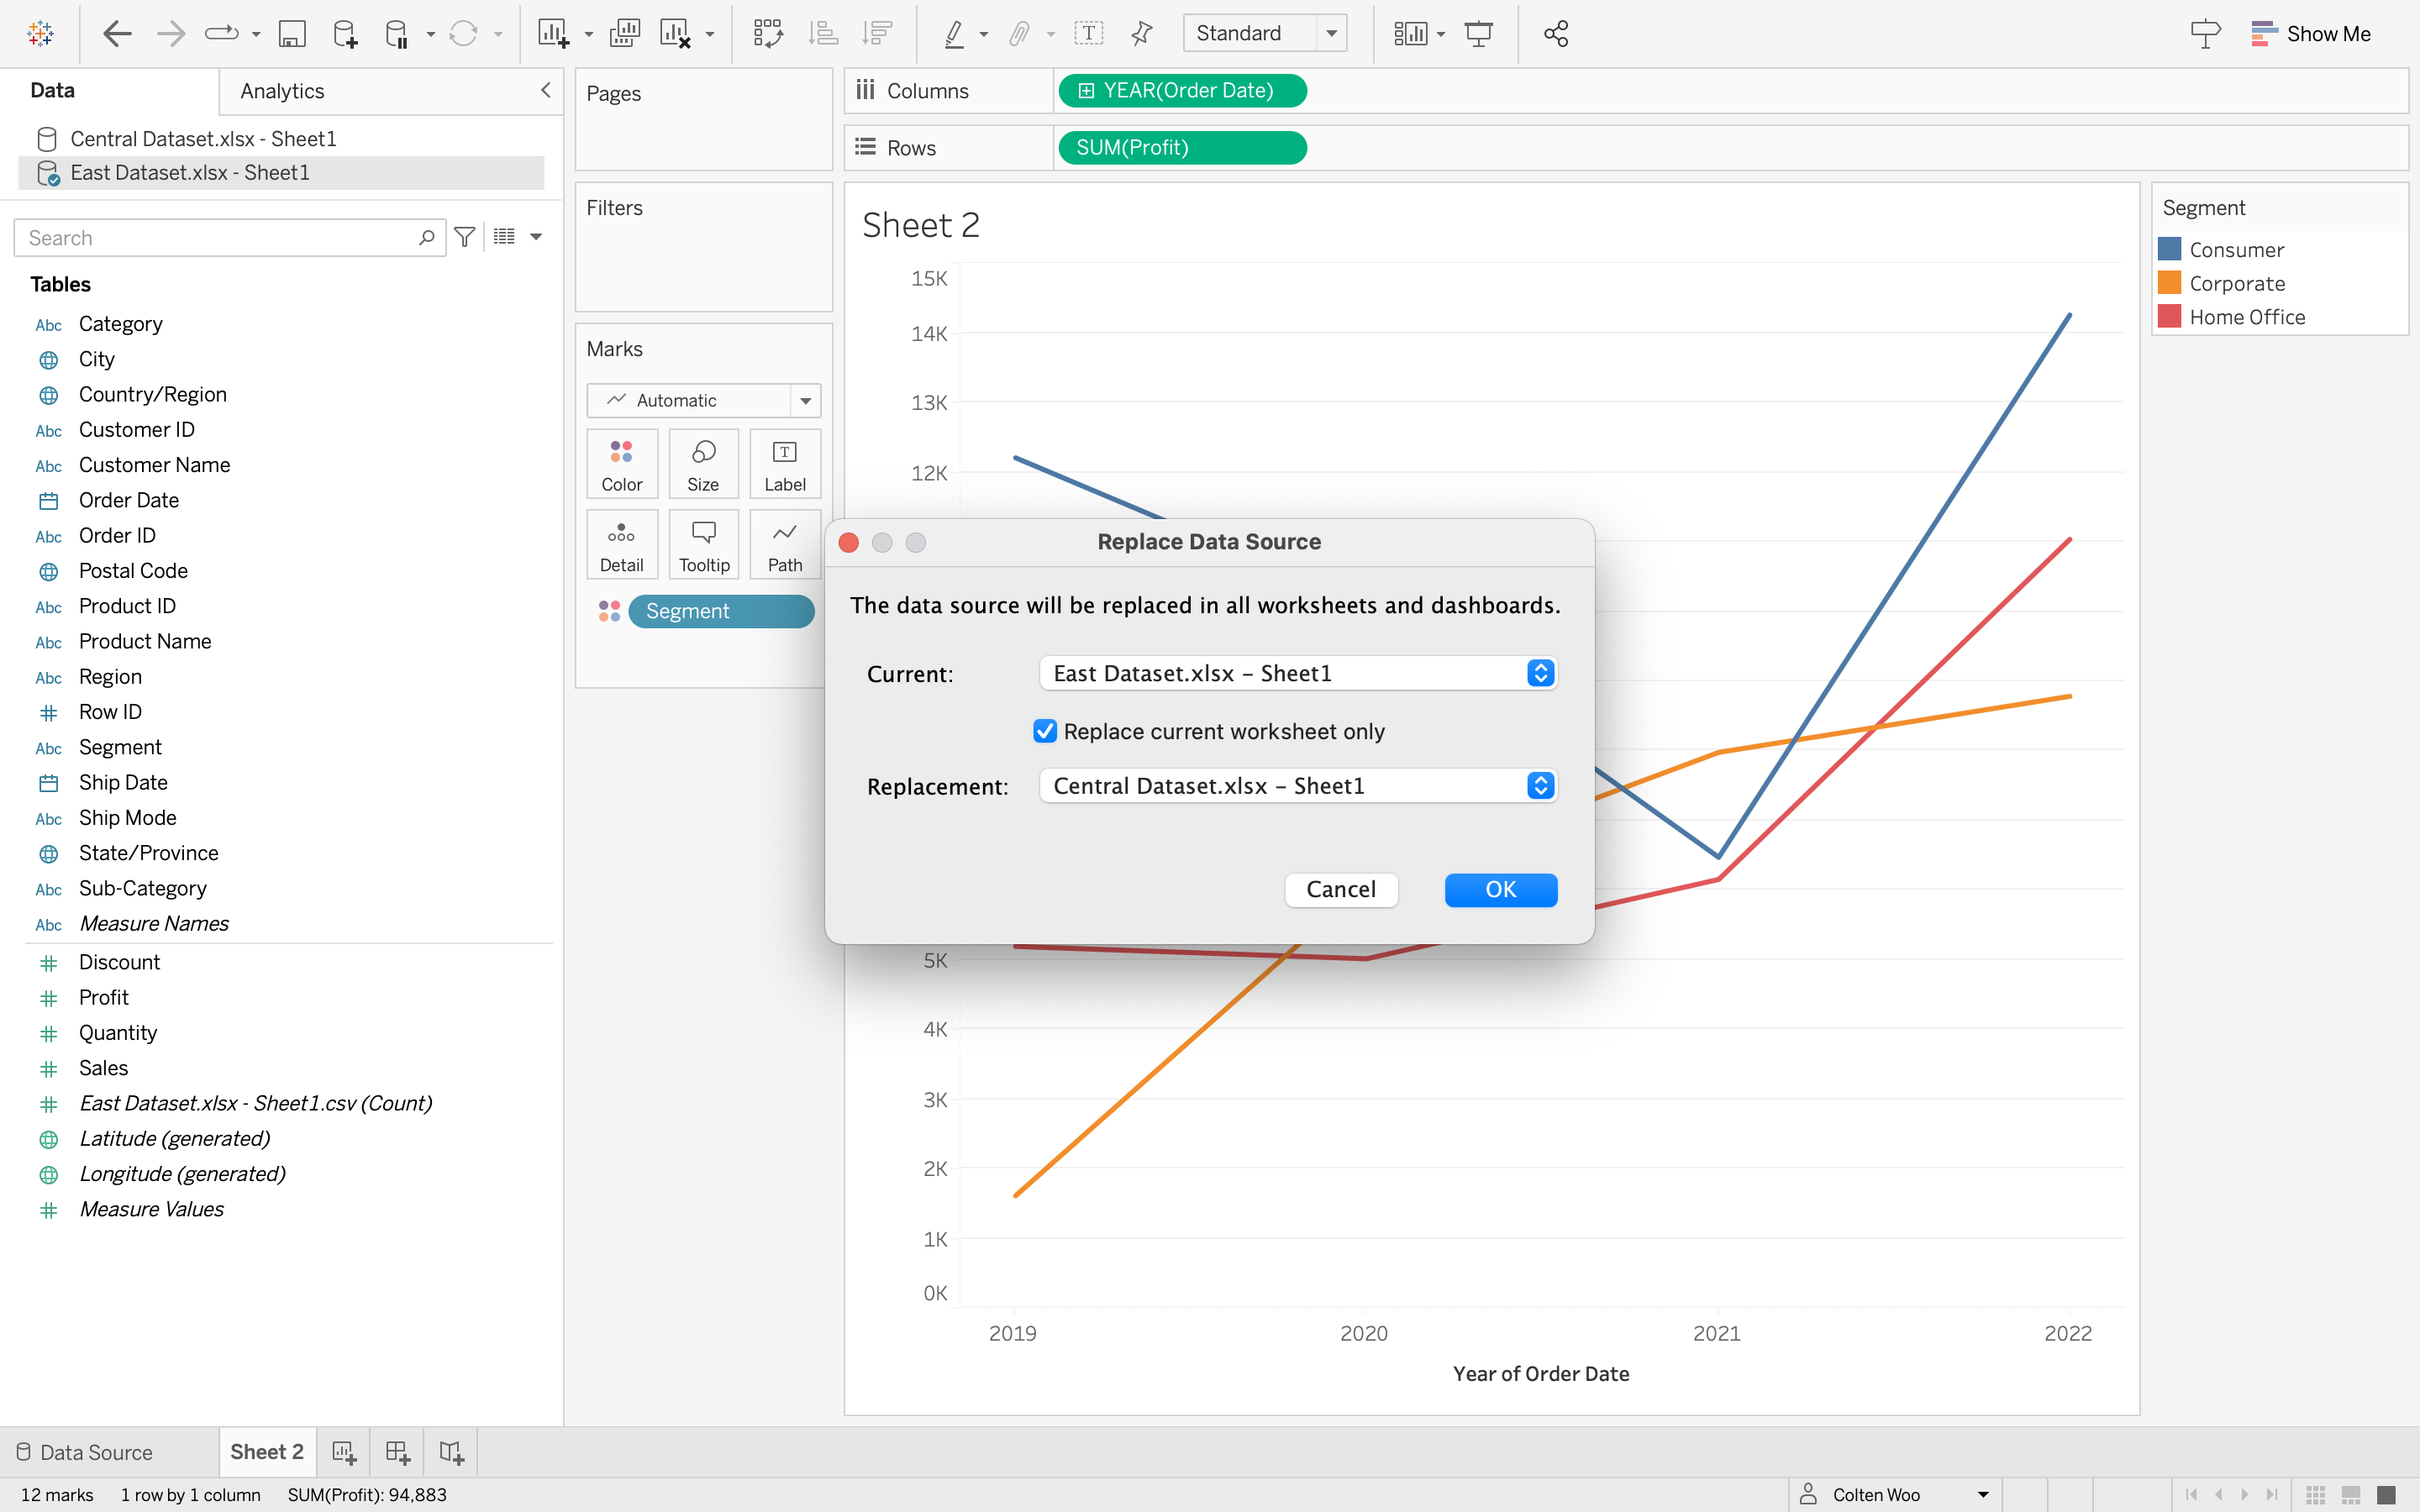
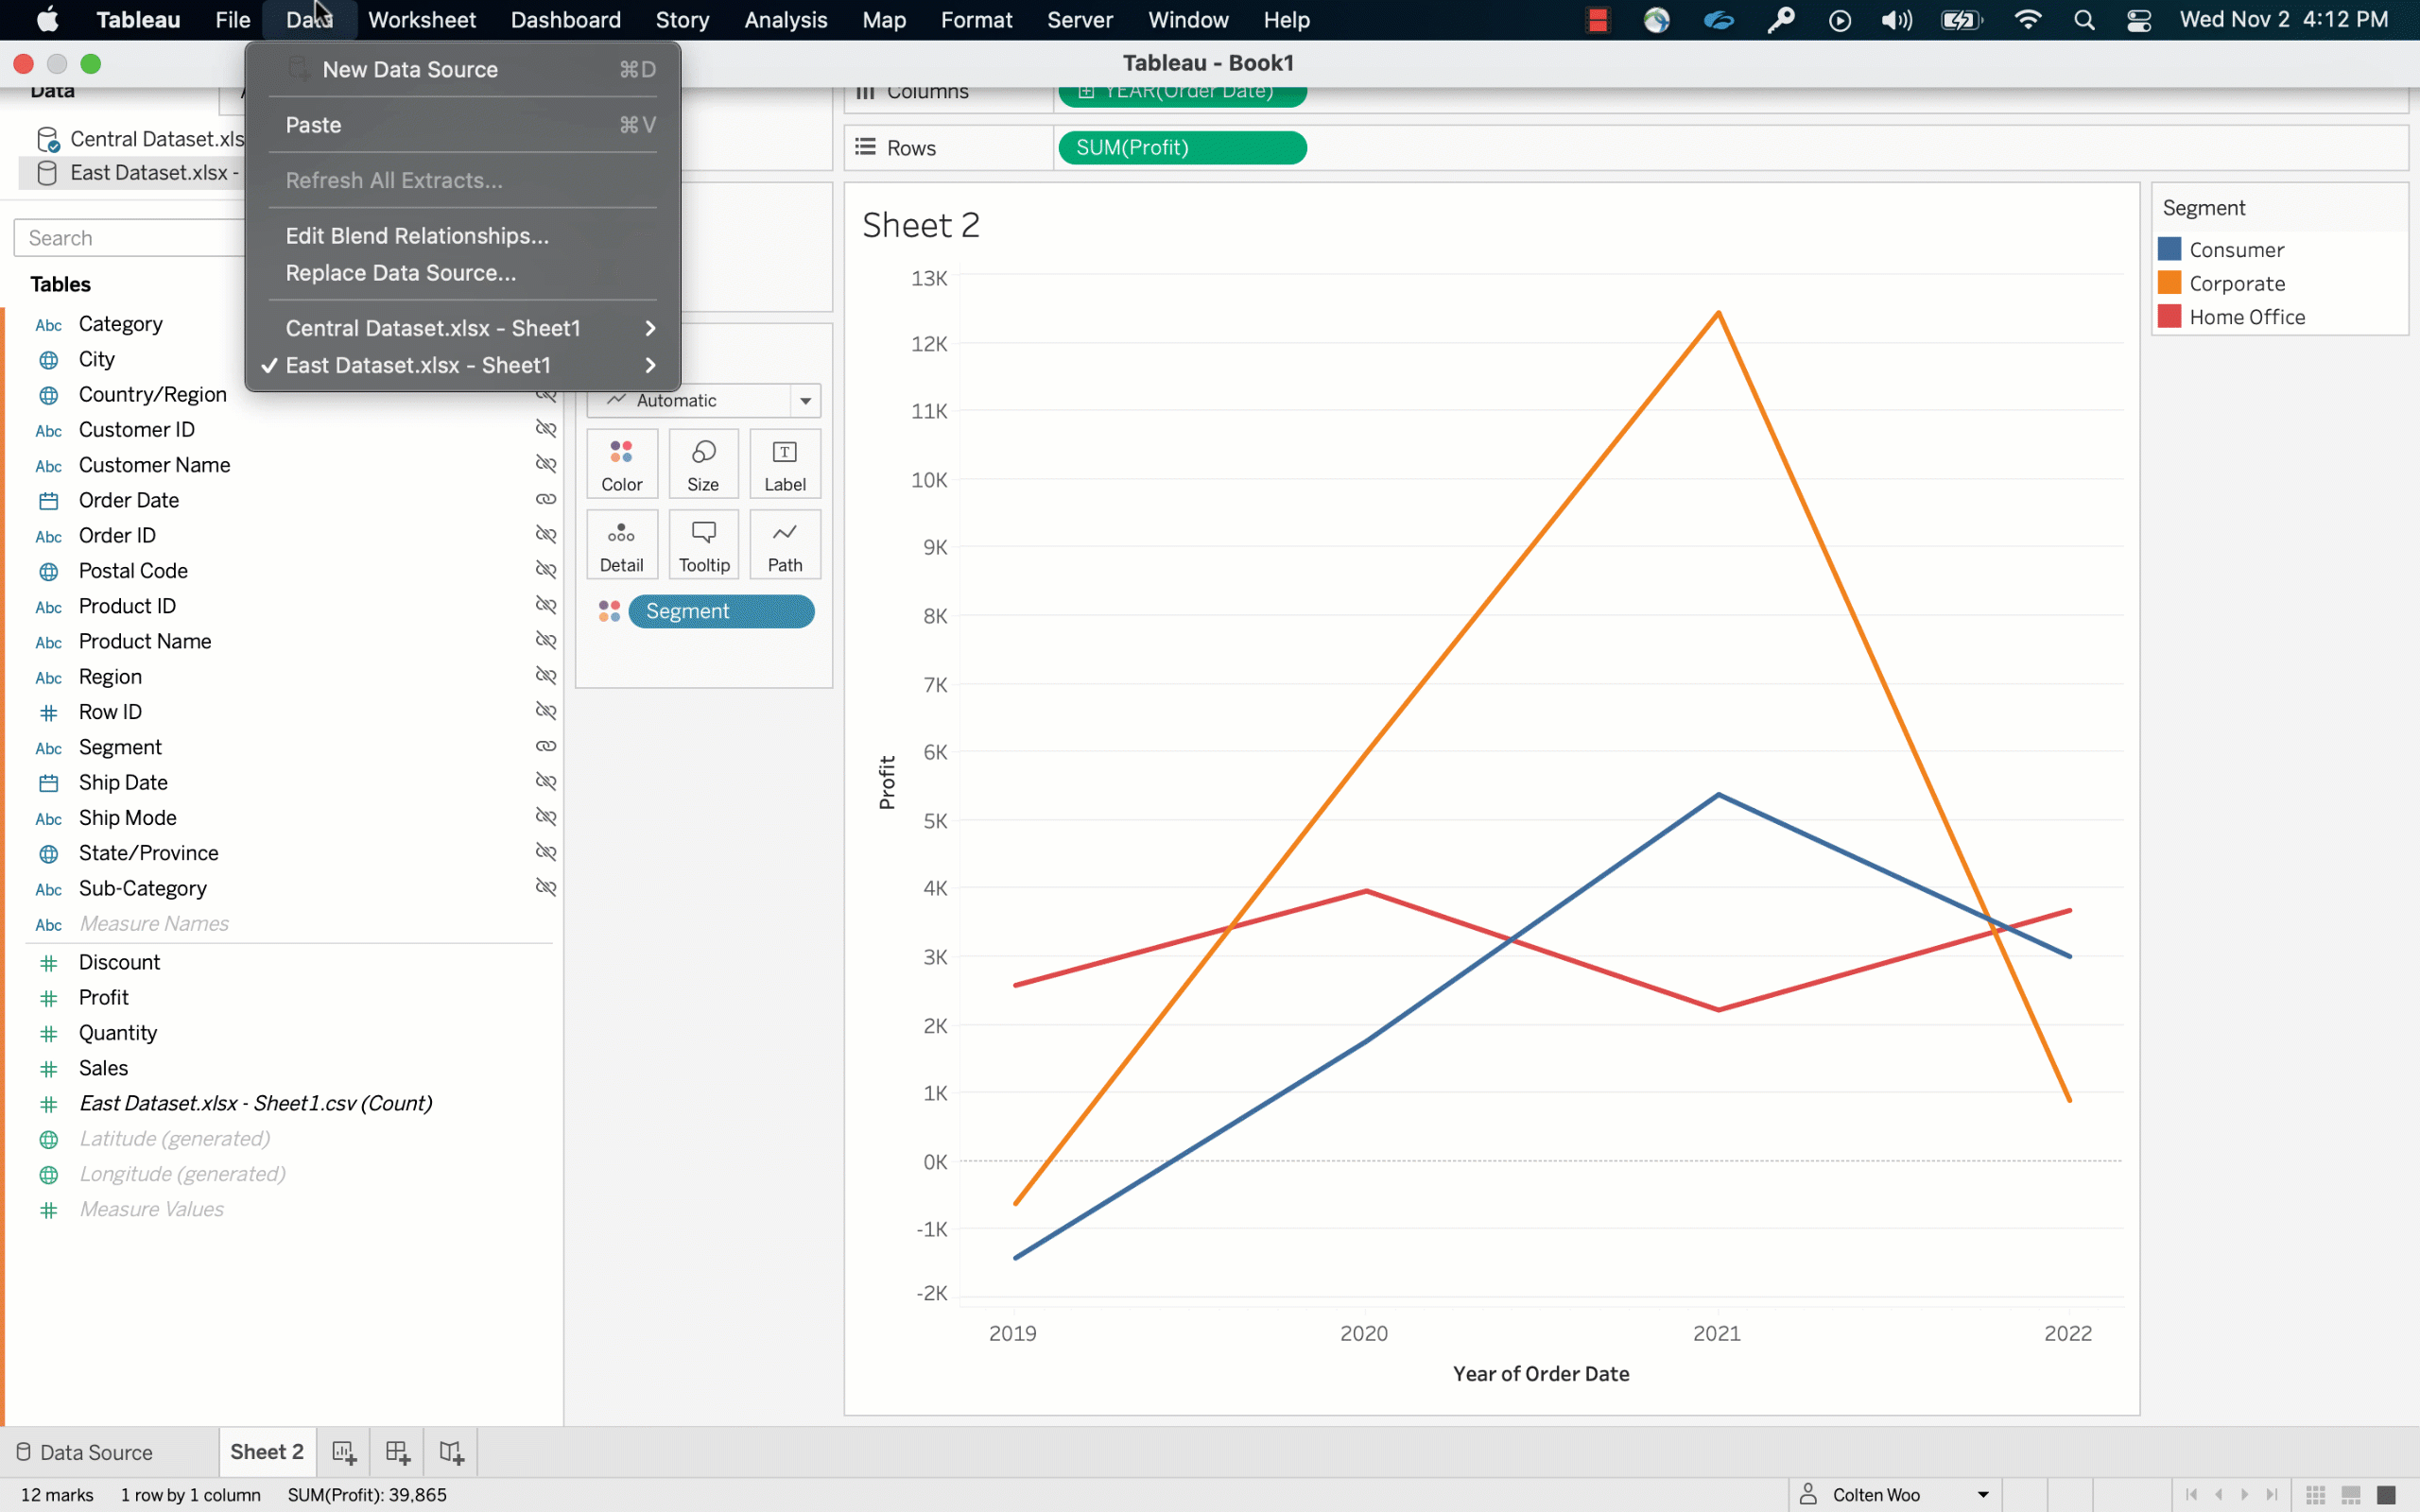
แทนที่แหล่งข้อมูลทีละชีต
เลือกแทนที่แหล่งข้อมูลในระดับเวิร์กชีตโดยไม่ต้องใช้วิธีแก้ปัญหาที่ซับซ้อน ก่อนนี้ การแทนที่แหล่งข้อมูลจะมีผลกับเวิร์กชีตทั้งหมดในเวิร์กบุ๊กที่ใช้แหล่งข้อมูลนั้น แต่ตอนนี้คุณสามารถควบคุมได้มากขึ้น โดยการเลือกที่จะใช้การเปลี่ยนแปลงแหล่งข้อมูลกับเวิร์กชีตปัจจุบันเท่านั้นได้
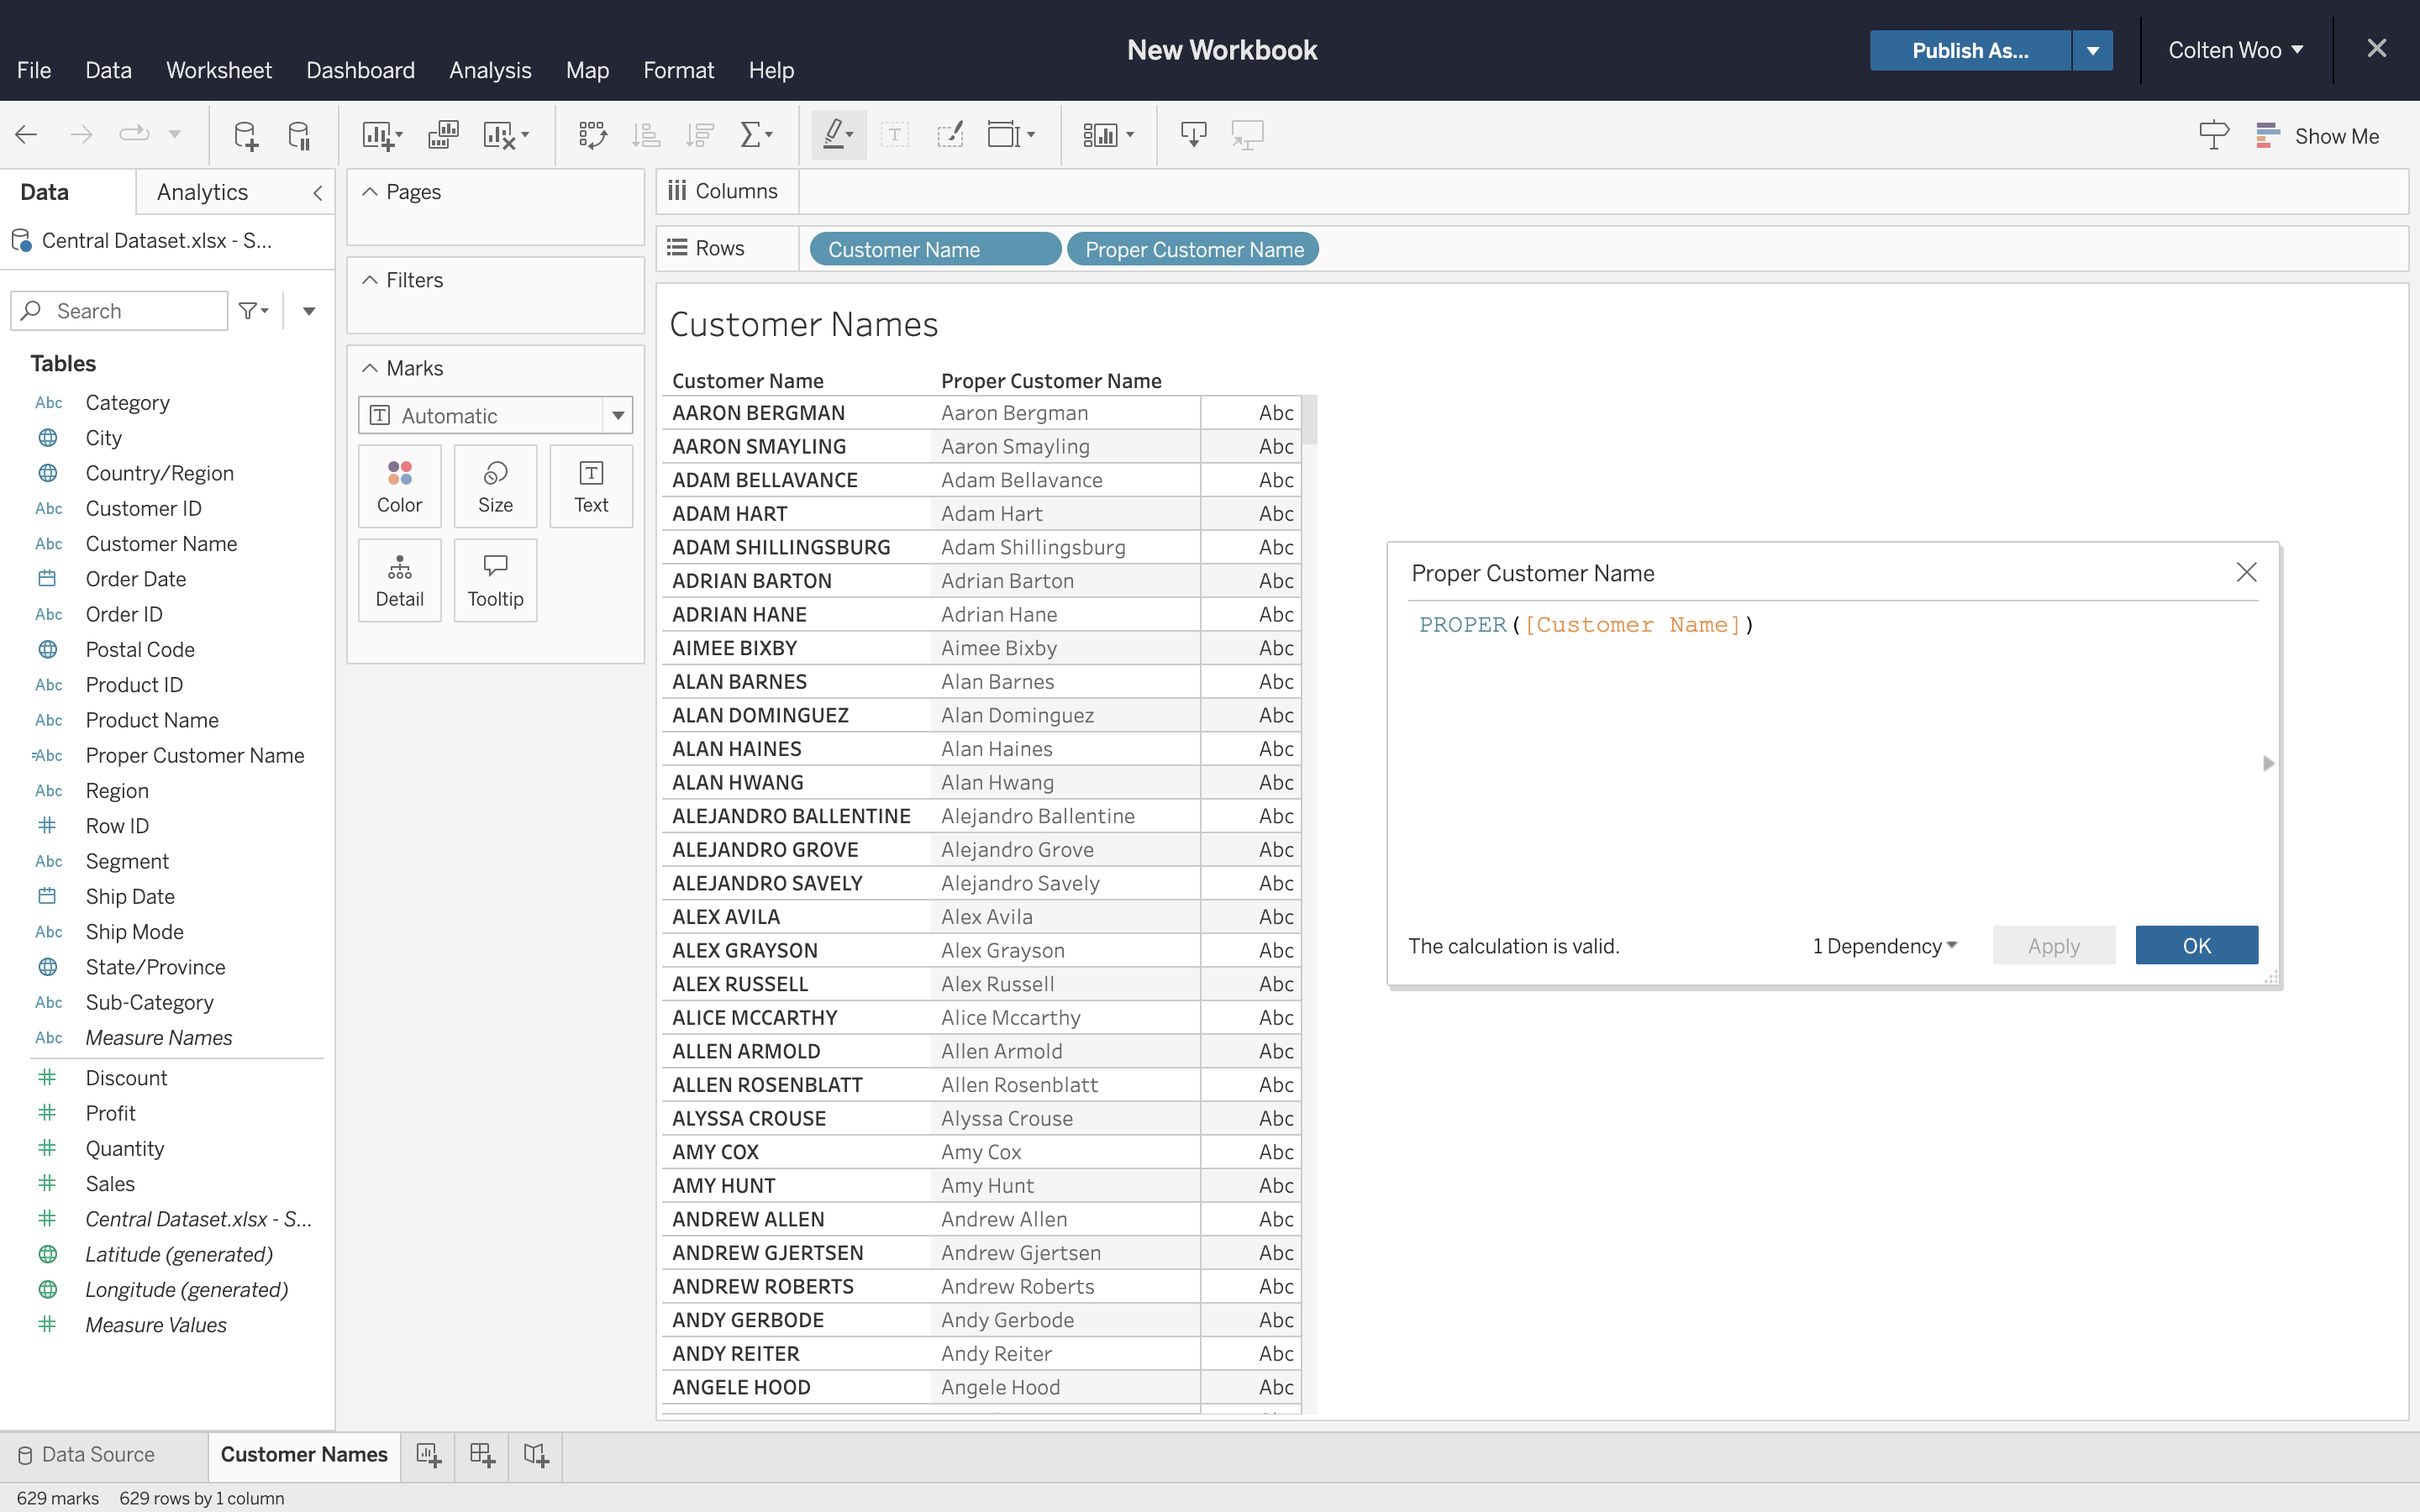
ฟังก์ชันสตริง ‘PROPER()’
จัดรูปแบบช่องข้อมูลแบบสตริงโดยใช้ฟังก์ชัน 'PROPER ( )' แทนการคำนวณวิธีแก้ปัญหาที่ซับซ้อน ฟังก์ชันใหม่นี้จะแปลงสตริงเป็นตัวพิมพ์ที่เหมาะสม ตัวอักษรตัวแรกของสตริงข้อความและตัวอักษรใดๆ ที่ตามหลังอักขระที่ไม่ใช่ตัวอักษรจะถูกทำให้เป็นตัวพิมพ์ใหญ่ ในขณะที่ตัวอักษรที่เหลือจะถูกแปลงเป็นตัวพิมพ์เล็ก
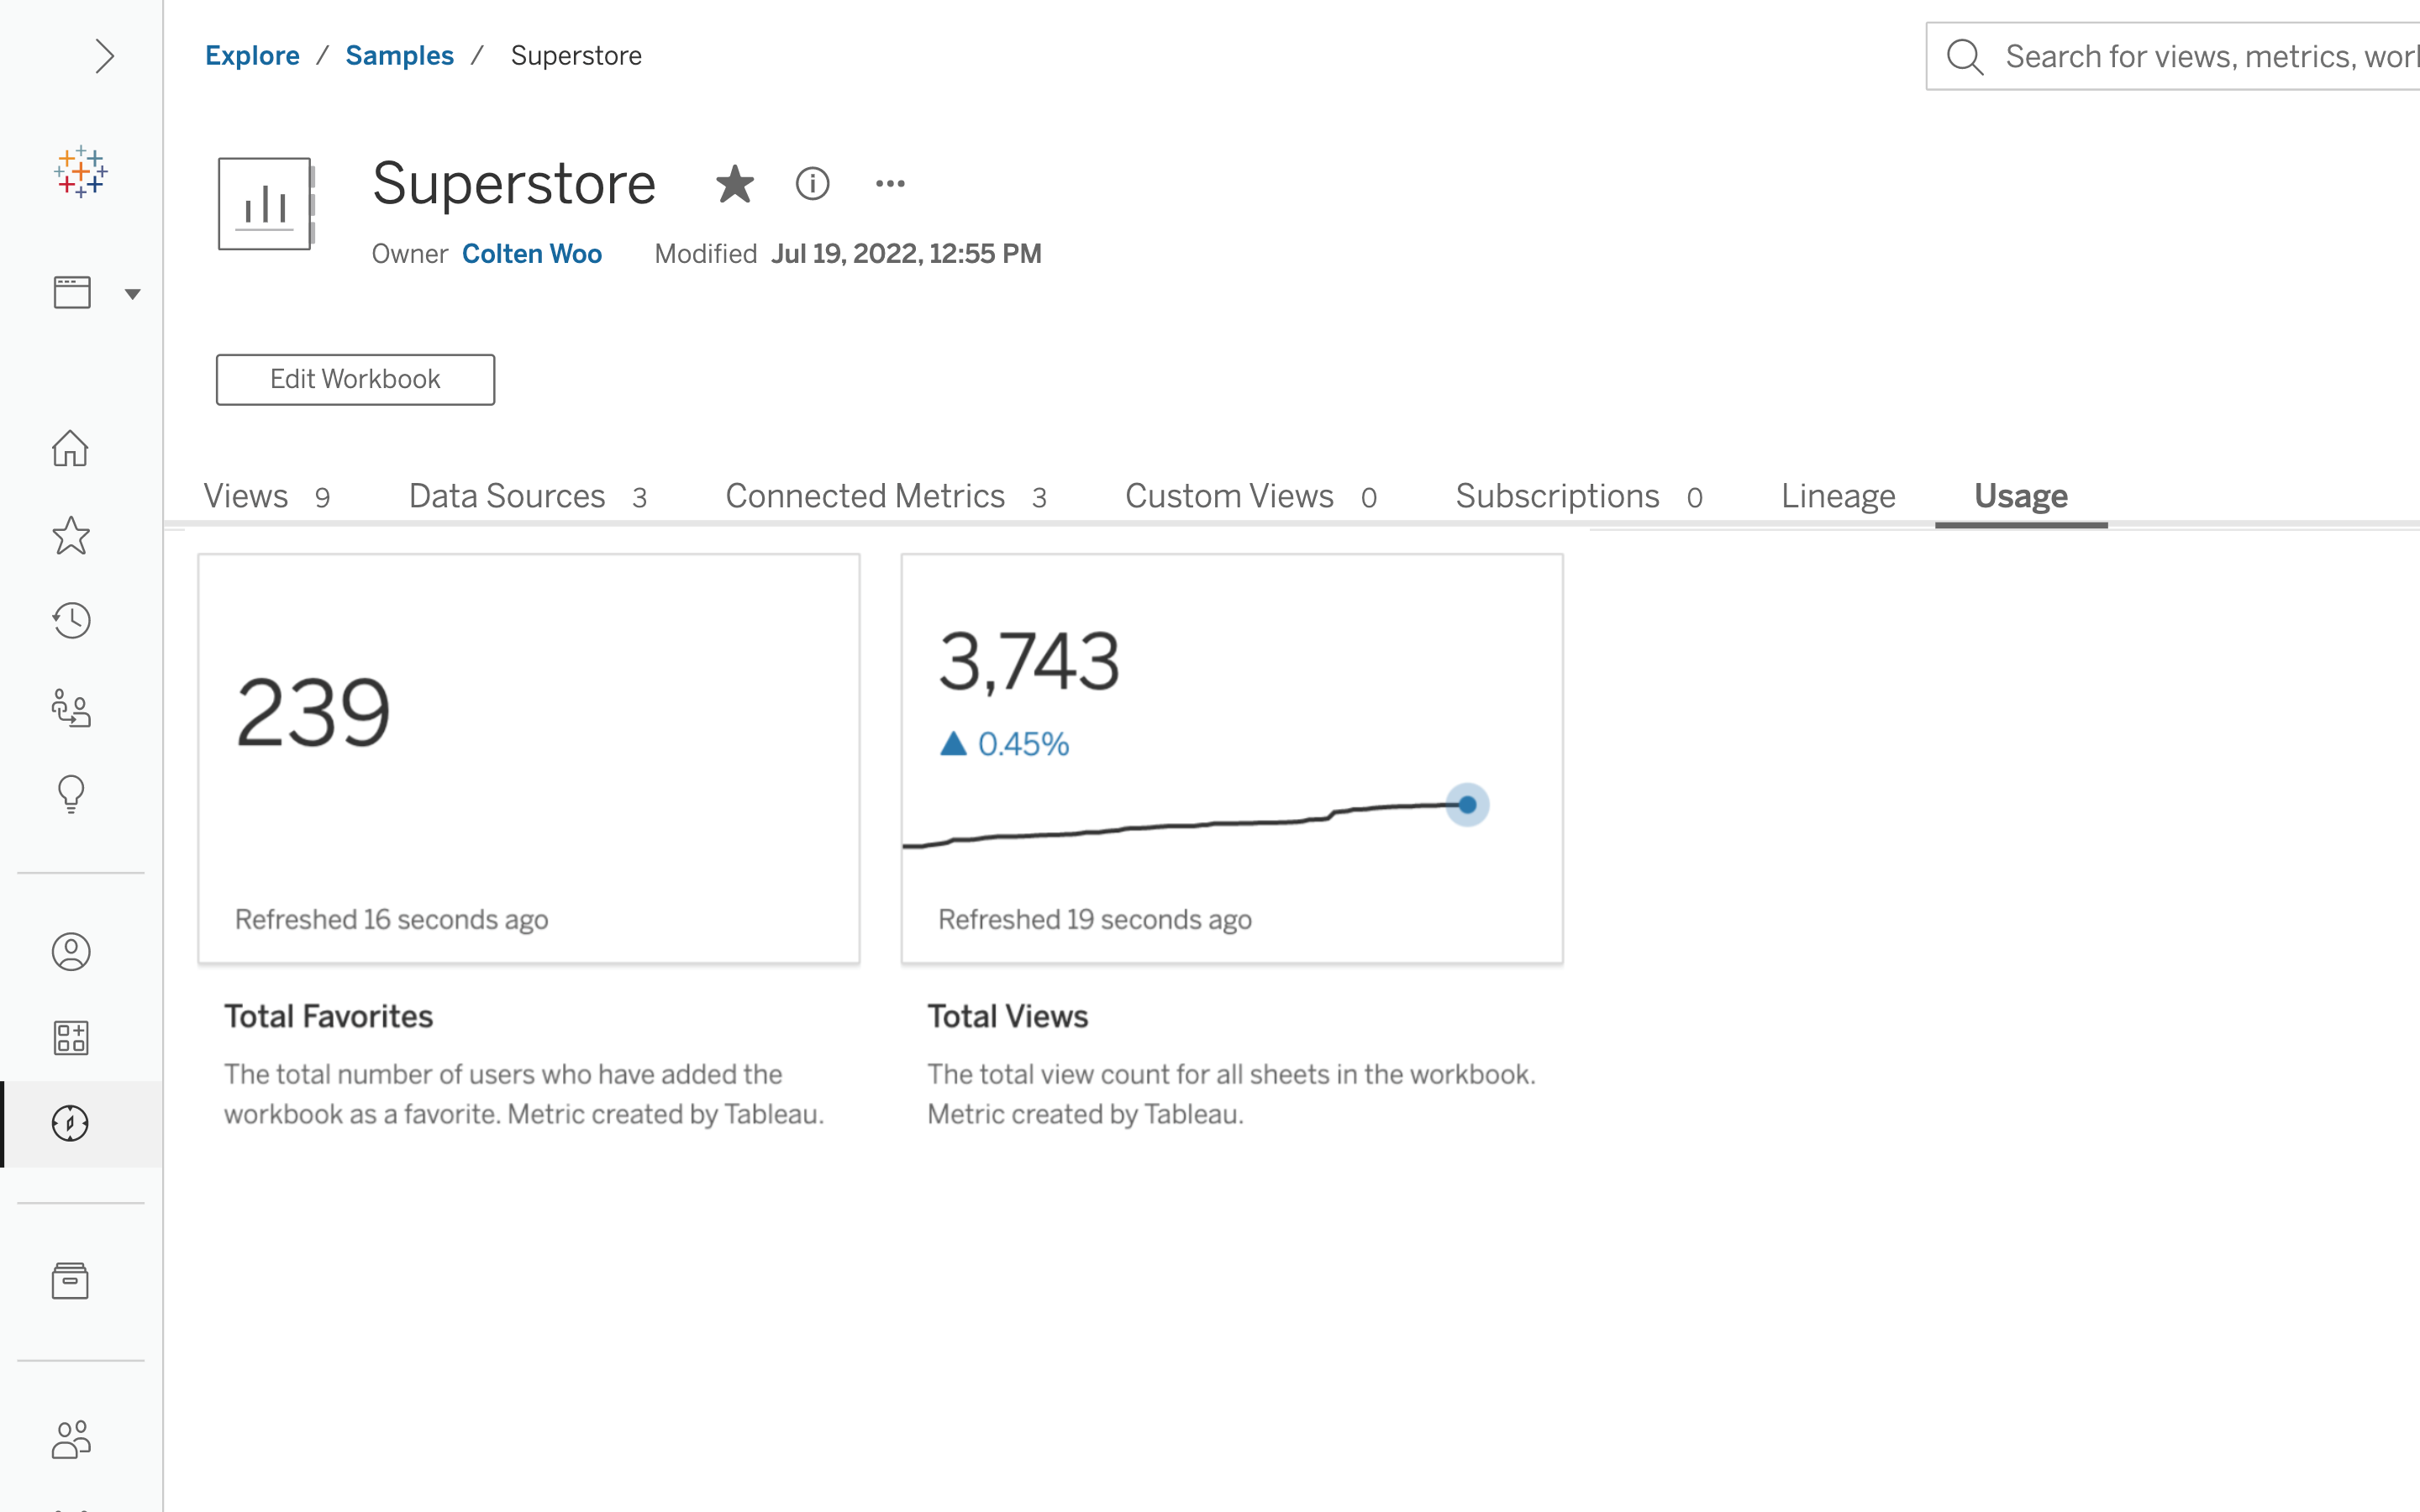
เมตริกการใช้งาน
จำนวนยอดการดูและรายการโปรดทั้งหมดจะแสดงเป็นเมตริกในแท็บการใช้งานใหม่ ข้อมูลเชิงลึกเหล่านี้จะช่วยให้นักวิเคราะห์เข้าใจมากขึ้นว่าเวิร์กบุ๊กใดที่ได้รับความนิยม เพื่อให้สามารถสร้างเนื้อหาที่โดนใจกลุ่มเป้าหมายของคุณได้ ผู้ดูสามารถใช้เมตริกการใช้งานเพื่อตรวจสอบว่าเนื้อหามีการใช้งานอย่างกว้างขวางและเชื่อถือได้
รองรับภาษาสวีเดนและไทย
ดูและทำความเข้าใจข้อมูลในภาษาที่คุณต้องการ Tableau เพิ่มตัวเลือกภาษาไทยและสวีเดน
Tableau 2022.3
Tableau 2022.3 ให้ความสามารถใหม่ที่ช่วยคุณปลดล็อกข้อมูลเชิงลึกเกี่ยวกับข้อมูลของคุณในวงกว้างได้ง่ายๆ จุดเด่นประกอบด้วยคู่มือข้อมูล ส่วนขยายตาราง การมองเห็นโซนแบบไดนามิก และอื่นๆ
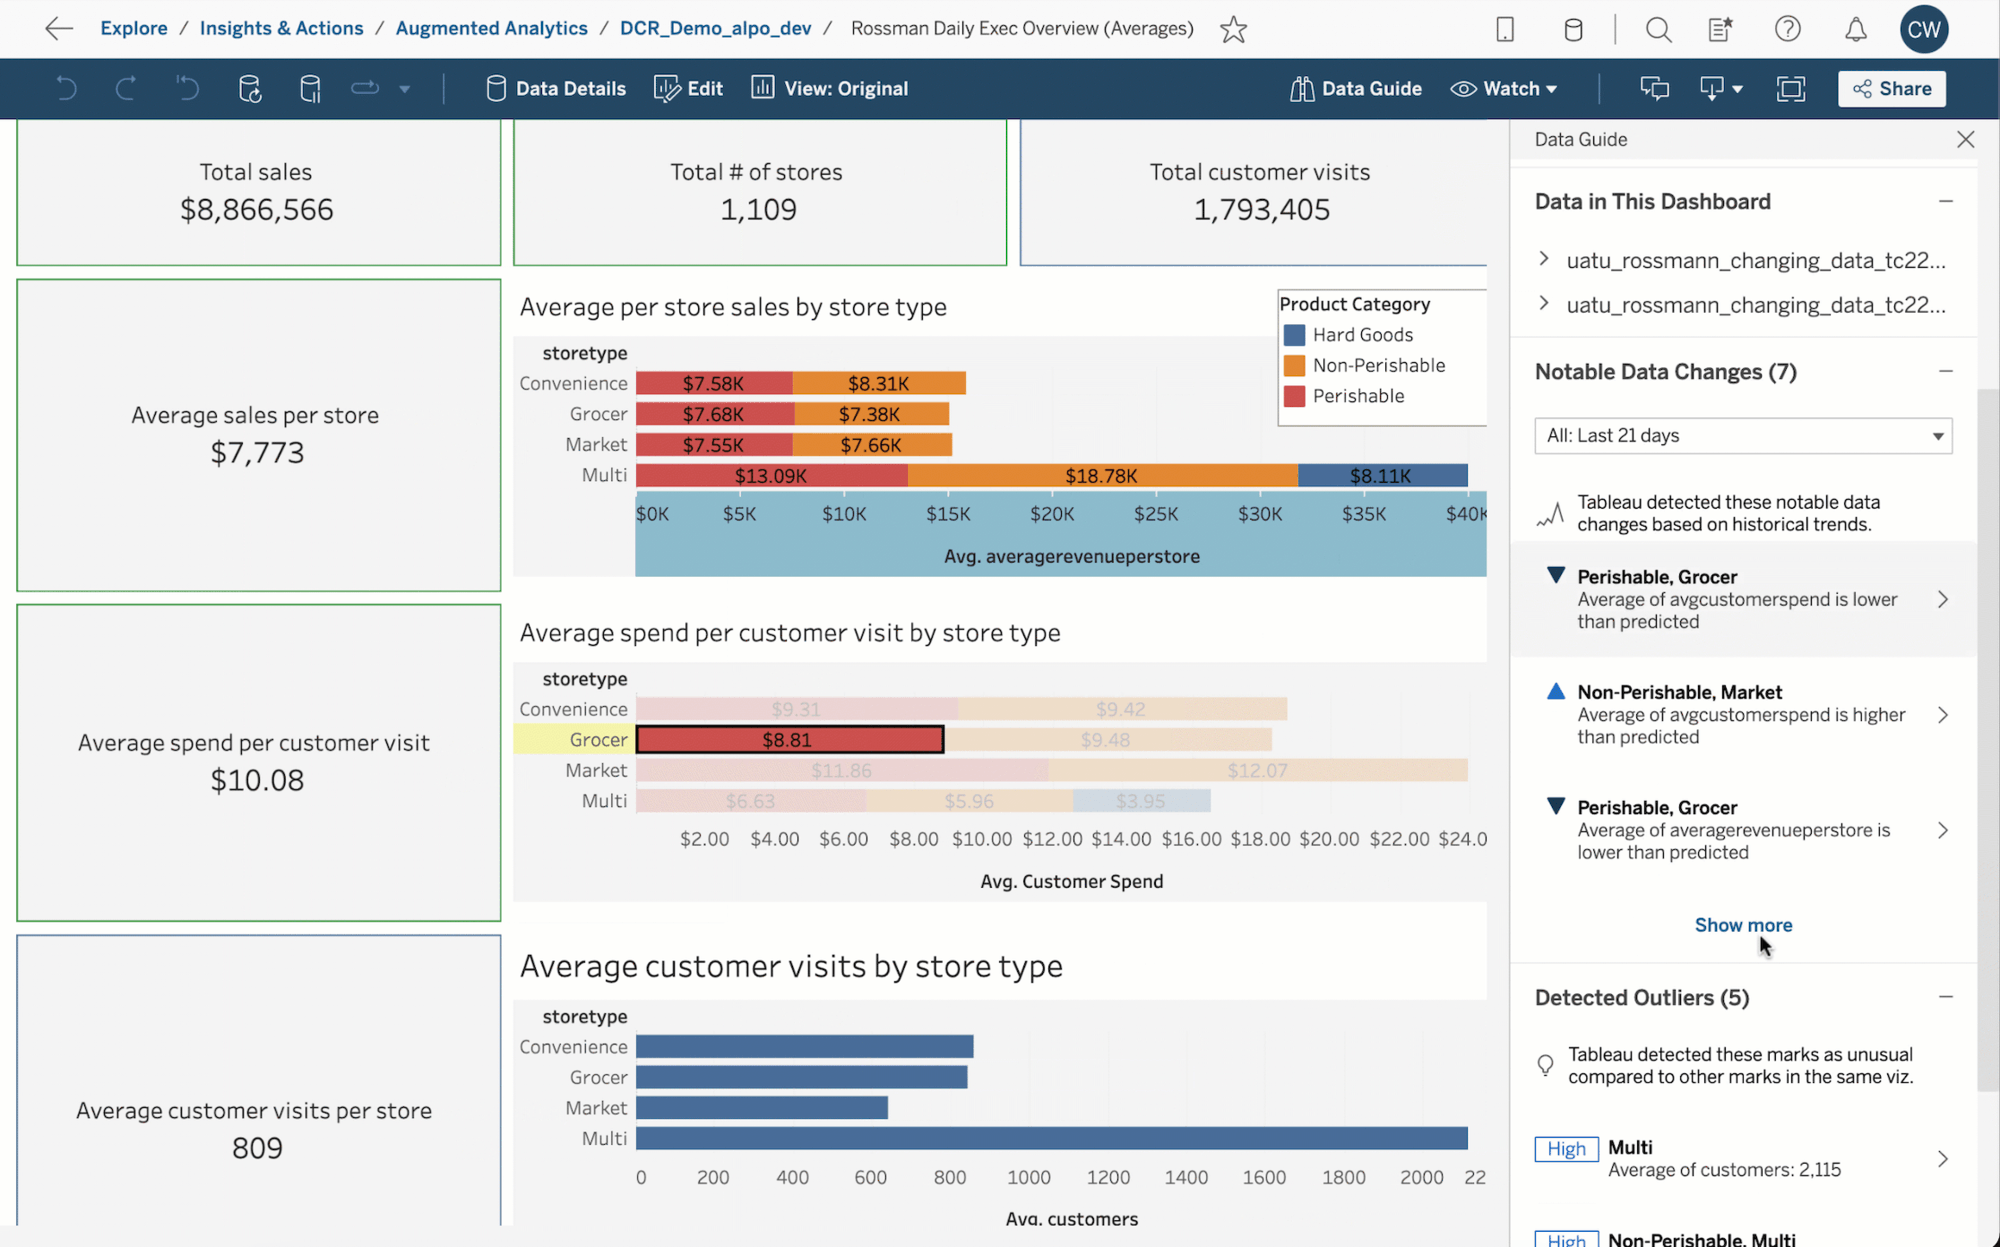
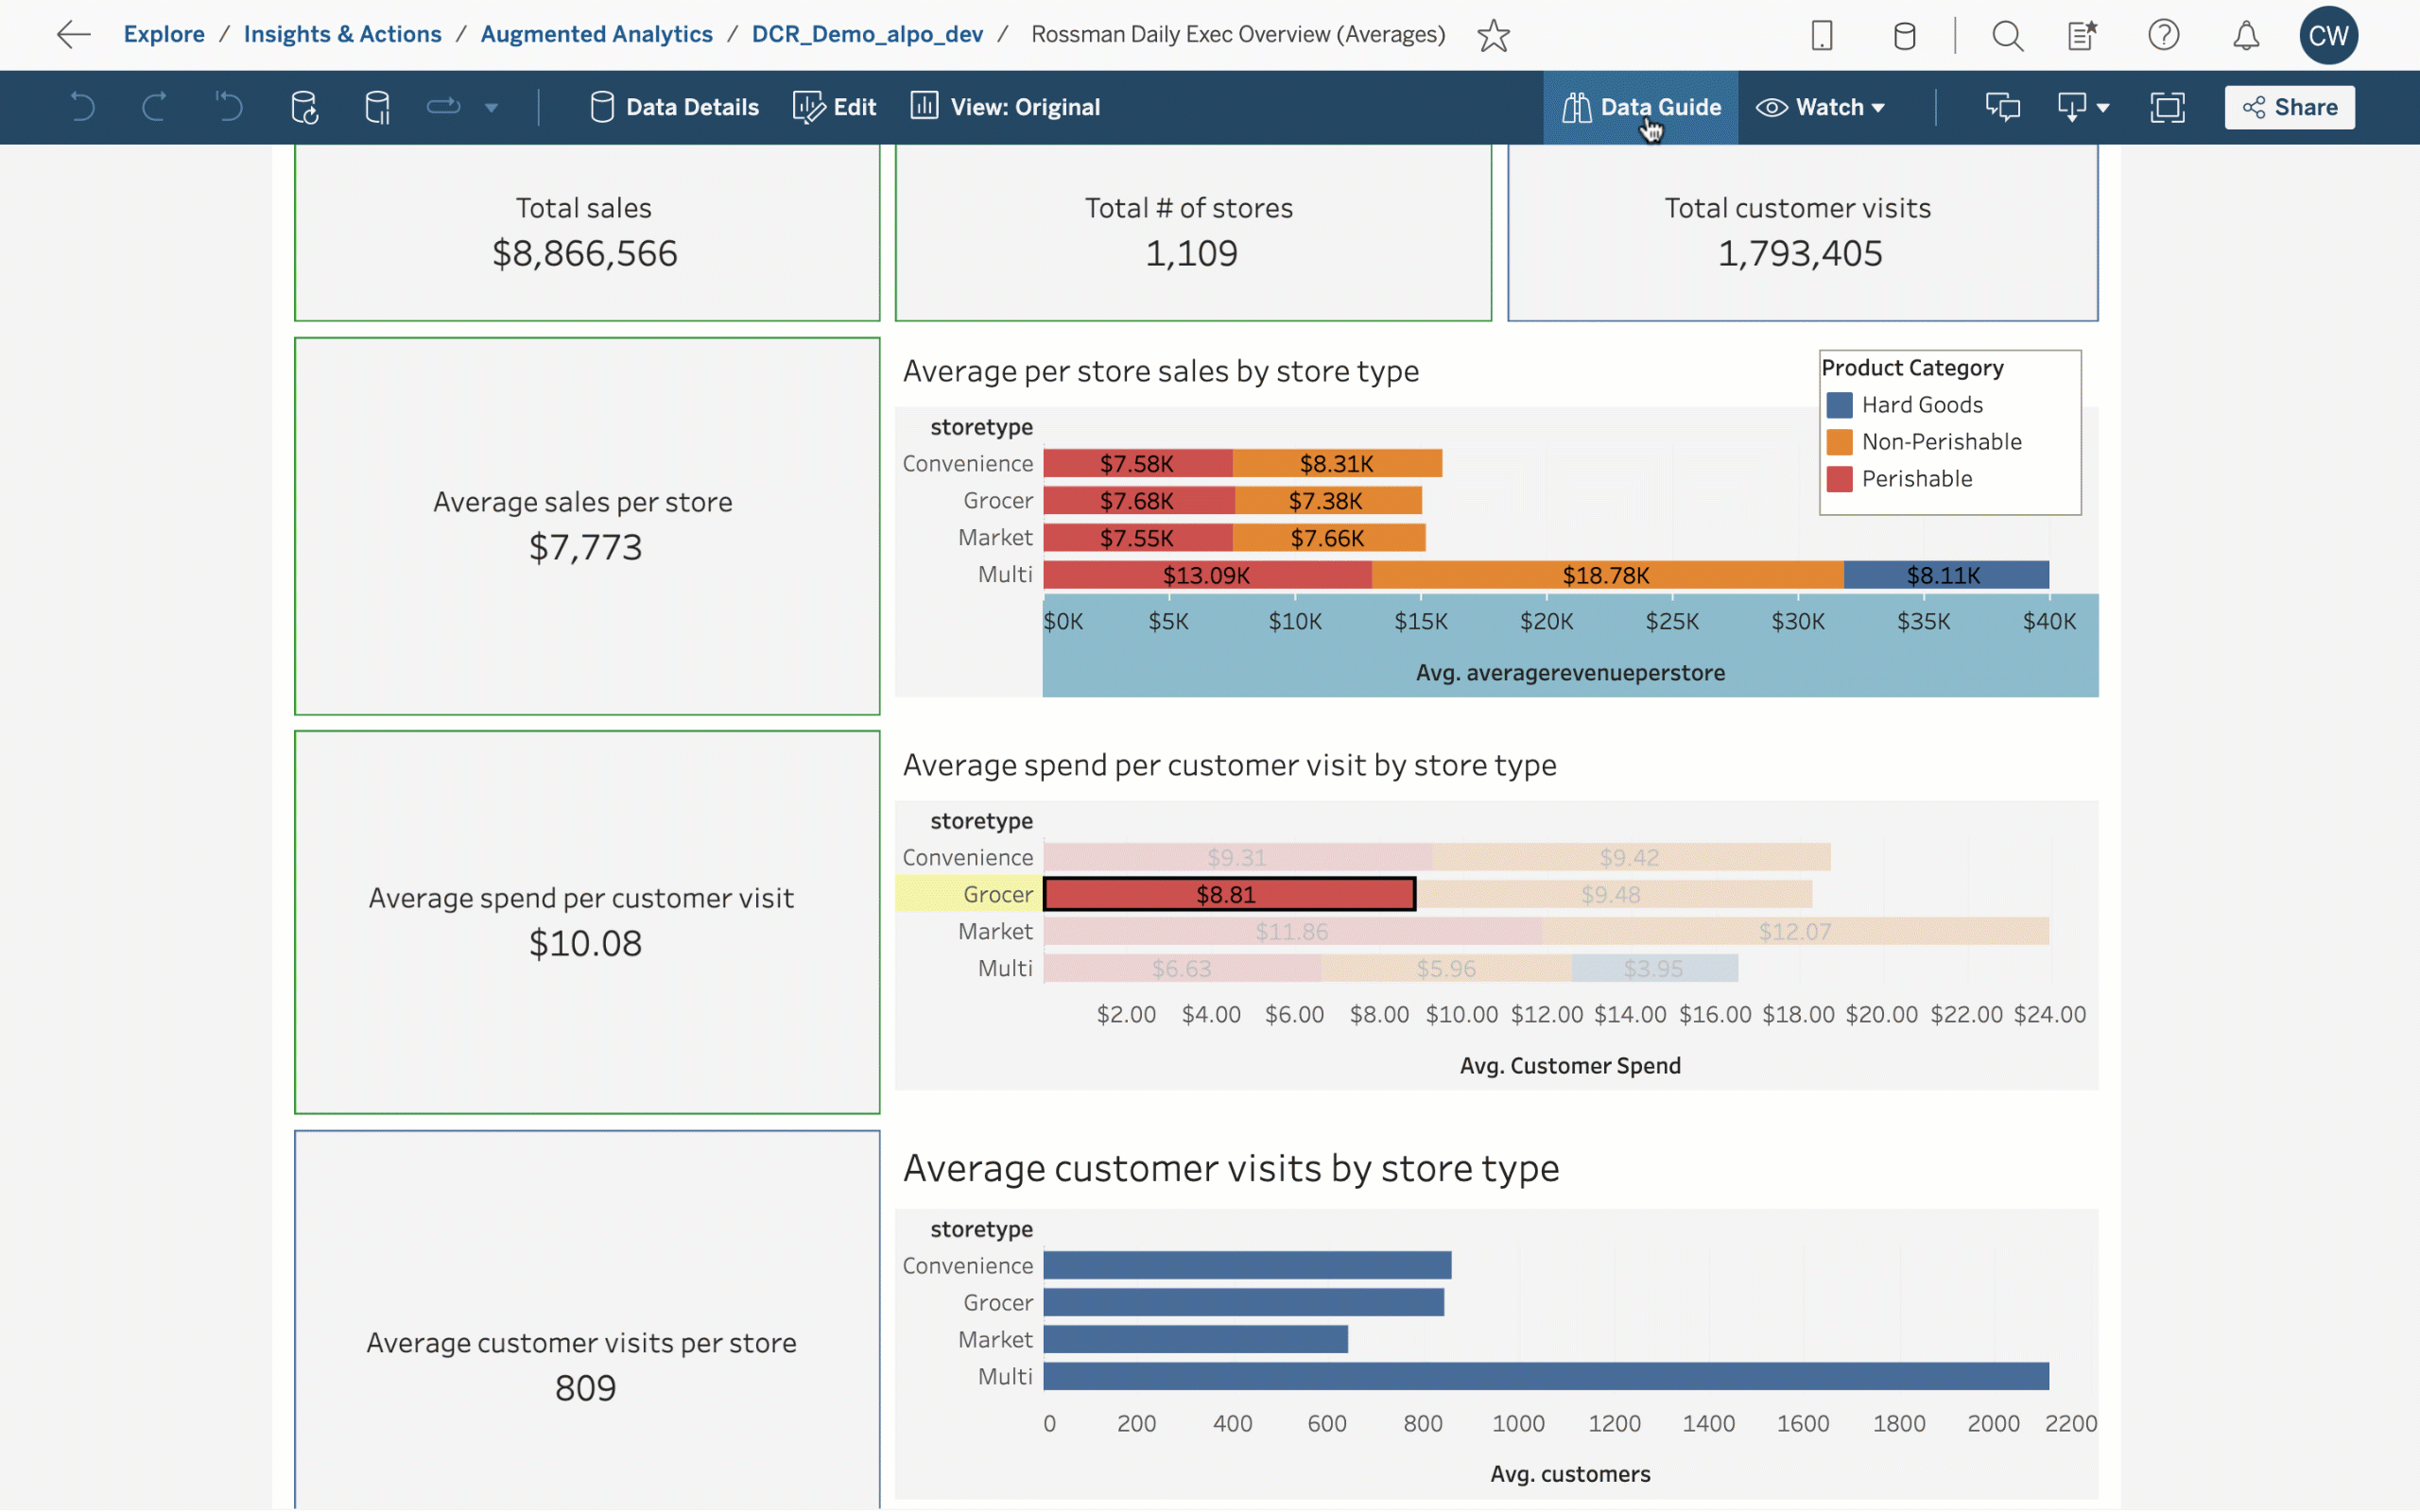
Data Guide
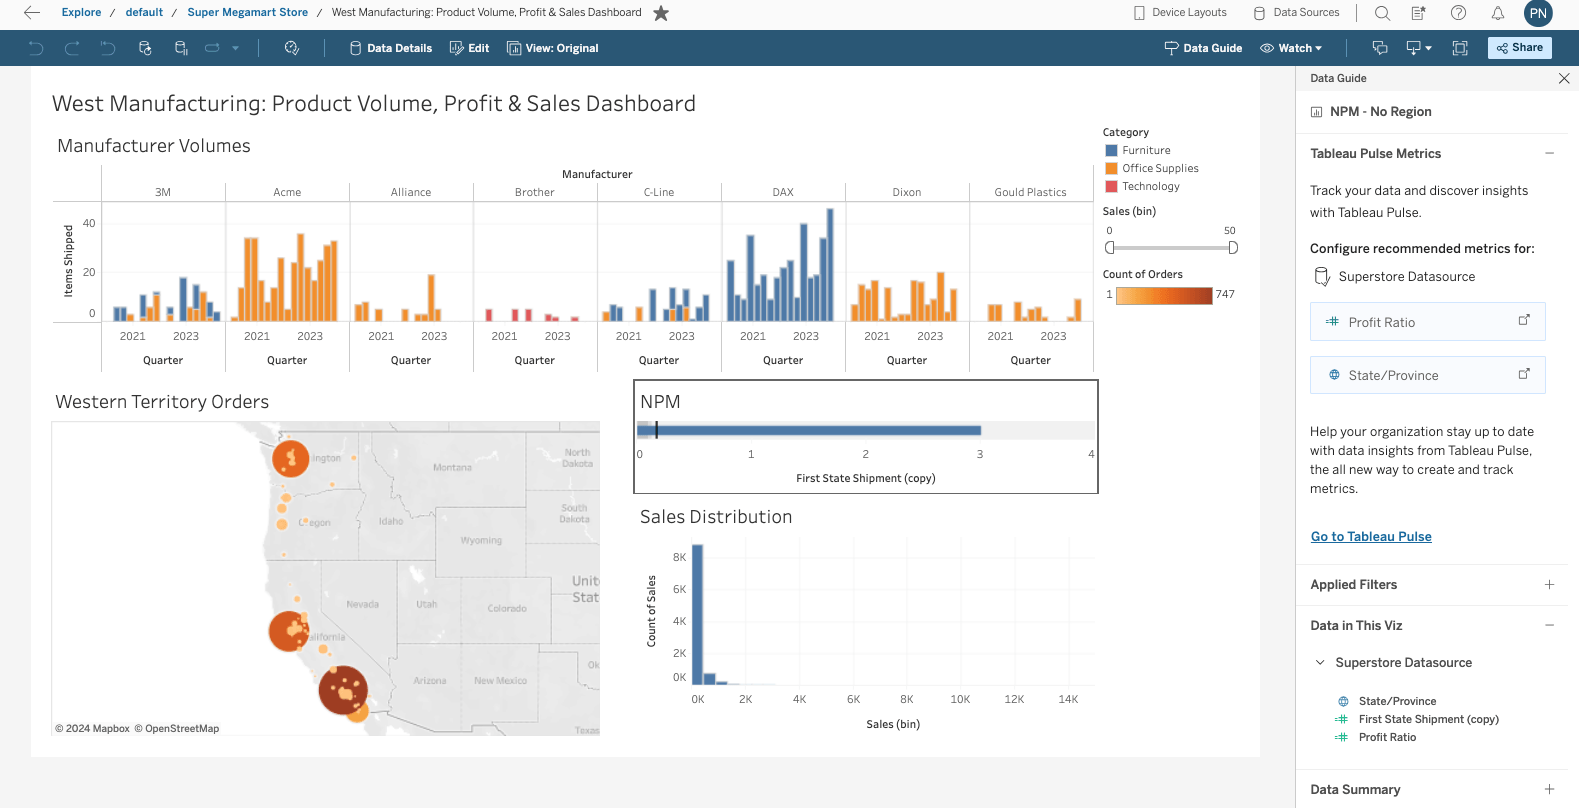
Data Guide is a new pane that provides helpful information about a dashboard and the data behind it. With Data Guide, you can understand if the data can answer your questions, build trust that the data is accurate, and establish confidence in your understanding of the viz. This feature makes it even easier to find data related to the selected viz, dashboard, marks, and important information like outliers and trends in your data. Data Guide also introduces Explain the which Viz scans your dashboards for outlier measures and potential key drivers behind them. This pane is available on Tableau Server, Tableau Cloud and Tableau Desktop. More information here.
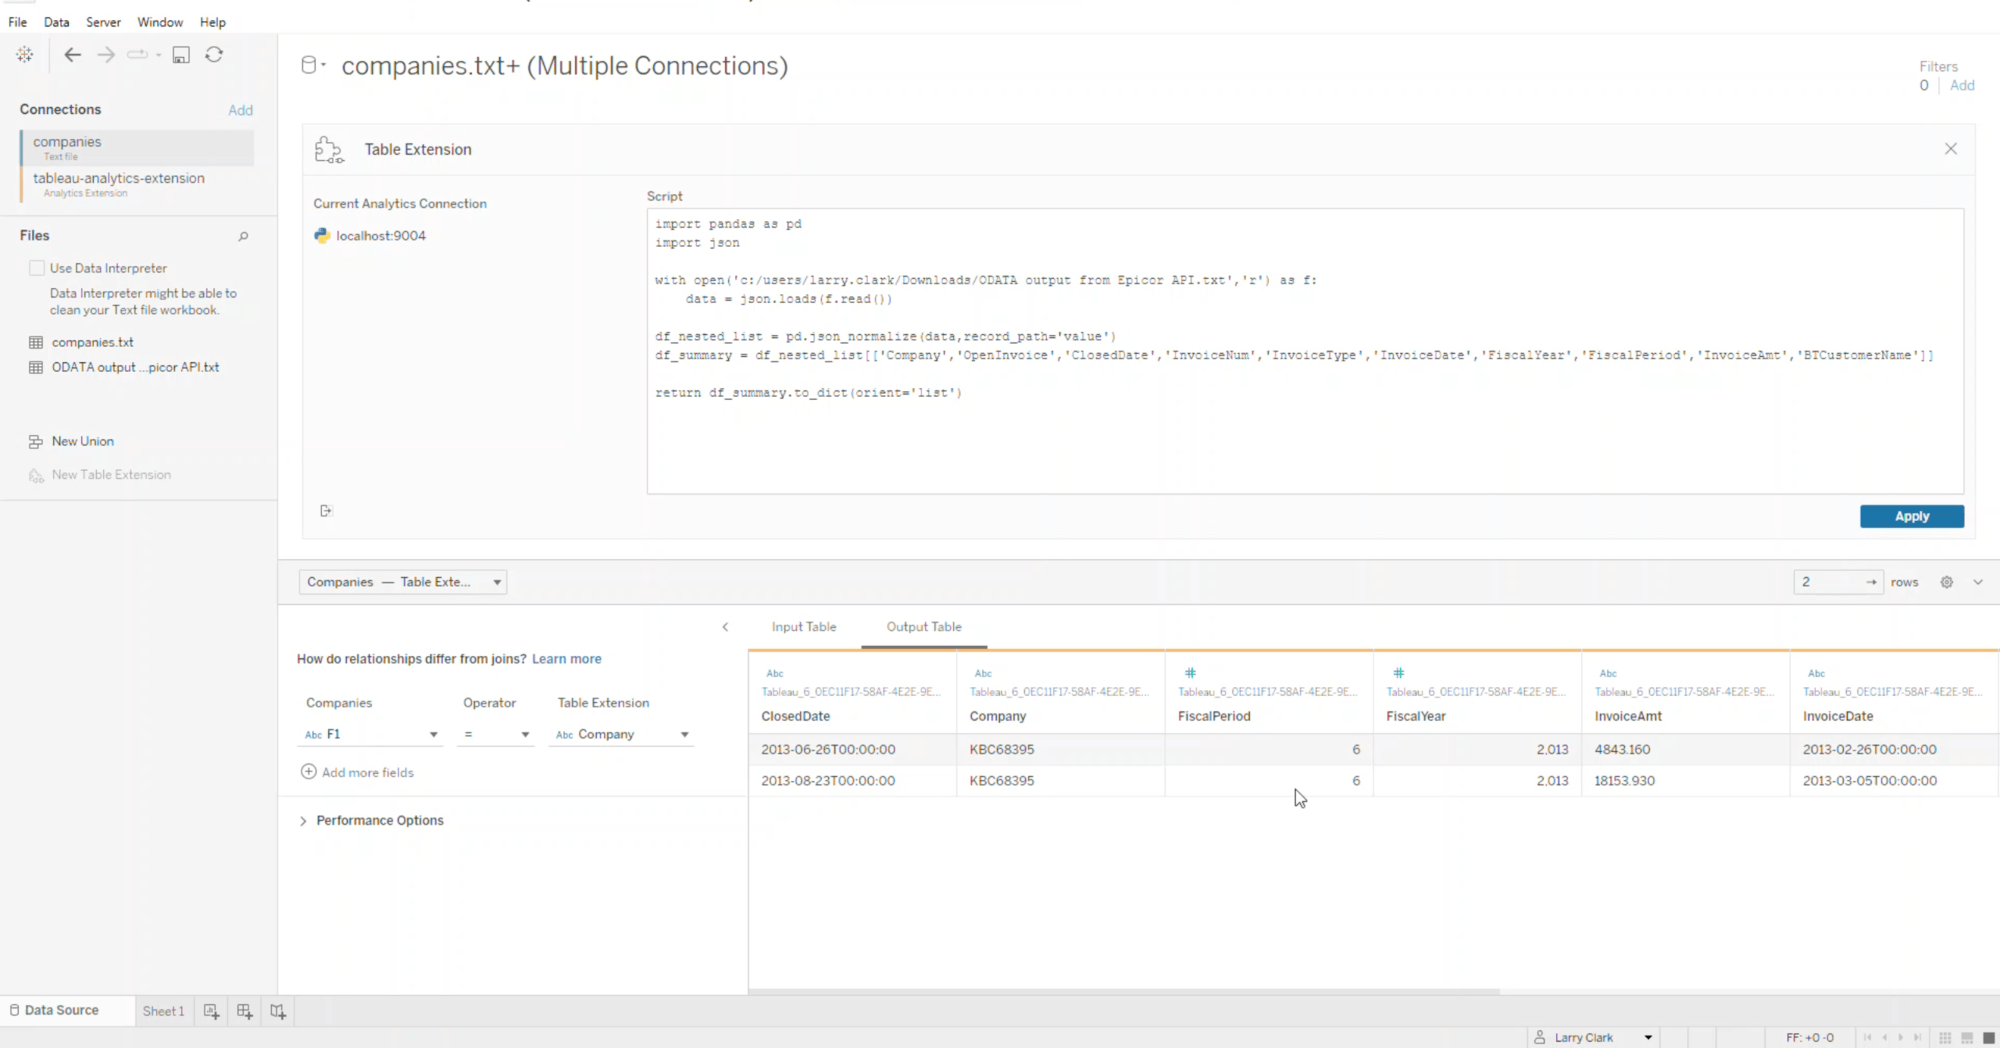
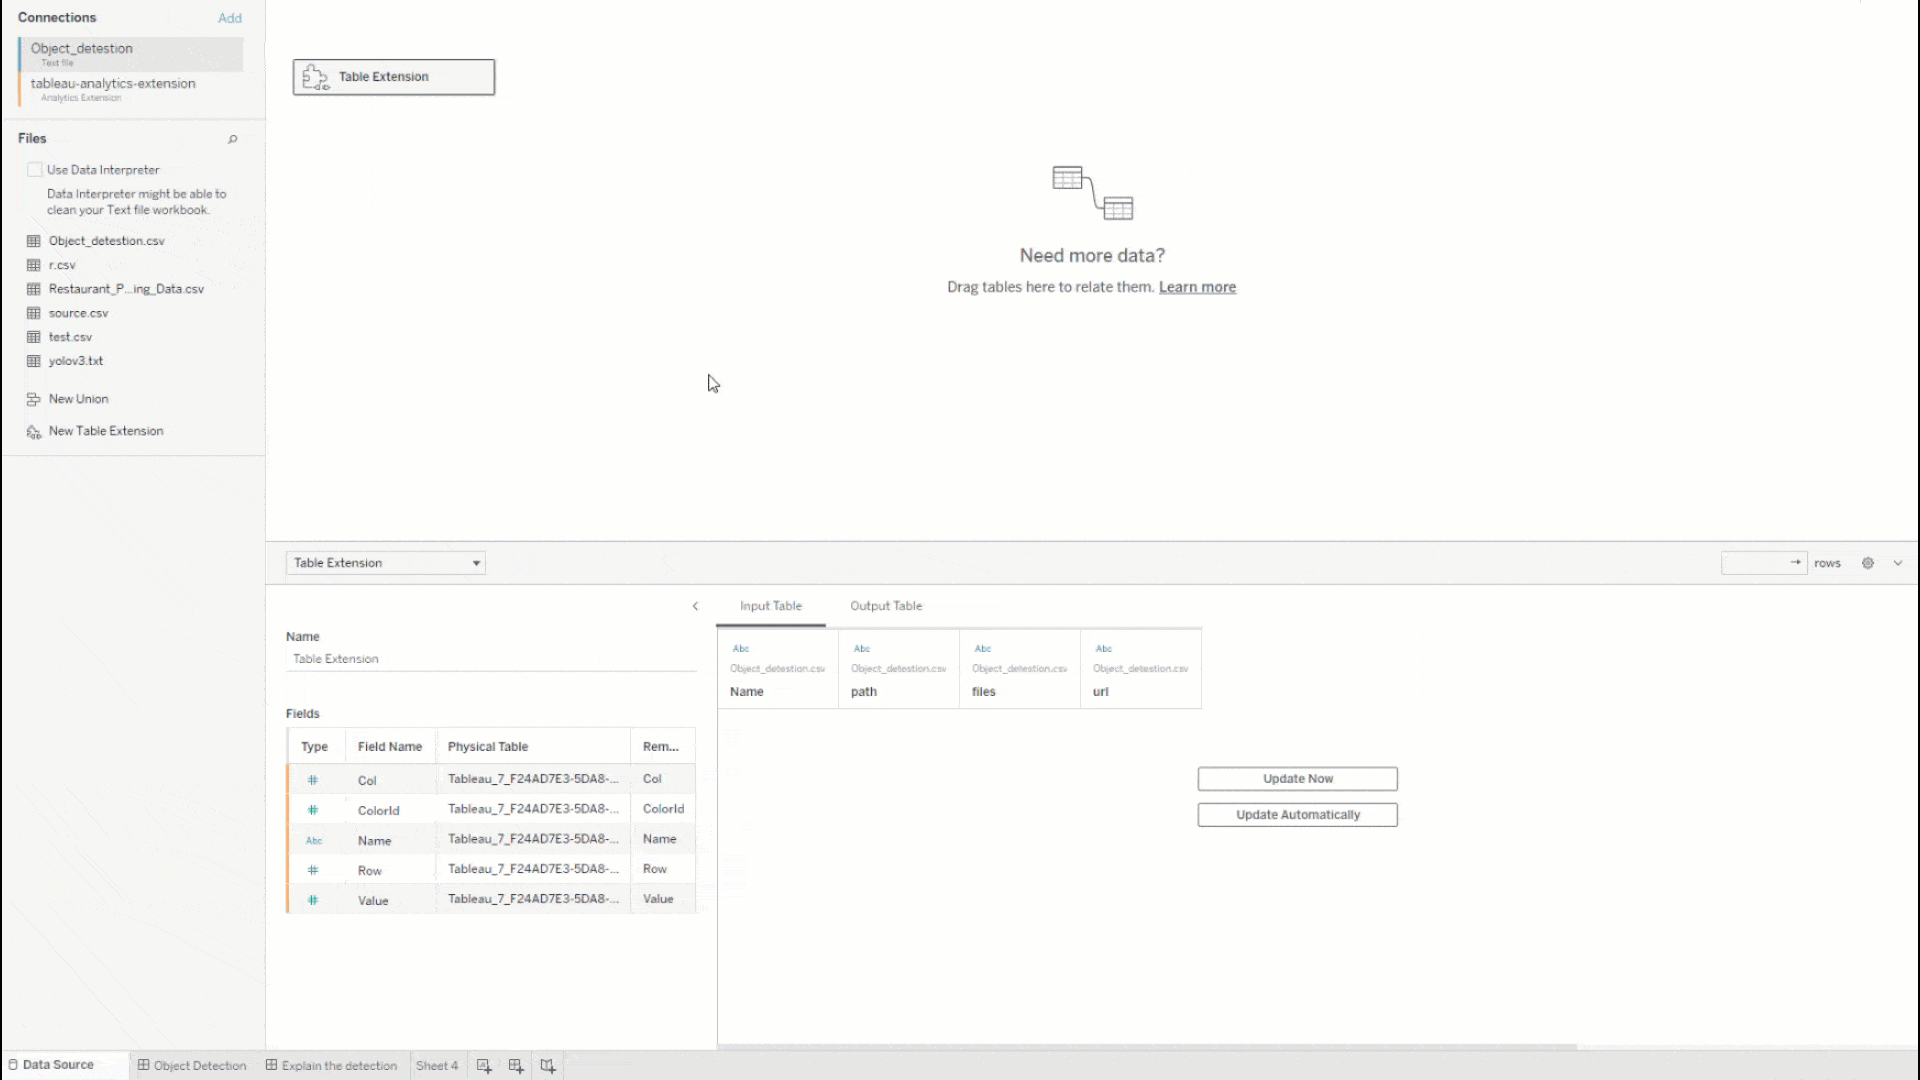
Table Extensions
Table Extensions add new depth to seeing and understanding data by bringing deep analytics and data shaping with code and APIs to the core of Tableau. Dynamically bring entire data tables from analytics tools like Python, R, Einstein Discovery, and more into Tableau's data model. Live query tables of data using Tableau's Data Model and pass it to analytics extensions for analysis, re-shaping, or enrichment, and return results tables to Tableau just like any other data source. With Table Extensions, you are able to inject advanced analytics and predictions at different levels of detail, bring more data for better business decisions, and get real-time results because values are re-computed dynamically.
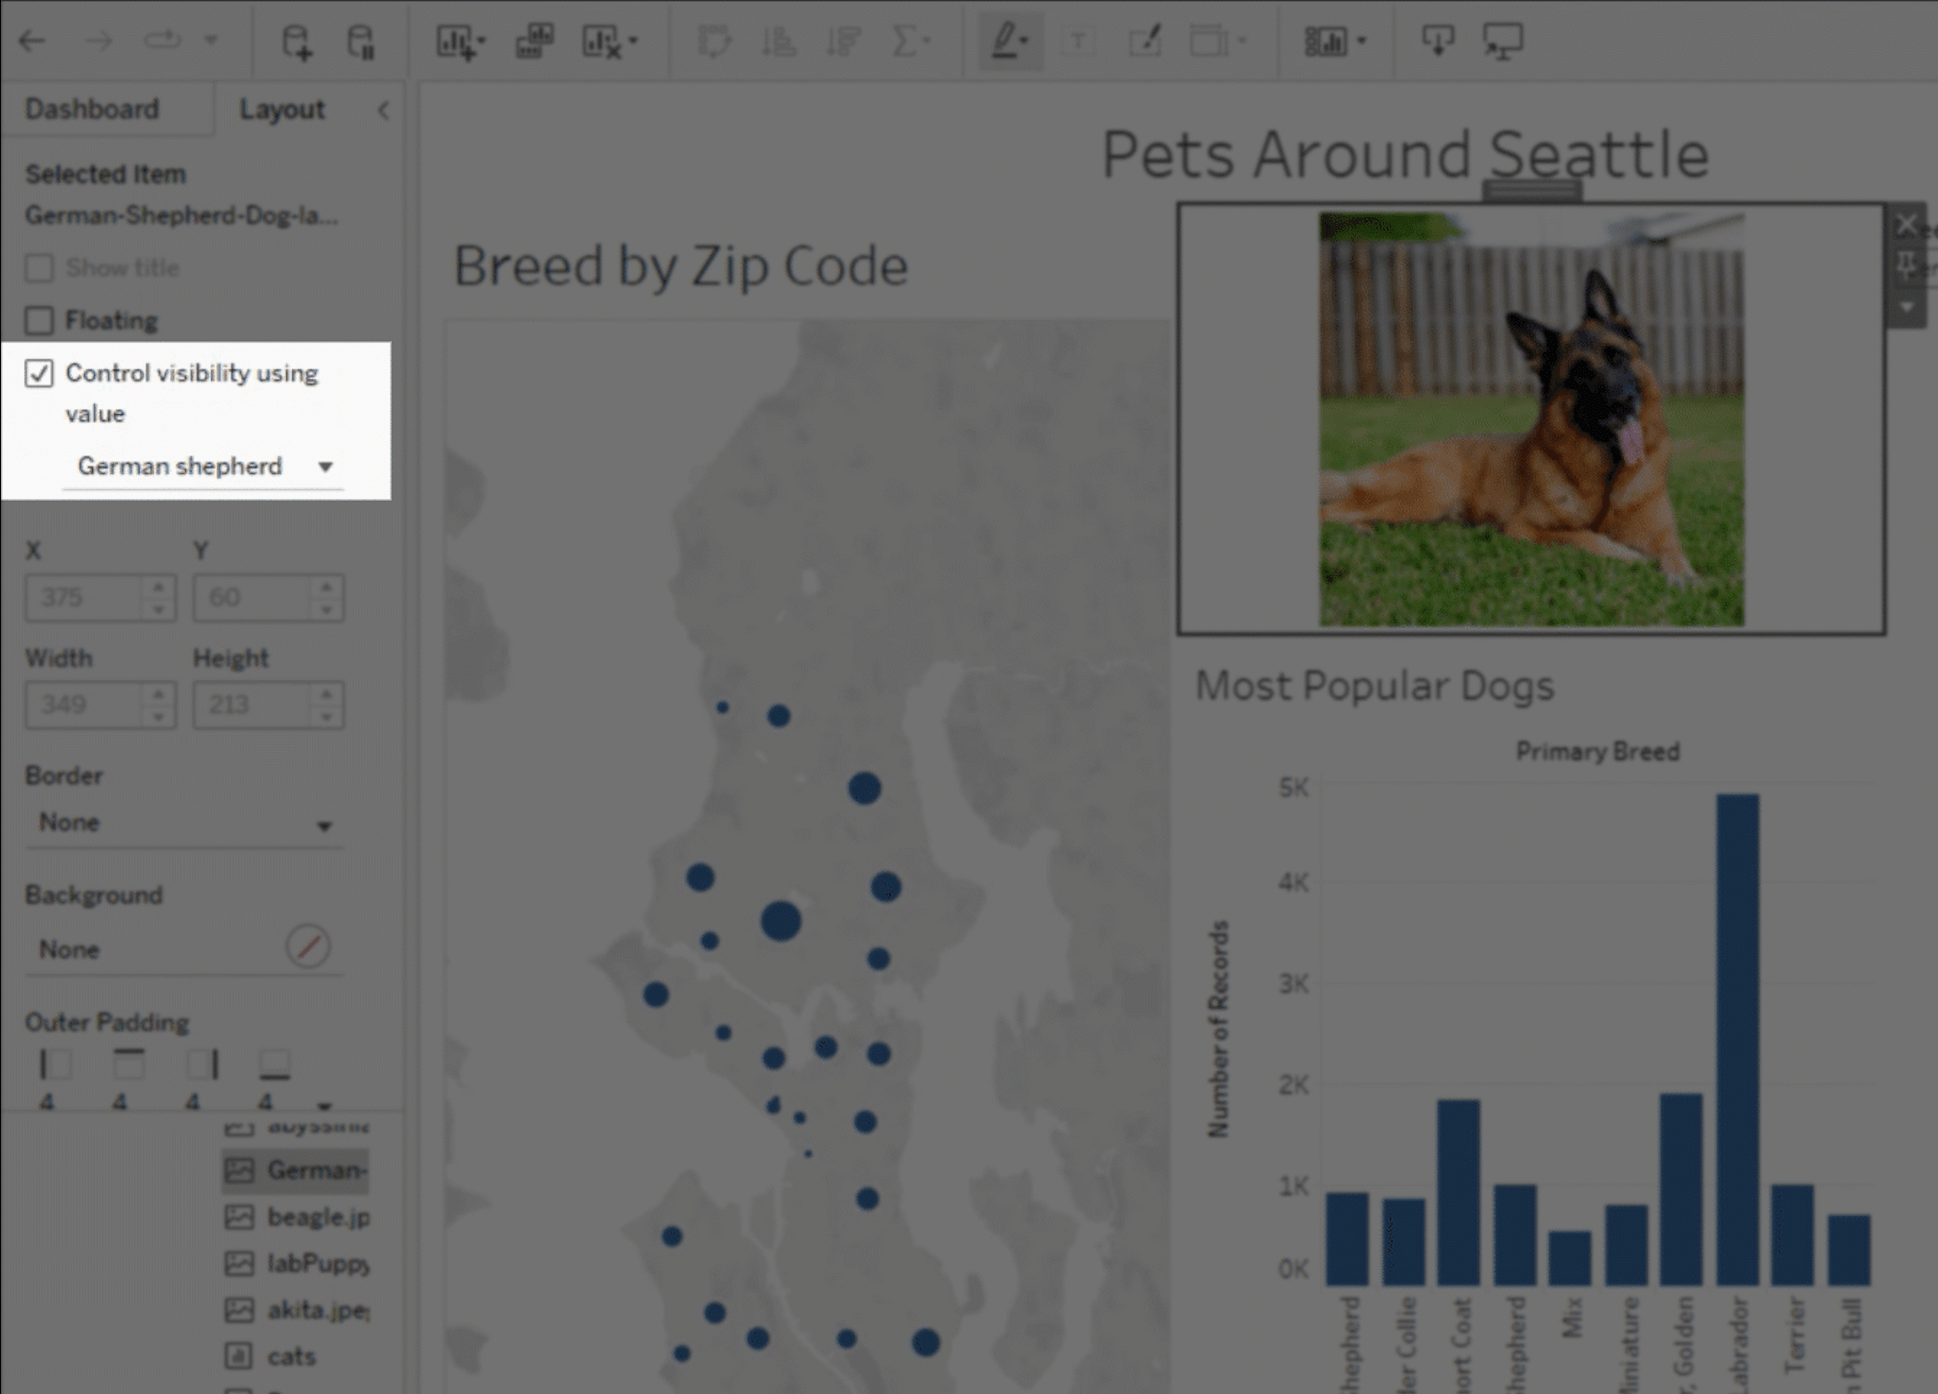
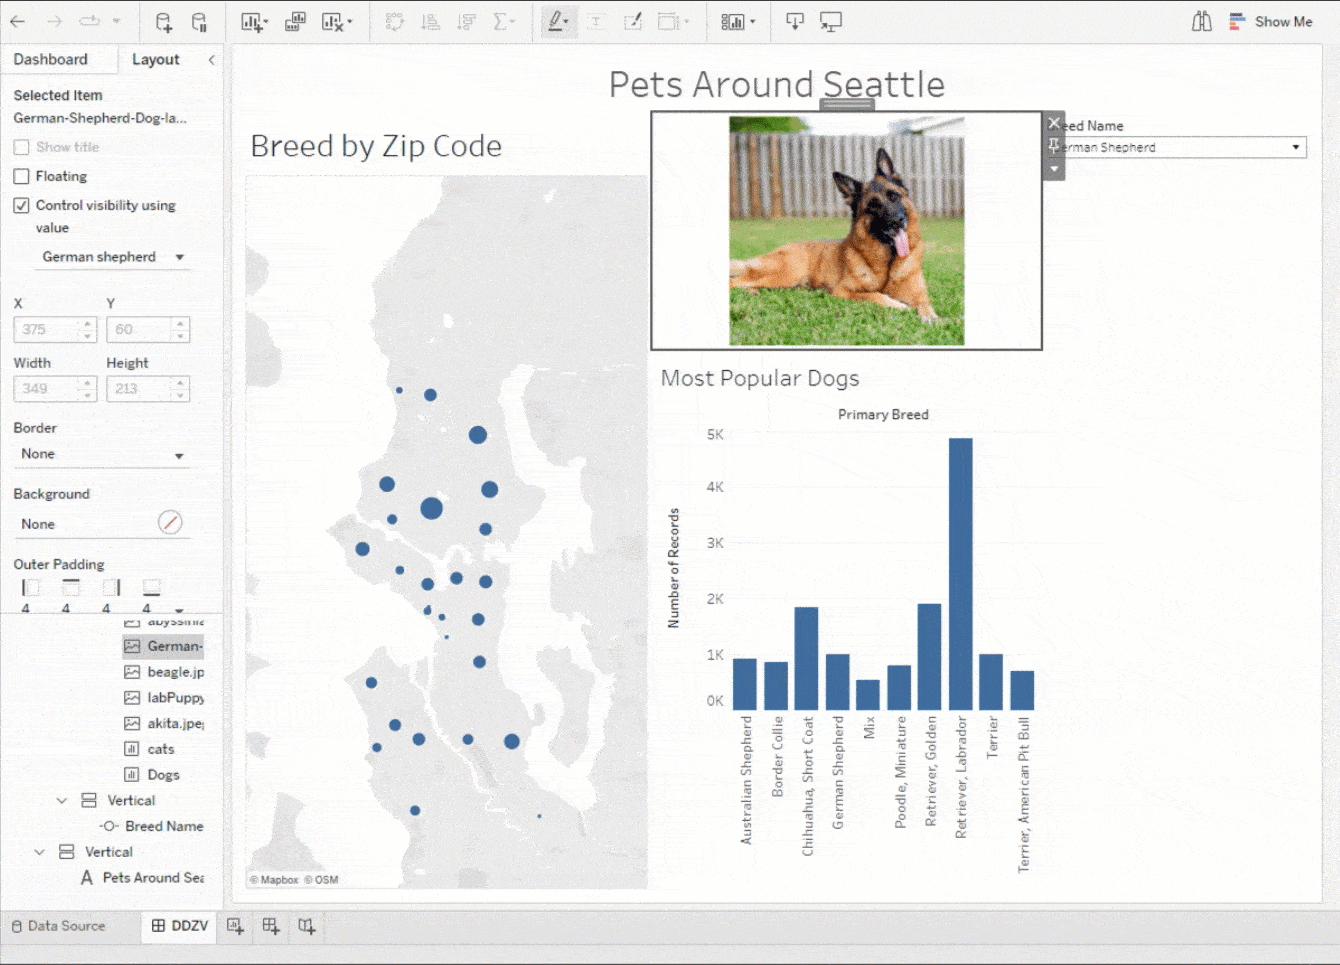
Dynamic zone visibility
With dynamic zone visibility, you can tailor experiences for your end-users so they only see the dashboard elements relevant to them. Create sophisticated and interactive dashboards that dynamically reveal dashboard elements. In the layout pane, you configure when dashboard elements are shown or hidden based on the values of parameters and fields. More information here.
Dynamic scaling in a container
Advanced Management for Tableau Server customers can now scale Backgrounders, and their supporting processes, in Docker containers via Kubernetes on a set schedule. In the past, Tableau Server admins faced a predicament: pay to size the deployment for peak load times or save money but face longer delays before Backgrounder processes finish. Now, you can add additional Backgrounder resources when needed and spin them down after peak times, giving you control over the cost vs. performance tradeoff.
Activity Log in Tableau Server
The Activity Log goes above and beyond existing event data by exposing more events within your Tableau environment. These events will be structured and documented. For Advanced Management for Tableau Server customers, this comes to life through a new log file in your Tableau Server logs folder. The Activity Log will make permissions auditing possible which is essential for implementing a robust book of controls on your Tableau environment.
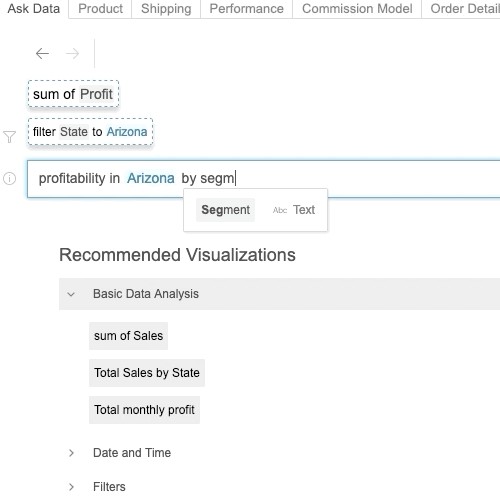
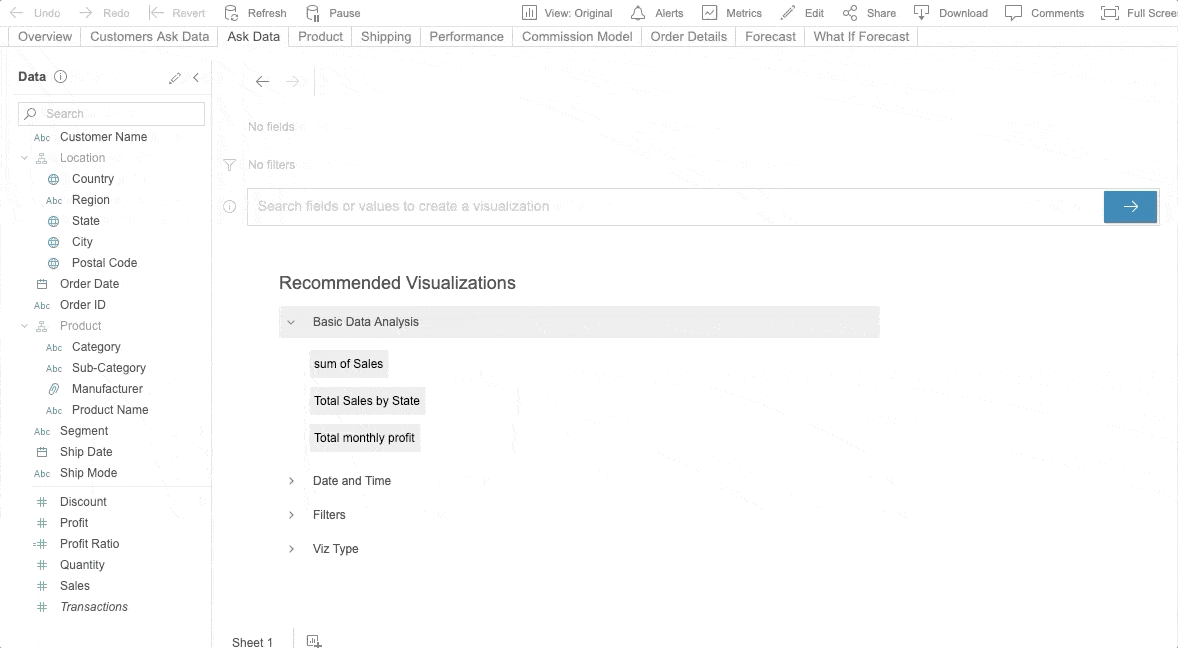
Ask Data phrase recommendations
Ask Data phrase recommendations make it even easier for business users to ask questions of their data using natural language. Powered by machine learning models, Ask Data intelligently recommends next steps to uncover insights in your data by suggesting new measures to add to your question or dimensions to group by or filter on. Selected recommendations automatically update the query sent to Ask Data and the visualized answer that is returned. More information here.
Tableau 2022.2
Tableau 2022.2 มอบความสามารถใหม่ที่ทำให้ทุกคนใช้งานข้อมูลได้ง่ายขึ้น รวมถึงจัดเตรียมข้อมูลมีประสิทธิภาพมากขึ้นและการวิเคราะห์ที่เร็วขึ้น จุดเด่นประกอบด้วยเรื่องราวของข้อมูล บันทึกอัตโนมัติในเบราวเซอร์ และการแลกเปลี่ยนภายในผลิตภัณฑ์
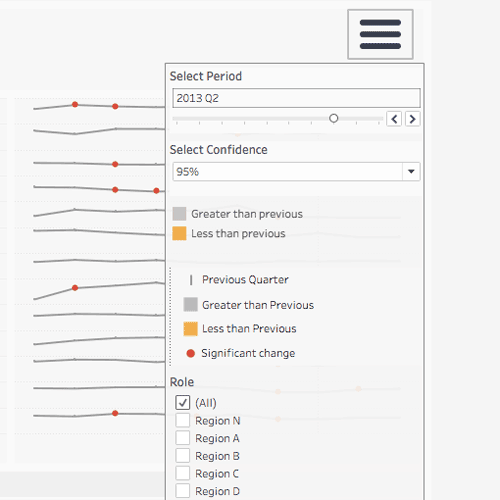
Data Stories
Help any user to confidently access, understand, and communicate with data. Data Stories automate the analysis, build, and communication of insights, but are fully customizable, so you can tailor the stories based on your audience. Choose which analyses are included, change the confidence interval, rename fields, apply colors to denote positive or negative changes, and more.
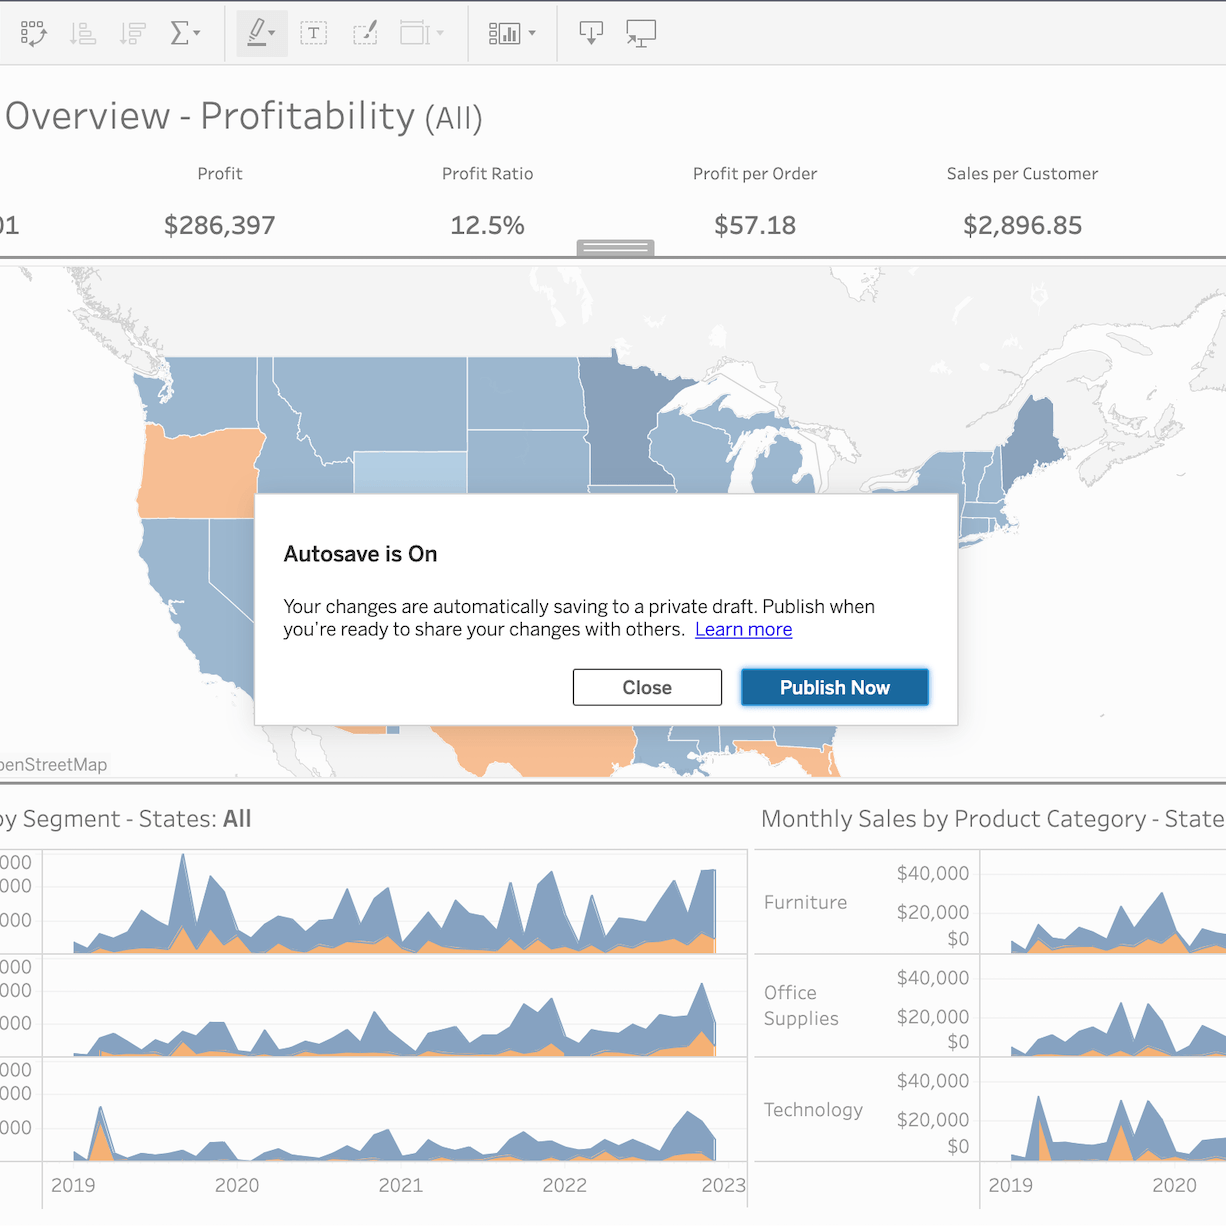
Autosave
Trust your work won’t be lost. Autosave lets you edit an existing workbook in a draft until you’re ready to publish so you won't lose your changes or share them prematurely with other workbook users.
In-product Exchange
It is now even easier to leverage trusted offerings from the Tableau Exchange right where you work in Tableau. Dashboard Extensions and Tableau Accelerators from the Tableau Exchange are accessible directly in Tableau Desktop as part of the core authoring experience.
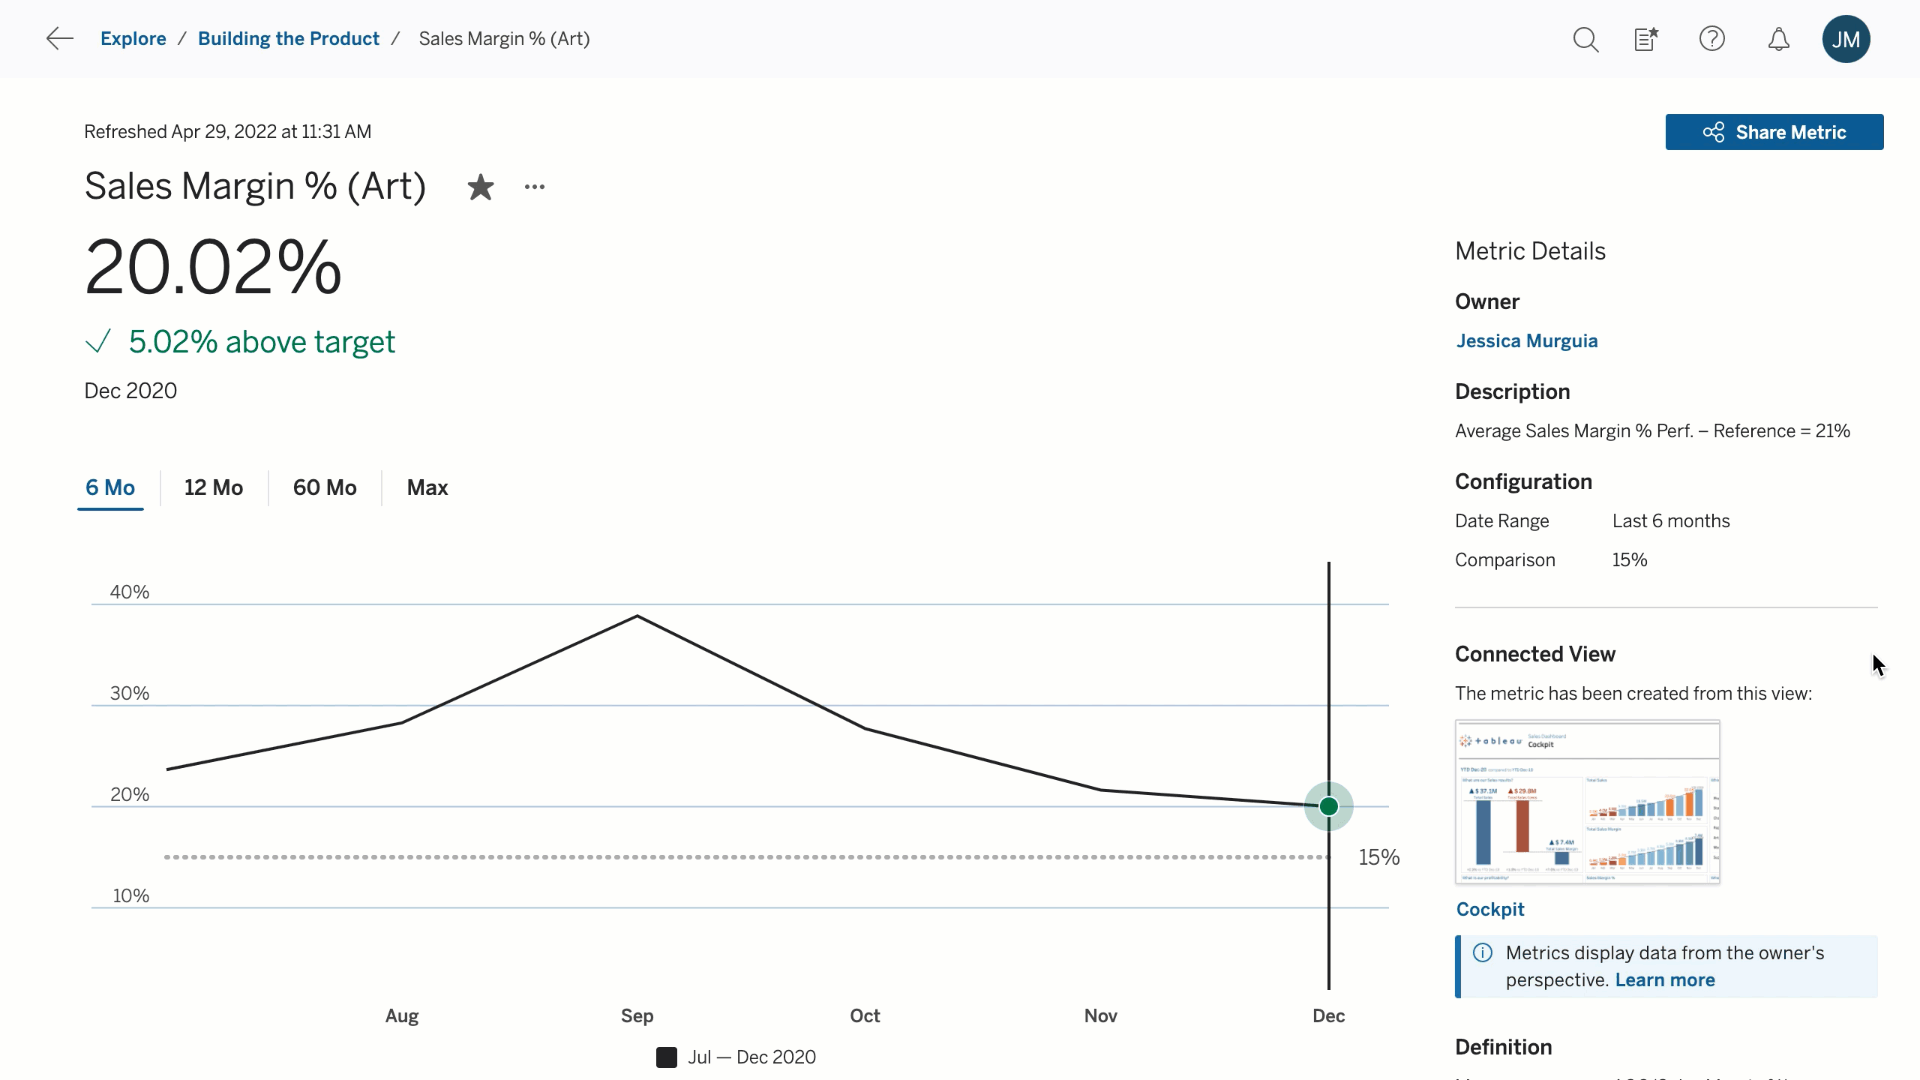
Metrics improvements
Create metrics to track key data points without having to access your dashboards and edit them at any time. You can now come back and edit existing metrics to change the historical comparison period, the date range used by the metric, and the status indicators. Additionally, you can dynamically explore different date windows while analyzing the metric without editing the configuration.
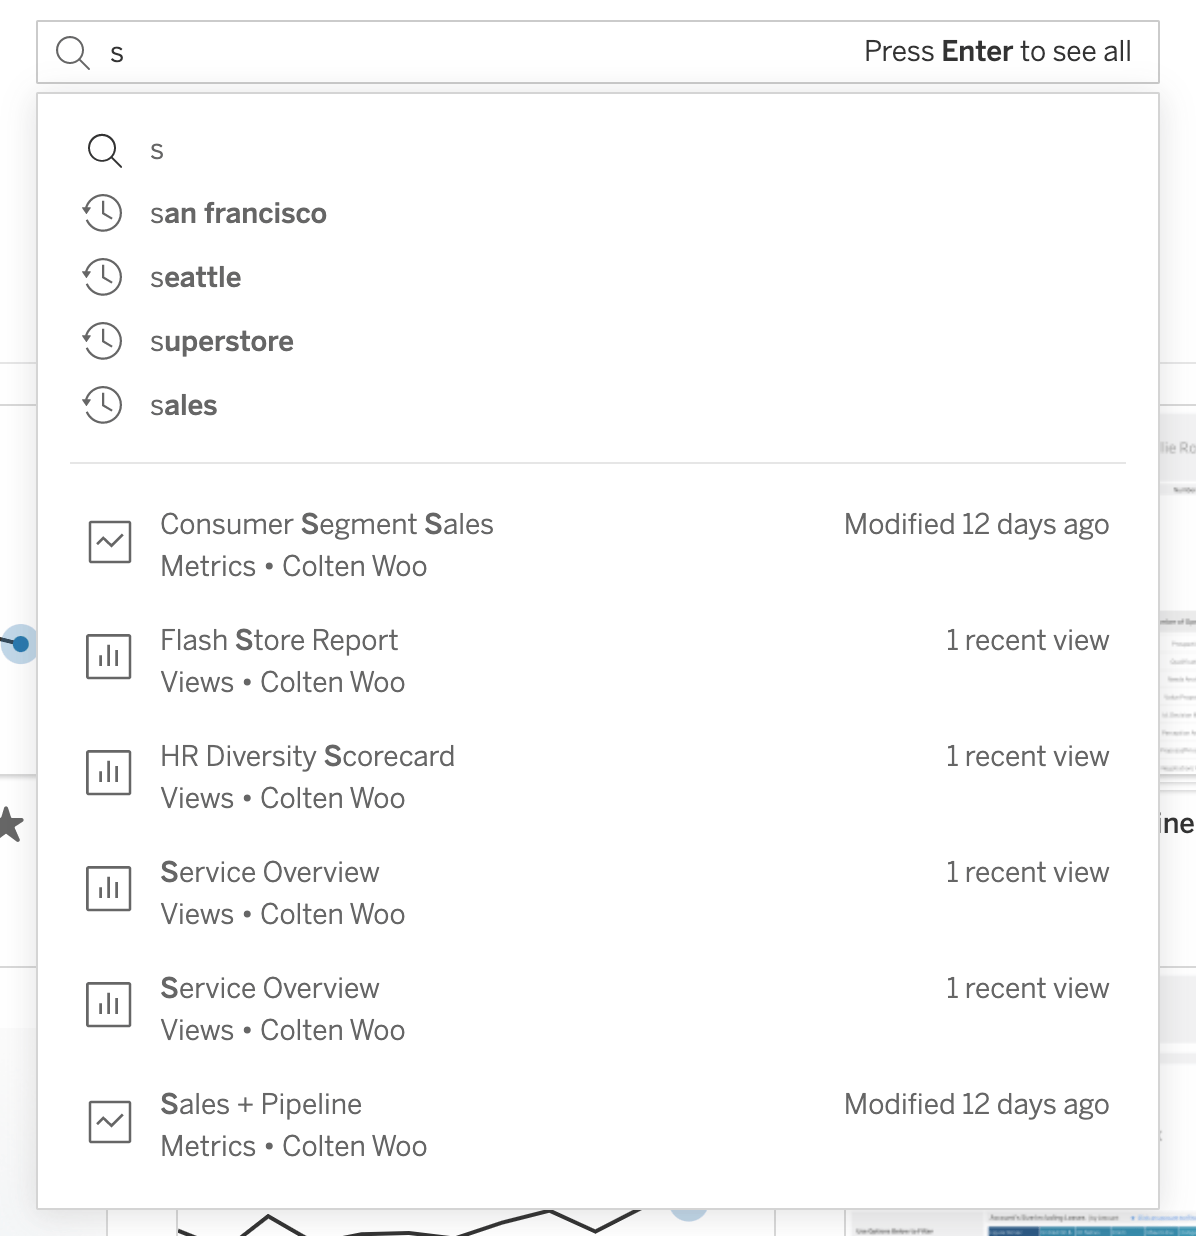
Improved Quick Search
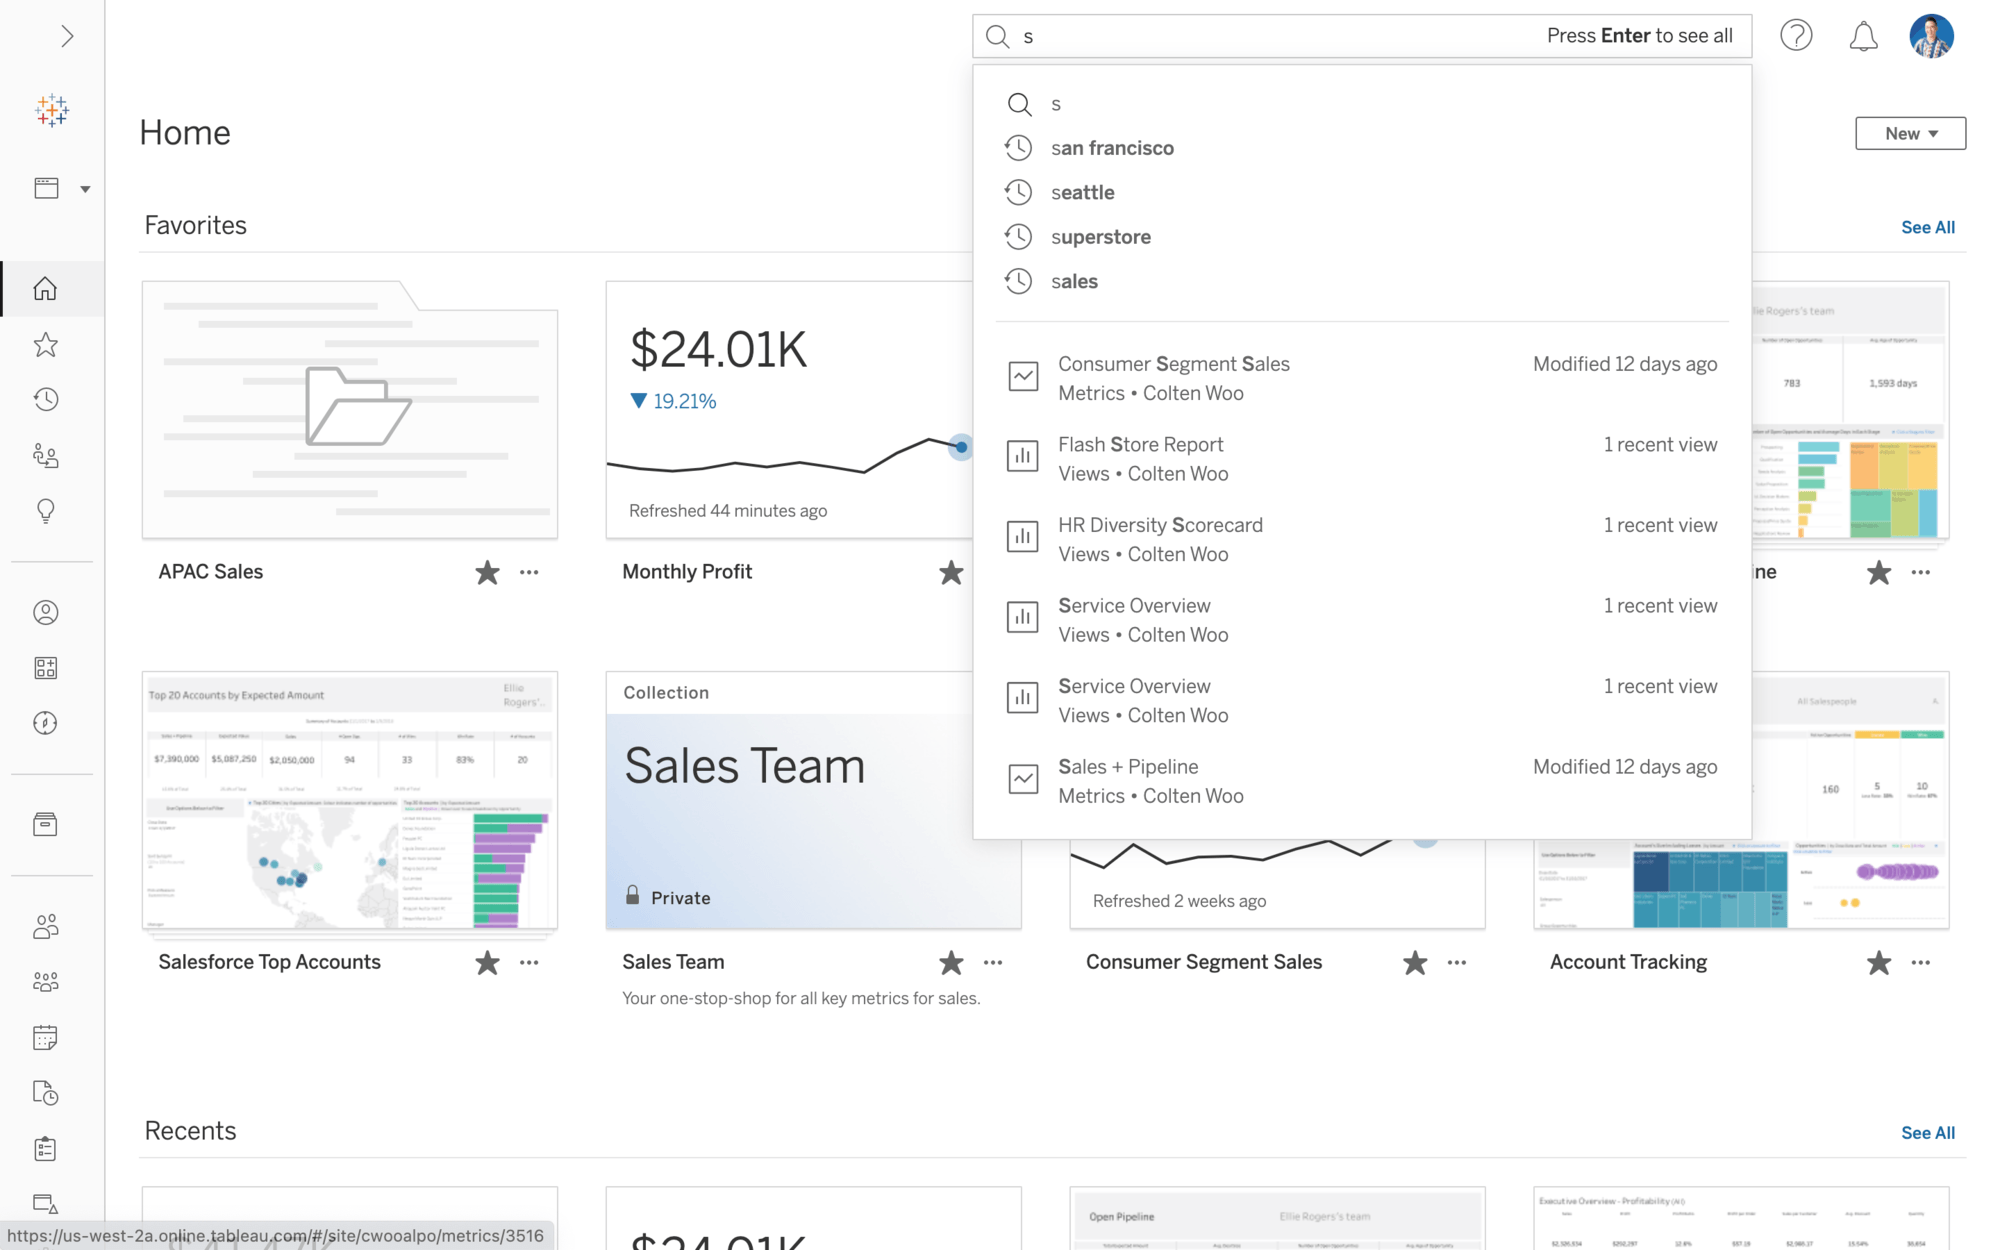
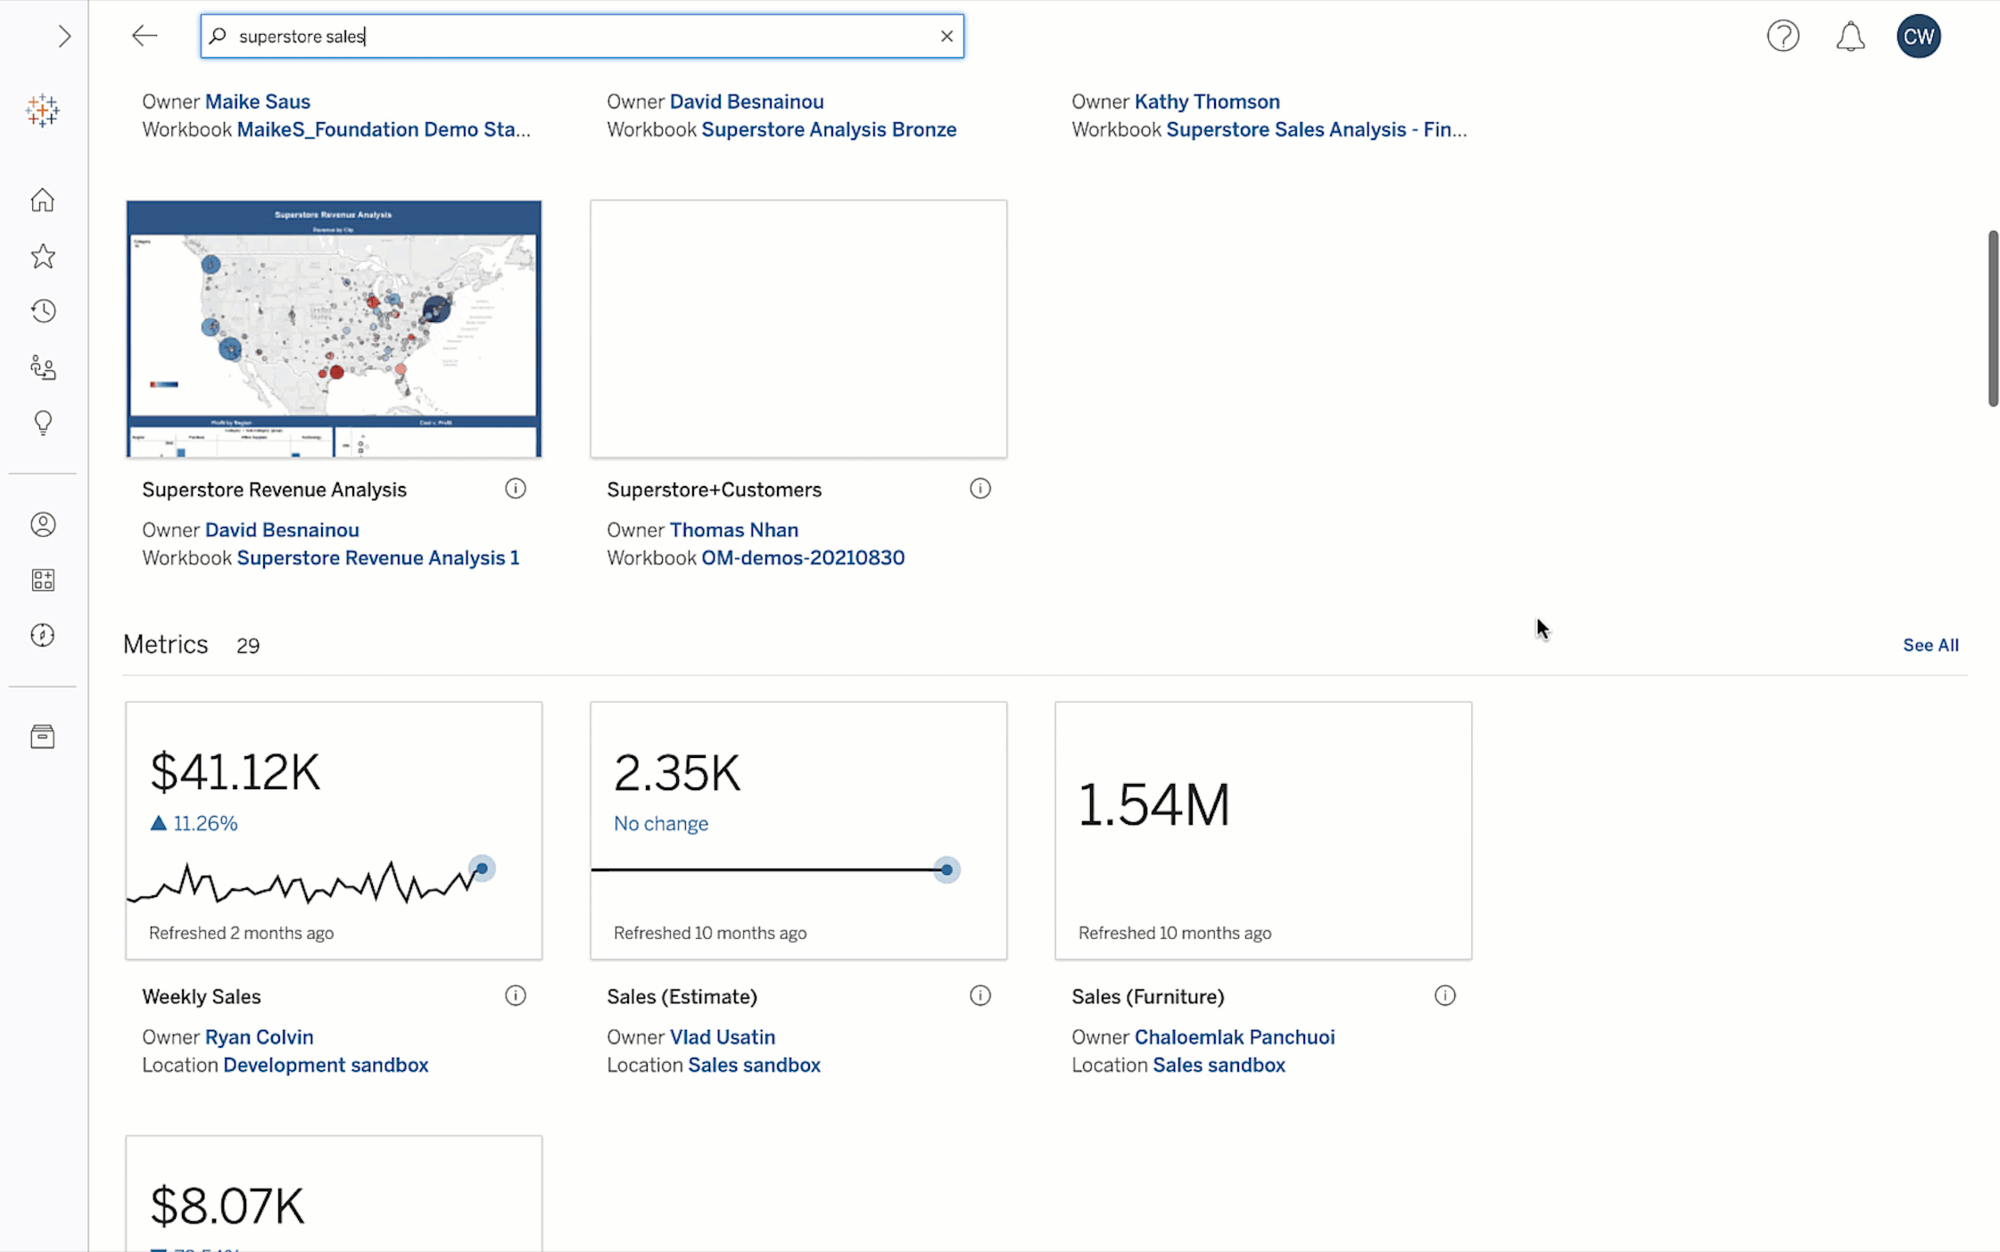
Navigate to relevant content faster and more intelligently in Tableau Cloud. The reimagined Quick Search includes a new suggested content algorithm, a streamlined design, and past searches a click away to save time and speed up your time to insight.
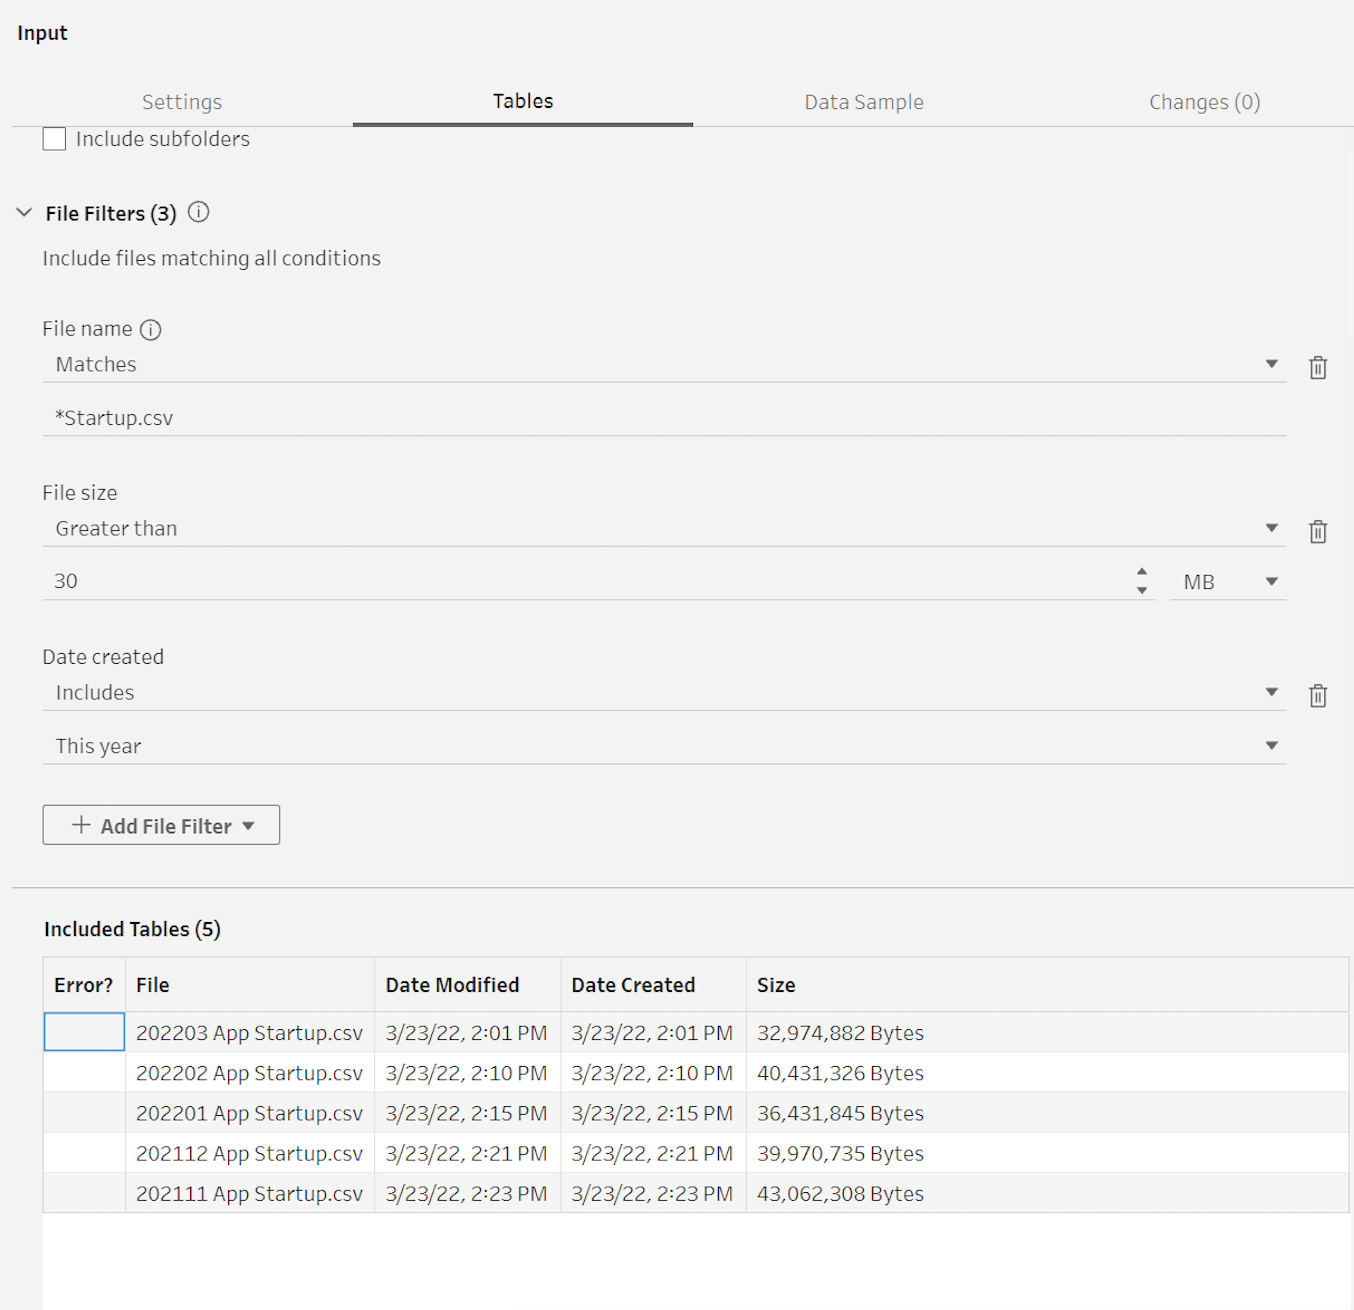
Wildcard Union enhancements in Prep
Select a subset of files from a directory based on a new set of attributes within Tableau Prep. These attributes include file name, creation time, last modified time, last access time and size.
Tableau 2022.1
Tableau 2022.1 มาพร้อมกับความสามารถใหม่ที่ช่วยคุณวิเคราะห์ข้อมูลได้อย่างมีประสิทธิภาพมากขึ้นและจัดการแพลตฟอร์มได้อย่างมั่นใจ ในขณะที่ปรับขนาด Tableau ทั่วทั้งองค์กรของคุณเพื่อให้ทุกคนทำการตัดสินใจทางธุรกิจได้ดีขึ้นและได้รับคุณค่าจากข้อมูลของคุณมากขึ้น
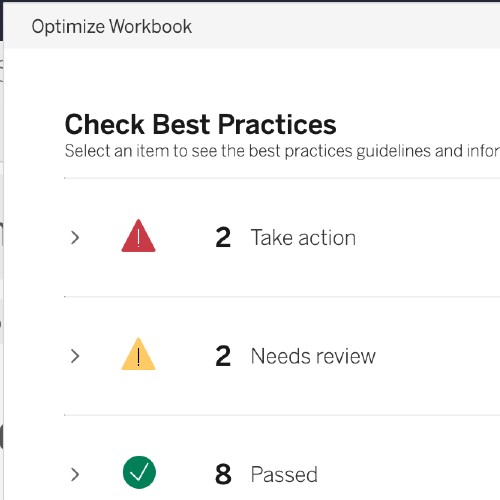
Workbook Optimizer
Optimize your workbook’s performance and understand what tradeoffs you are making without compromising your powerful insights. Workbook Optimizer emphasizes quick actions you can take without making functional changes, the actions that will require trading off functionality for performance, and the best practices you have implemented correctly in your workbook. With concrete guidance on implementing best practices, you can optimize the consumption experience and create dashboards that run smoothly in Tableau Online, Tableau Server, and Tableau Desktop.
New Search Experience
Find content that matters faster. We reimagined Tableau search from the ground up to ensure the most useful content bubbles to the top when you search in Tableau. Results are ranked based on signals like text relevance, popularity, and recency to ensure everyone at your organization can find the data they need to make faster, smarter data-driven decisions.
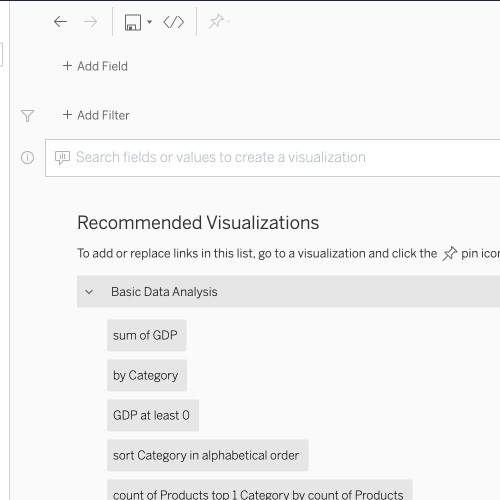
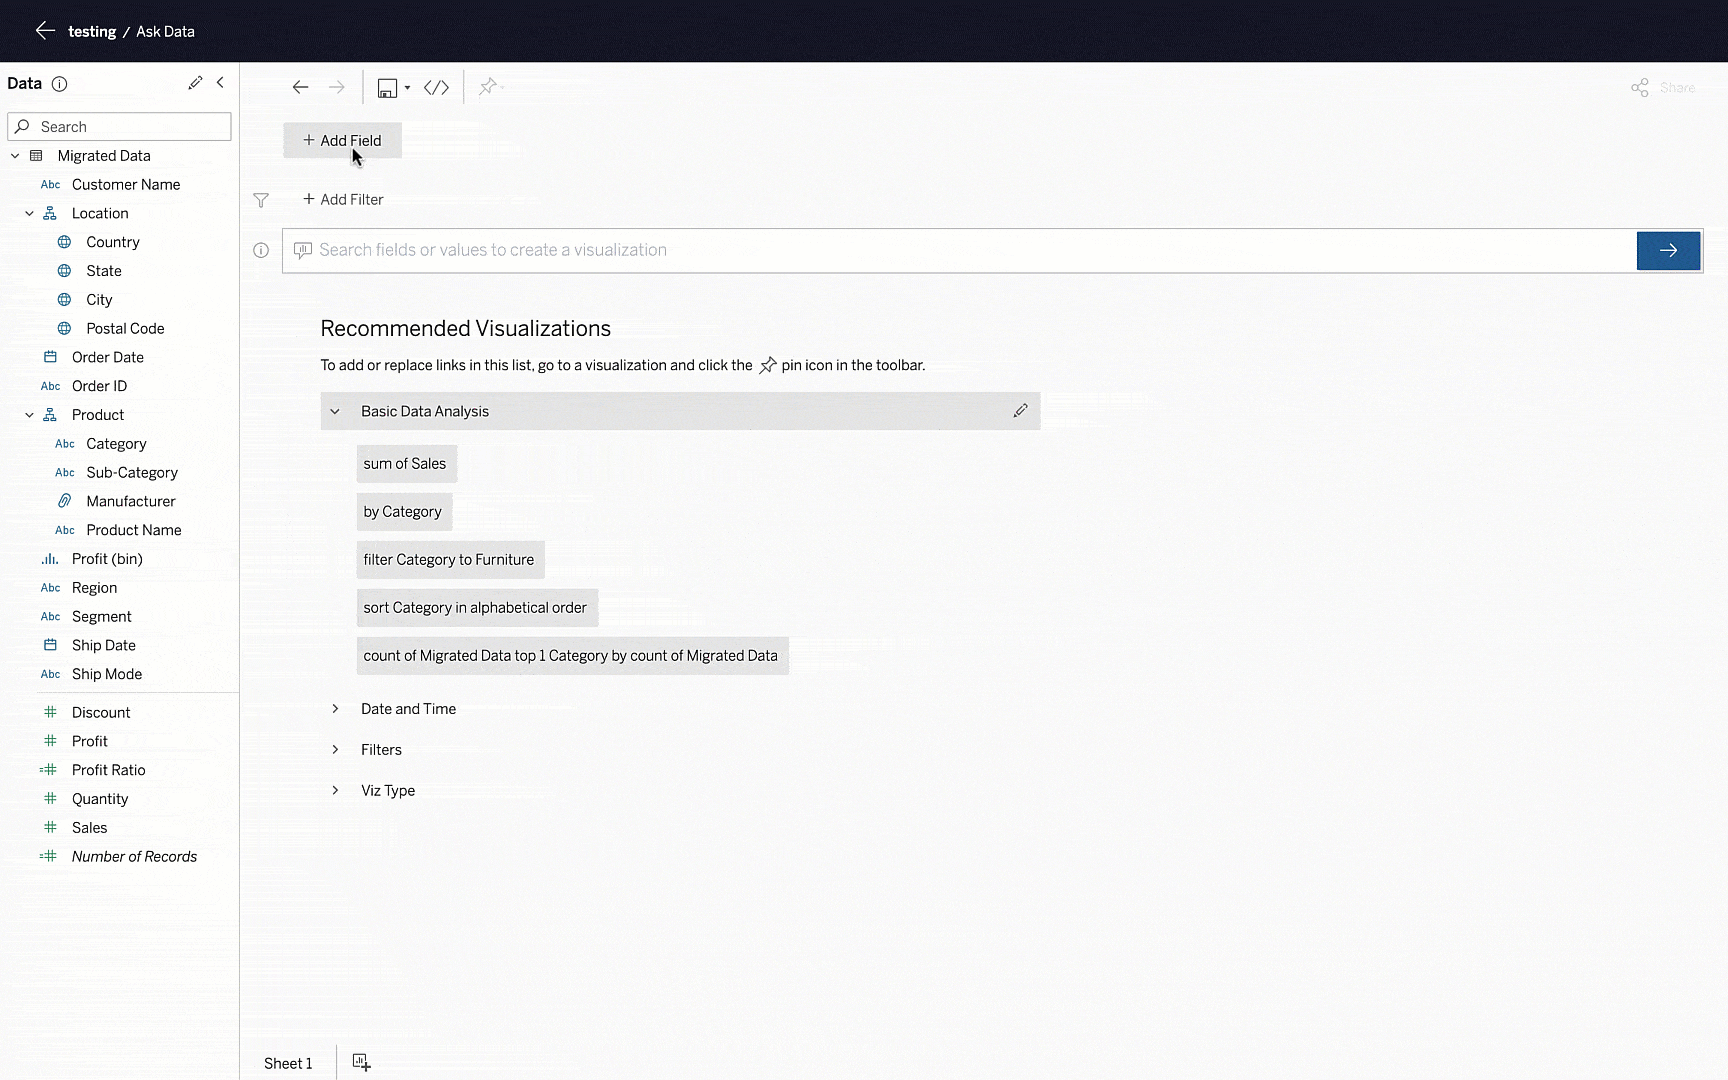
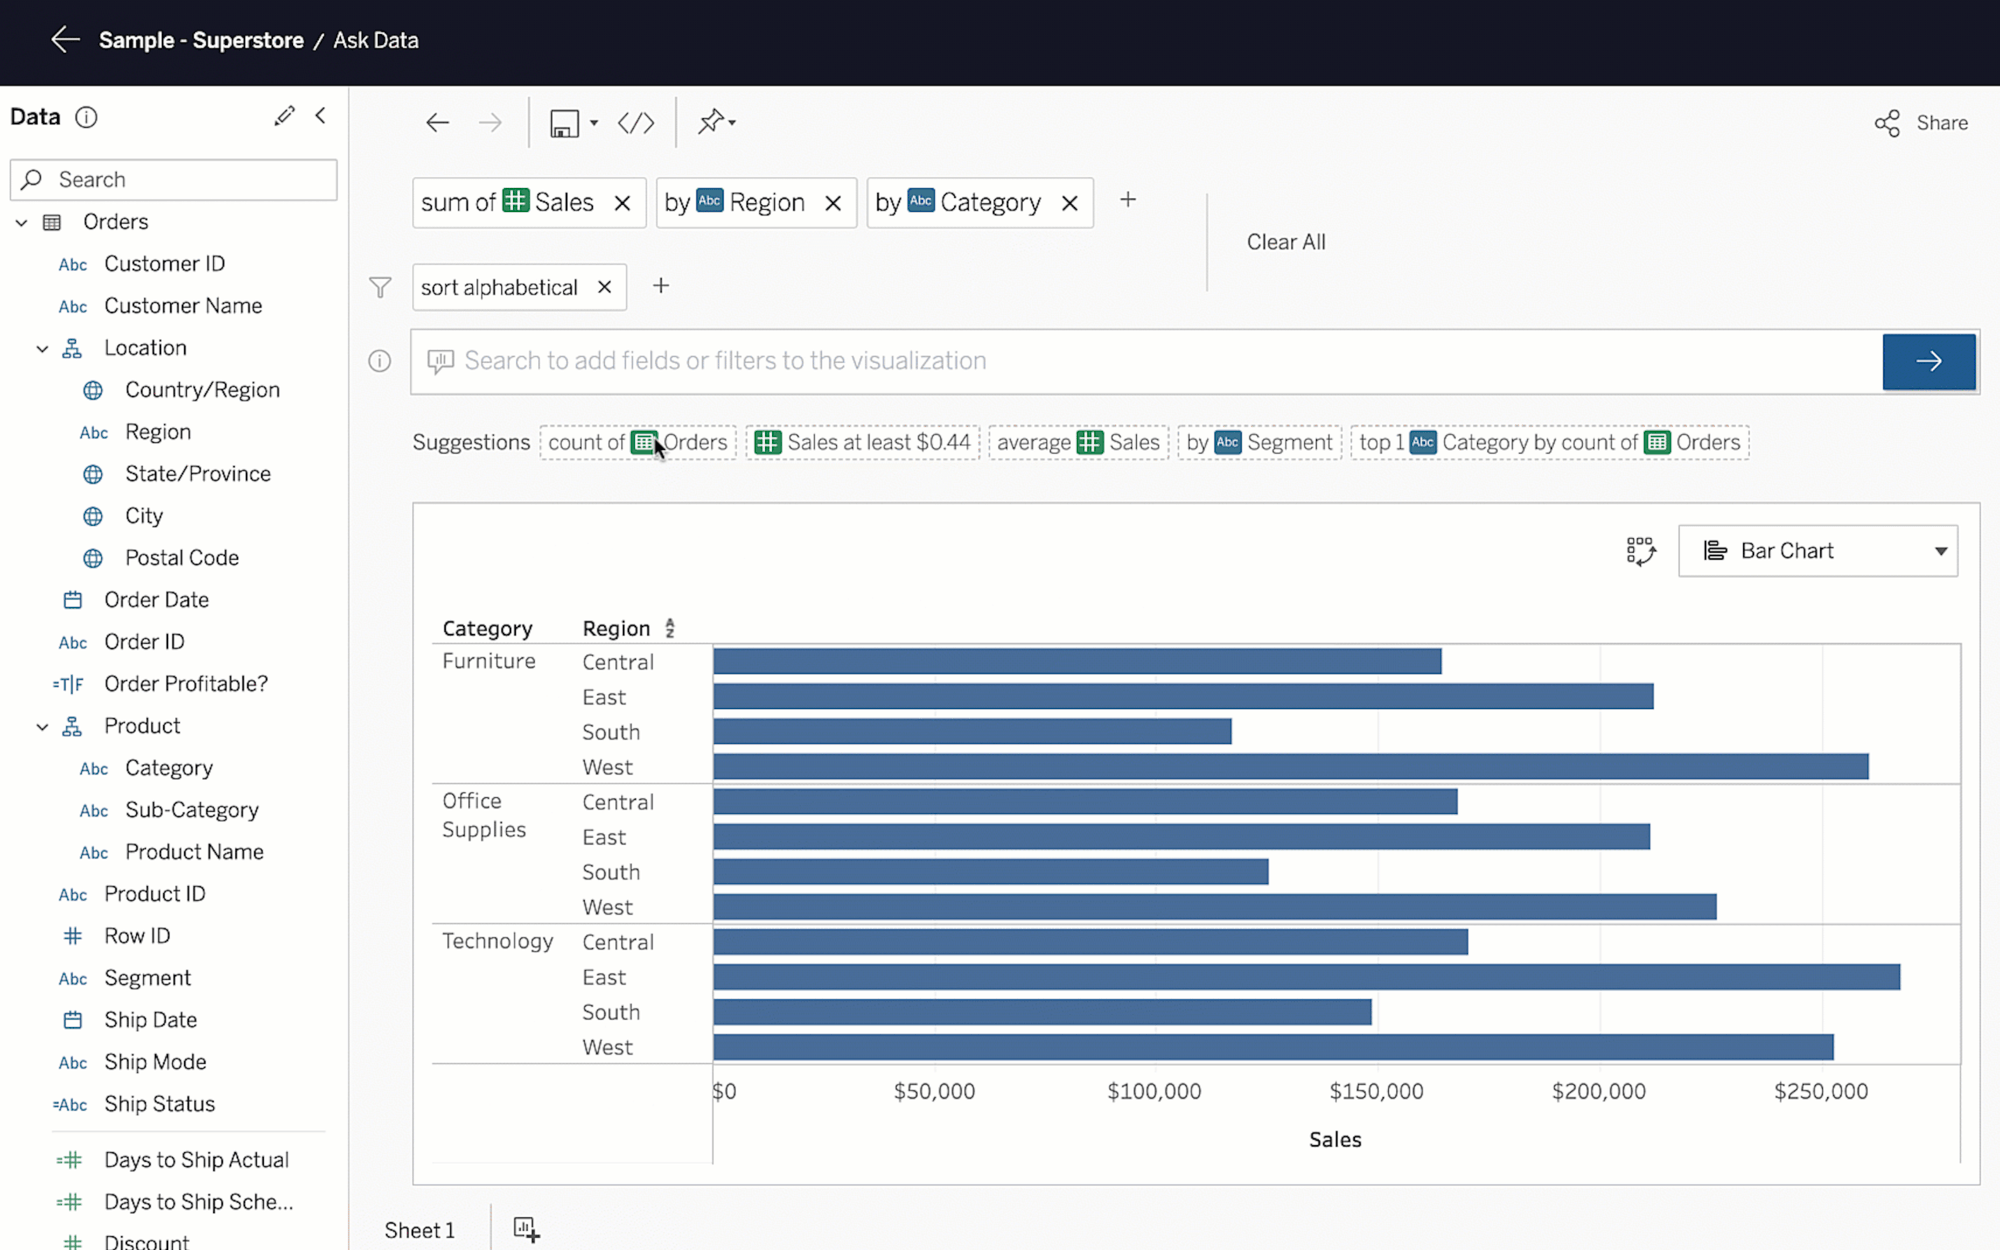
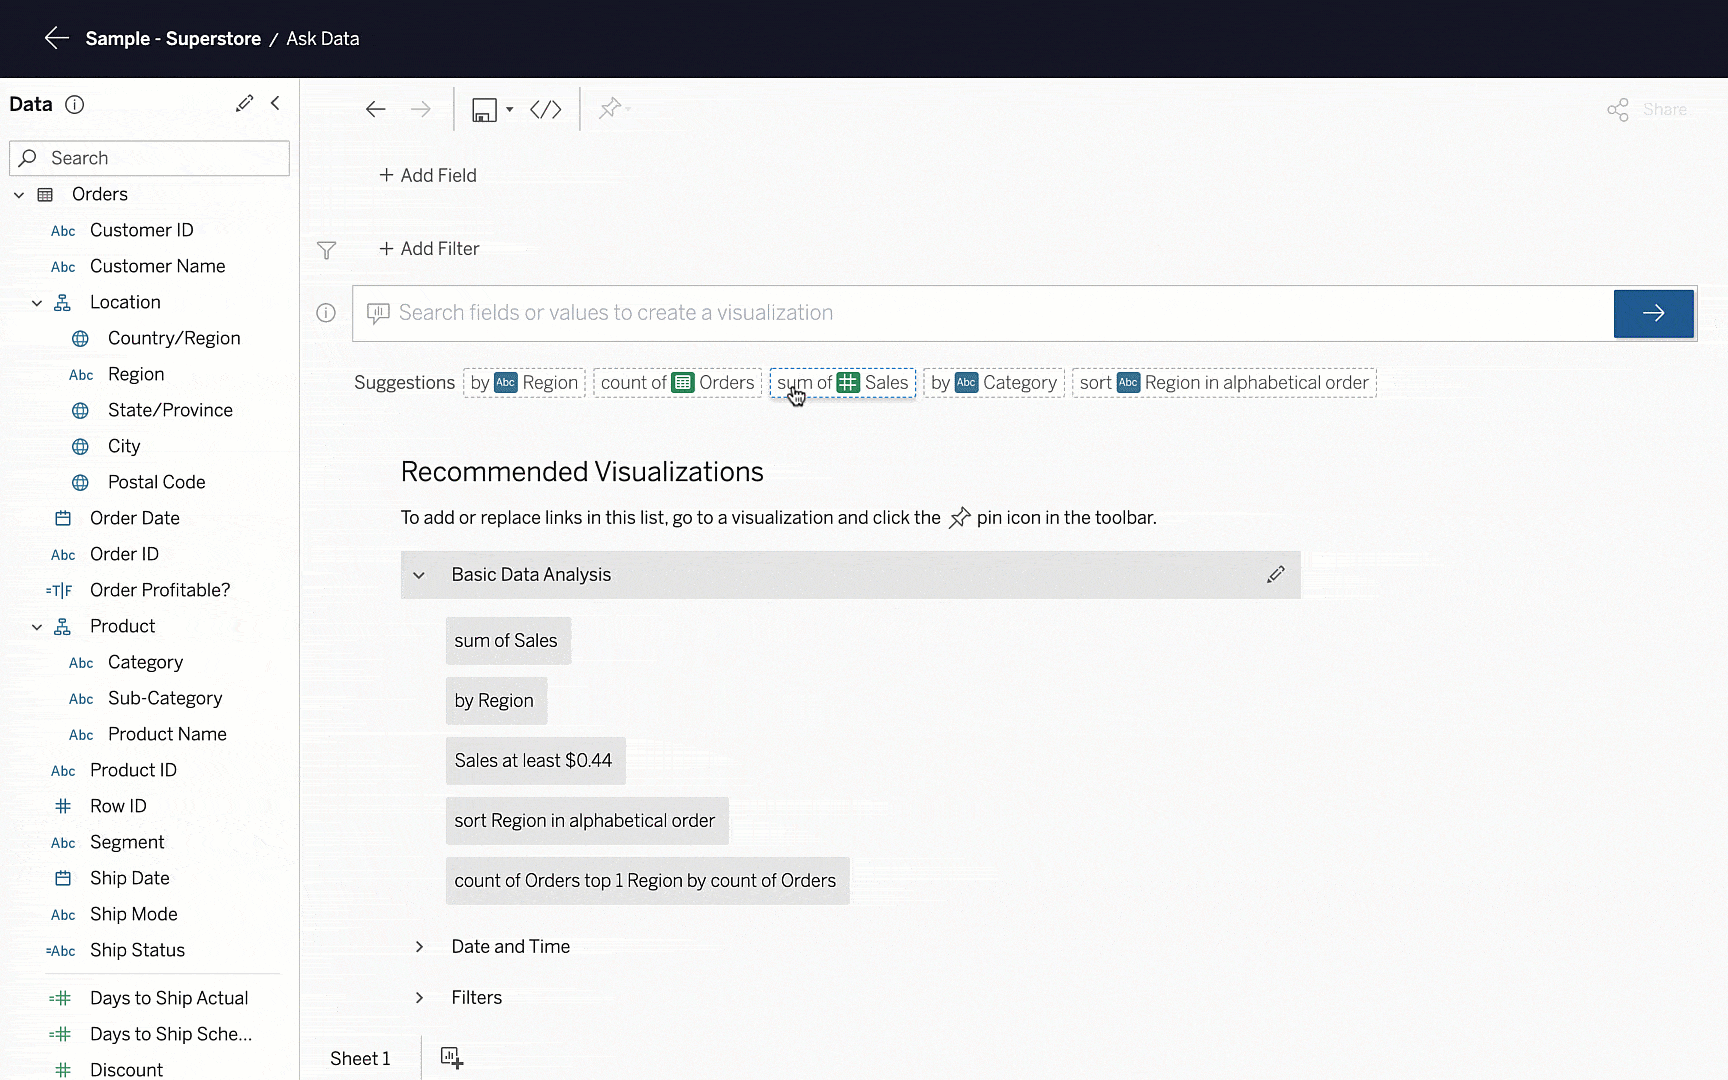
Ask Data Phrase Builder
Does typing a question feel like staring at a blank page when using Ask Data? Sometimes you might not know what to ask just yet, or you may want to familiarize yourself with the data a little more. Tableau has your back! The new Add Field and Add Filter buttons in Ask Data provide an intuitive click-through workflow to help you get the answers you need. The guided workflow provides visual prompts and suggested actions to build your queries (as phrases) with fields and filters relevant to you. The results of your questions or phrases come as rich data visualizations that enable you to get the insights you want from your data. Try Ask Data phrase builder in Tableau Server and Tableau Online.
Enterprise Deployment Guidelines
Deploy Tableau Server using a reference architecture with optimal availability, scalability, security, and performance across web, data, and application layers, in compliance with enterprise data center best practices. This architecture is technology agnostic, supporting bare metal, VM or Container deployment, and platform independent, supporting on-premises or cloud.

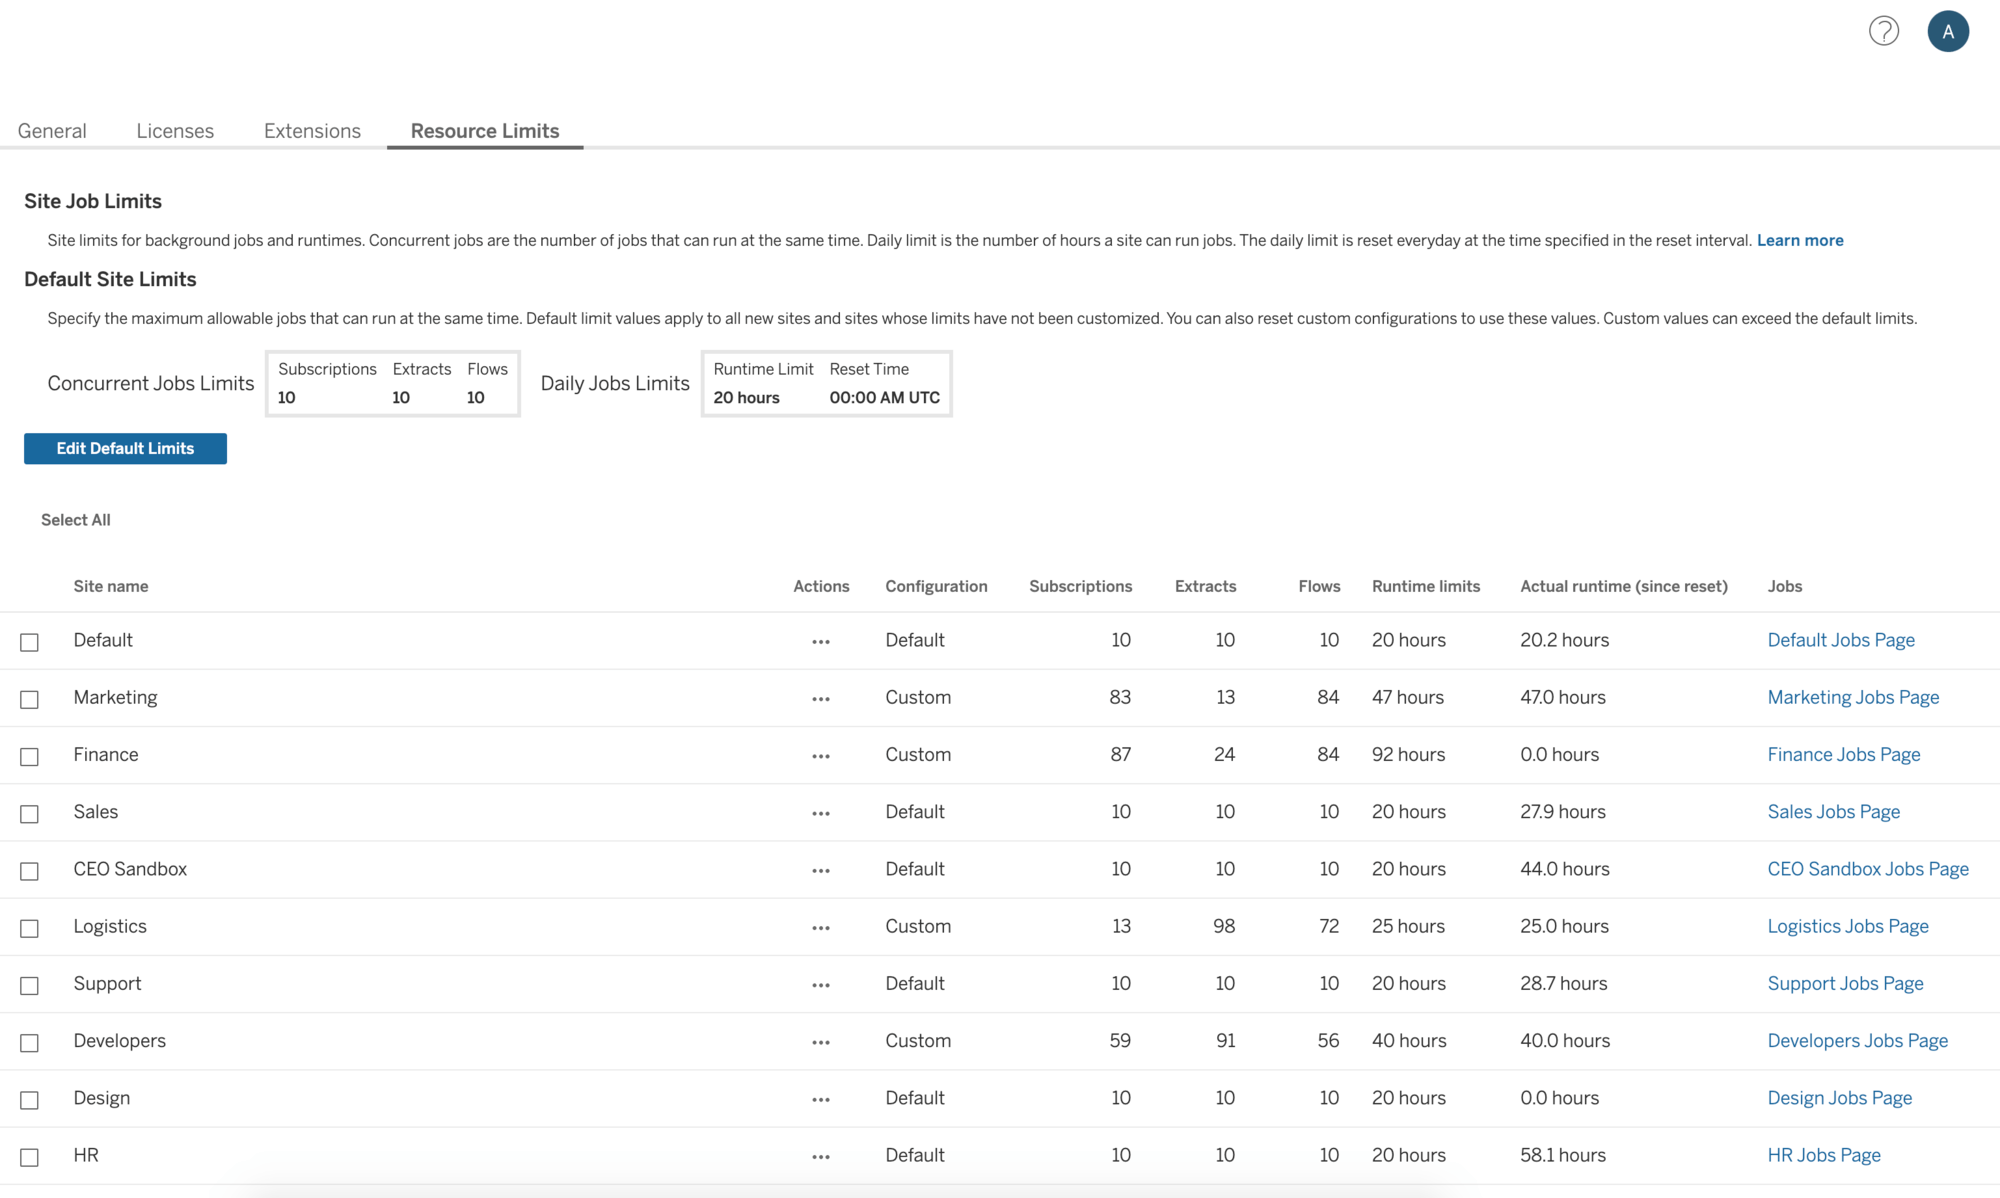
Backgrounder Resource Limits
With Advanced Management for Tableau Server, you can now guarantee that no single site in the deployment can monopolize and negatively impact the performance of the rest of the deployment. Manage Backgrounder resources and control how they are used by setting limits on the number of background jobs running at the same time on a site. In addition, specify the number of Backgrounder hours that a site can use to run jobs per day.
Customize View Data
Design exactly how you want to present the tabular data behind a visualization within the View Data interface. Remove columns from the default view, change their order, sort them, or add additional columns to provide deeper context. Additionally, you can download underlying data as a CSV file with all design changes applied to share with your team. Customize View Data is available in Tableau Online, Tableau Server, and Tableau Desktop.
Tableau 2021.4
Tableau 2021.4 มาพร้อมกับความสามารถใหม่เพื่อสนับสนุนการวิเคราะห์ที่เชื่อมต่อและปลอดภัยมากขึ้นในลำดับงานธุรกิจของคุณ และแน่นอนว่ายังมีความสามารถที่ดีเยี่ยมในการช่วยให้คุณทำงานเร็วขึ้นและรับคุณค่าจากข้อมูลของคุณมากขึ้น
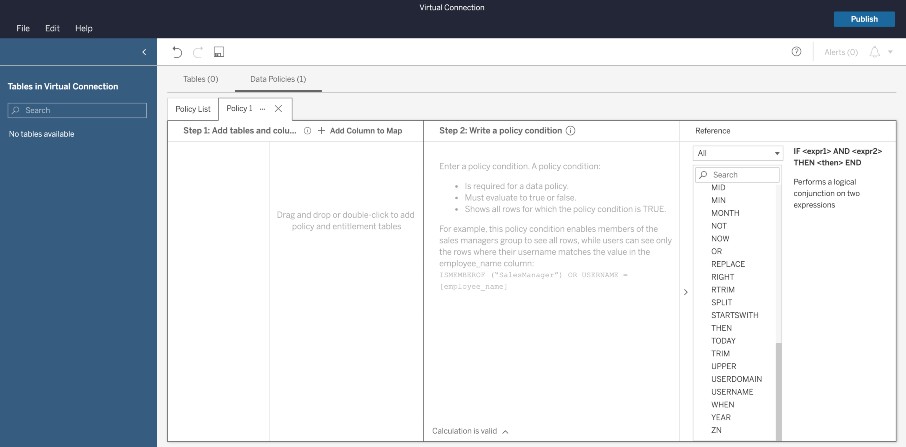
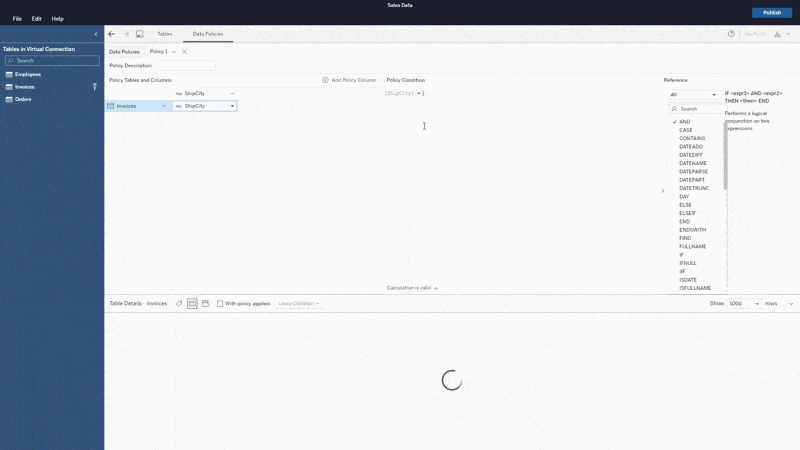
Virtual Connections
Virtual connections are a new content type in Tableau Server and Tableau Online that are used to create and share access to tables, securely embed service account credentials, define Data Policies, and extract data centrally.
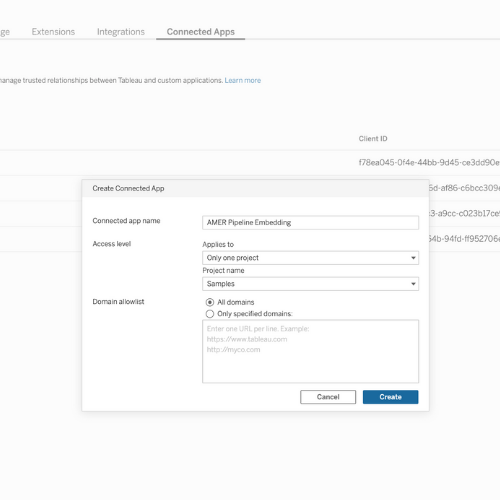
Connected Apps
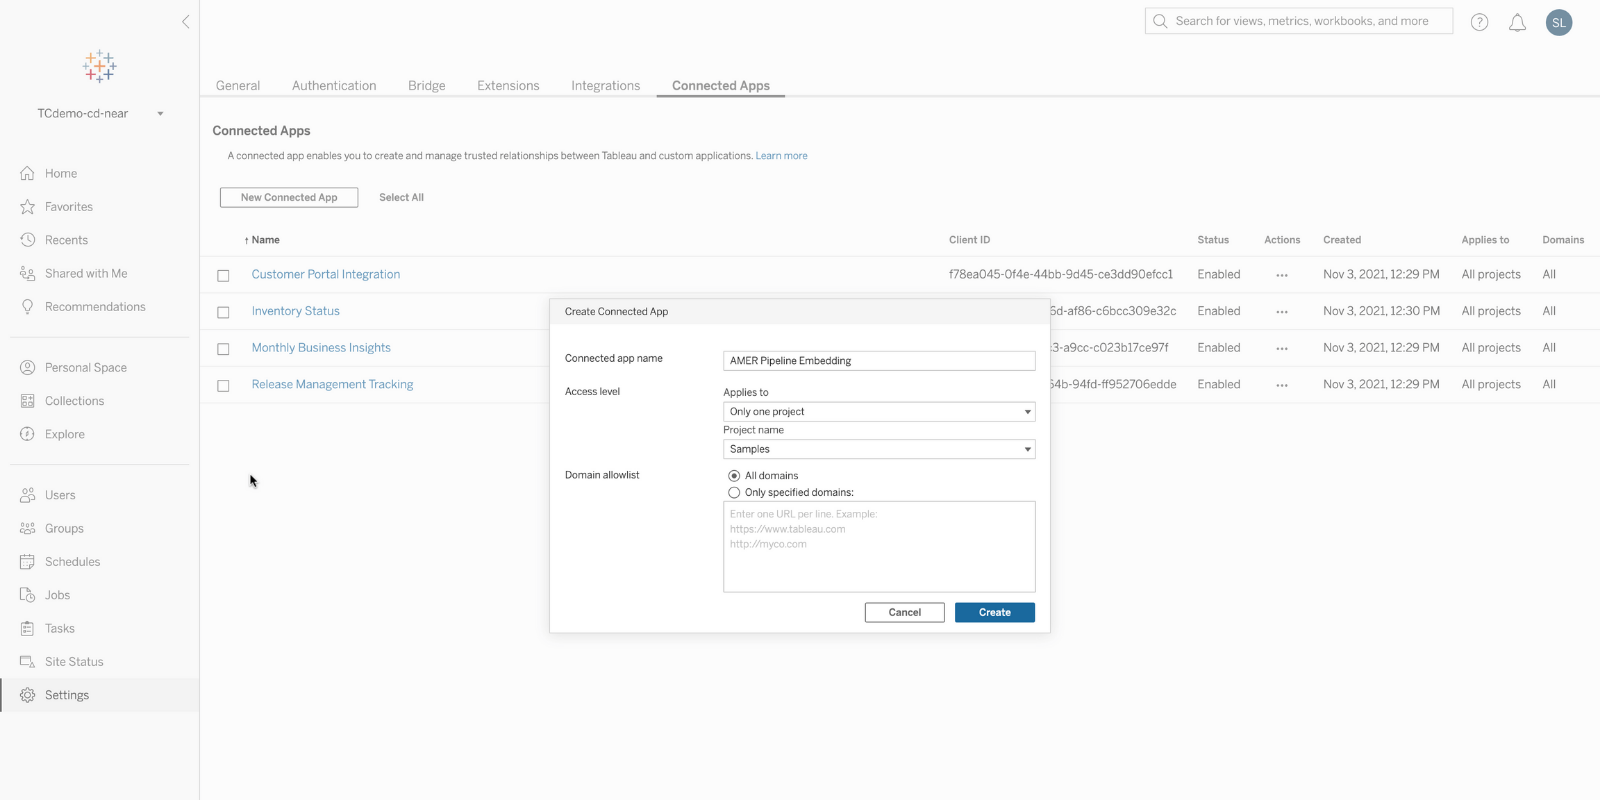
Enjoy a flexible way to integrate Tableau into your broader technology stack. Connected Apps create seamless and secure experiences with simple and trusted relationships between your applications and Tableau using modern, secure, easy-to-use authentication services.
With Connected Apps, Tableau admins have better control over security. You can set up a trusted relationship between Tableau and any external third-party application servers that use standards to embed a Tableau visualization without requiring users to log in to Tableau. Additionally, you can control user access to embedded content and restrict what content can be embedded.

Ask Data and Slack integration
21.4 brings improved Slack integration to further broaden the reach of analytics across your business. You can now share a viz generated in Ask Data in Tableau directly to Slack, making it even easier to share insights with your team mates.
Centralized Row-Level Security
Centrally define and manage row-level security among Data Tables and have it consistently applied across all connected Tableau Flows, Data Sources, or Workbooks that depend on that data.
Edit published data sources
Managing data sources on the web just got easier. Say goodbye to downloading published data sources to Desktop to make your changes. You can now edit published data sources directly in Tableau Server and Tableau Online, test your changes, and publish—all without leaving the browser.
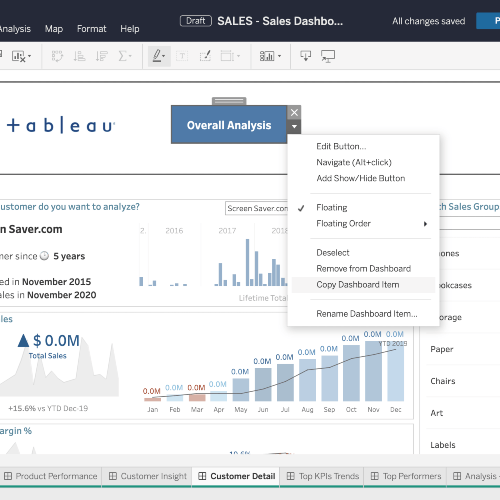
Copy and paste in dashboards
Easily copy and duplicate images, text boxes, and web page containers within the same and across different dashboards and workbooks in Tableau Online, Tableau Server, and Tableau Desktop. This new functionality allows you to build beautiful customized dashboards faster by maintaining and replicating the format, size, and details of already formatted items.
Tableau 2021.3
Tableau 2021.3 มาพร้อมกับความสามารถใหม่ที่เพิ่มศักยภาพให้กระบวนการทำงานและองค์กรของคุณ เพื่อให้คุณและทีมของคุณสามารถเคลื่อนไหวเร็วขึ้นและทำการตัดสินใจทางธุรกิจได้มีประสิทธิภาพมากขึ้น จุดเด่นประกอบด้วยการอัปเดต Data Management การแจ้งเตือน Tableau สำหรับ Slack และพื้นที่ส่วนตัวบน Tableau Server และ Online

Linked tasks with Tableau Prep Conductor
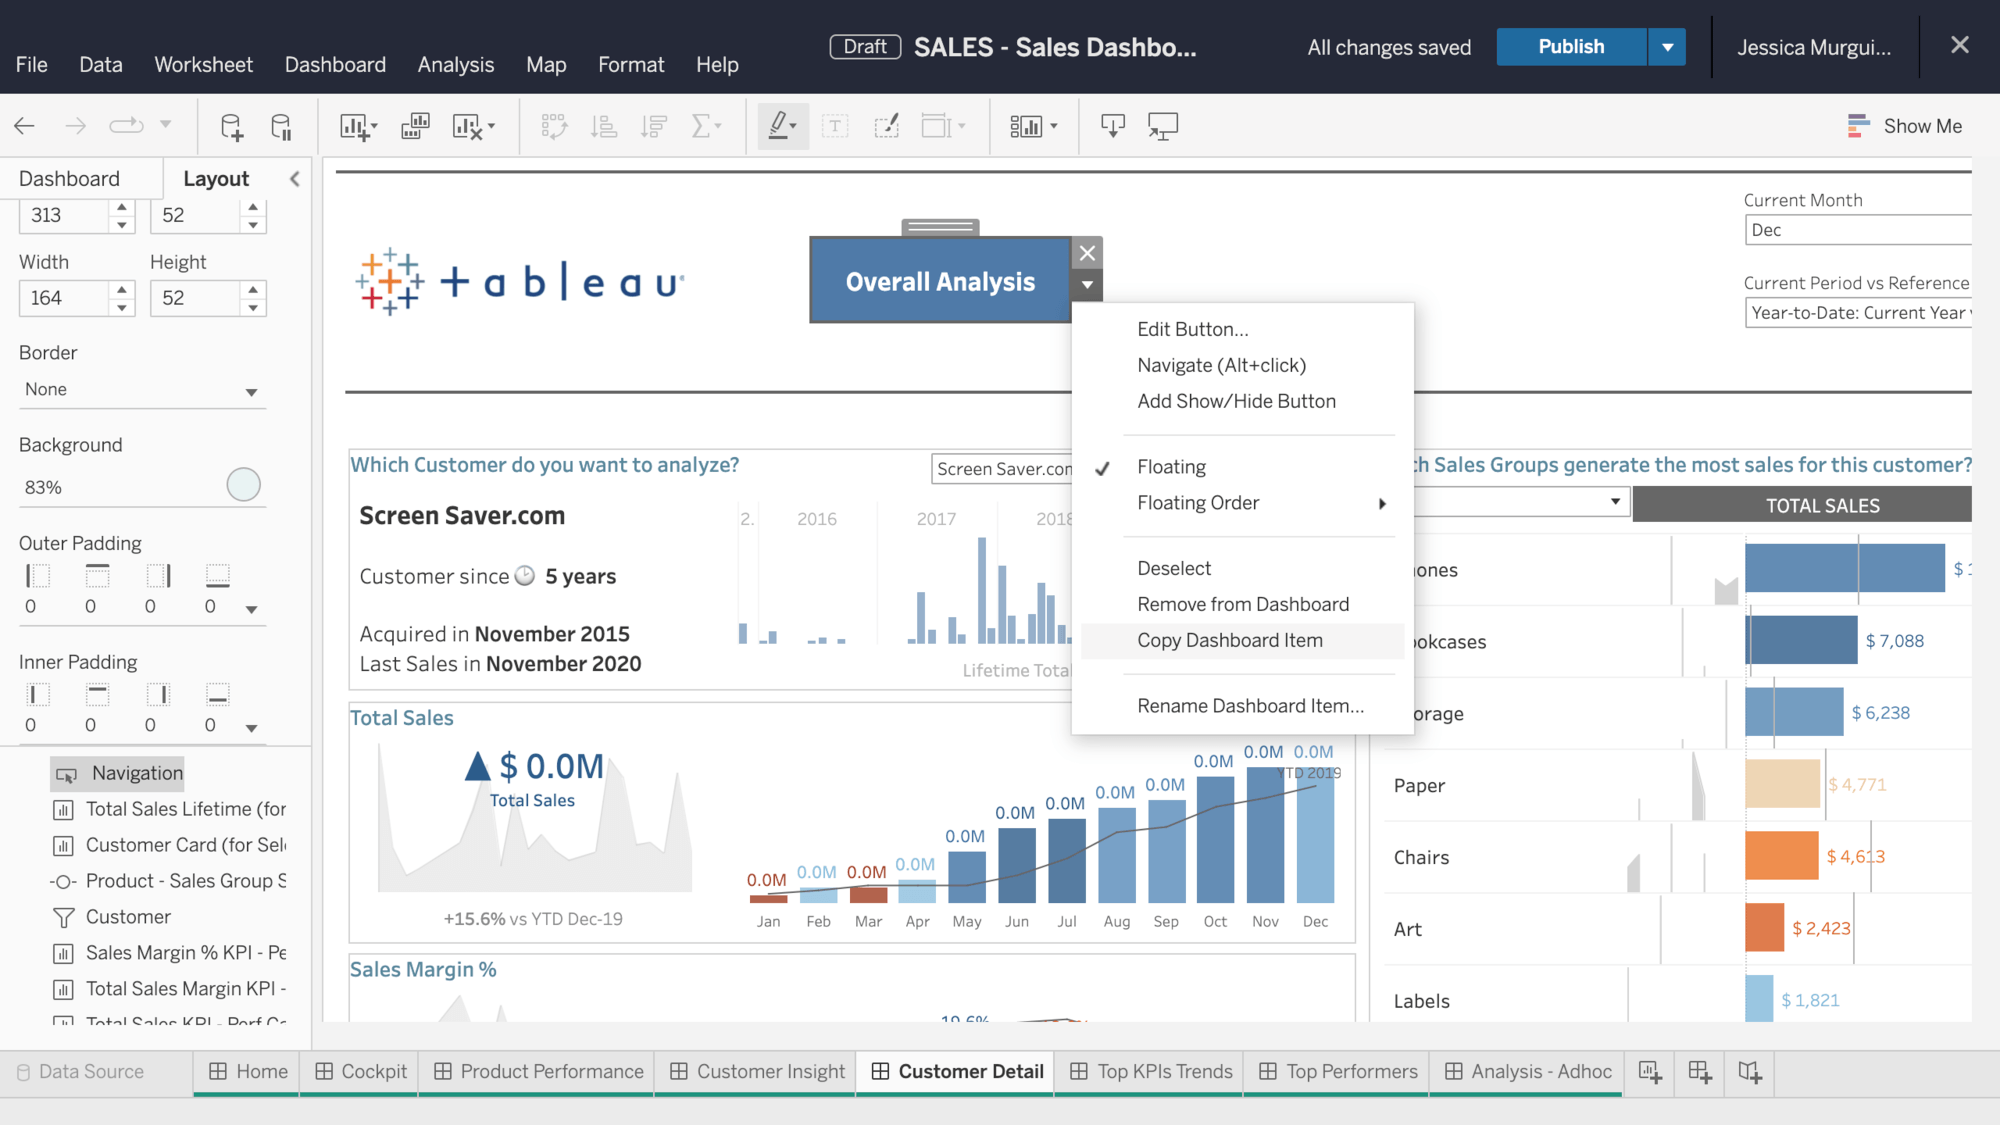
With Linked tasks in Tableau Prep Conductor, you can now schedule flows to run after one another on Tableau Server. Easily automate the orchestration of multiple flow jobs, ensuring they happen in sequence after each task completes successfully.
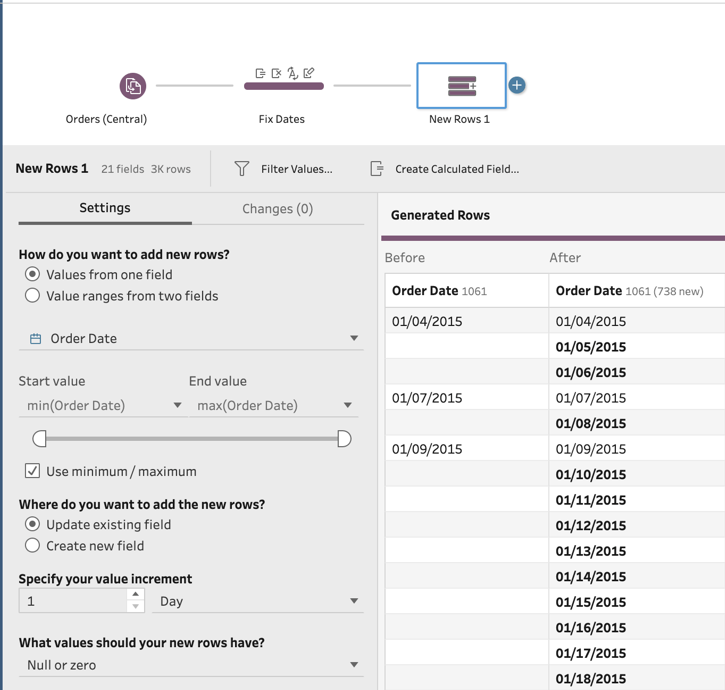
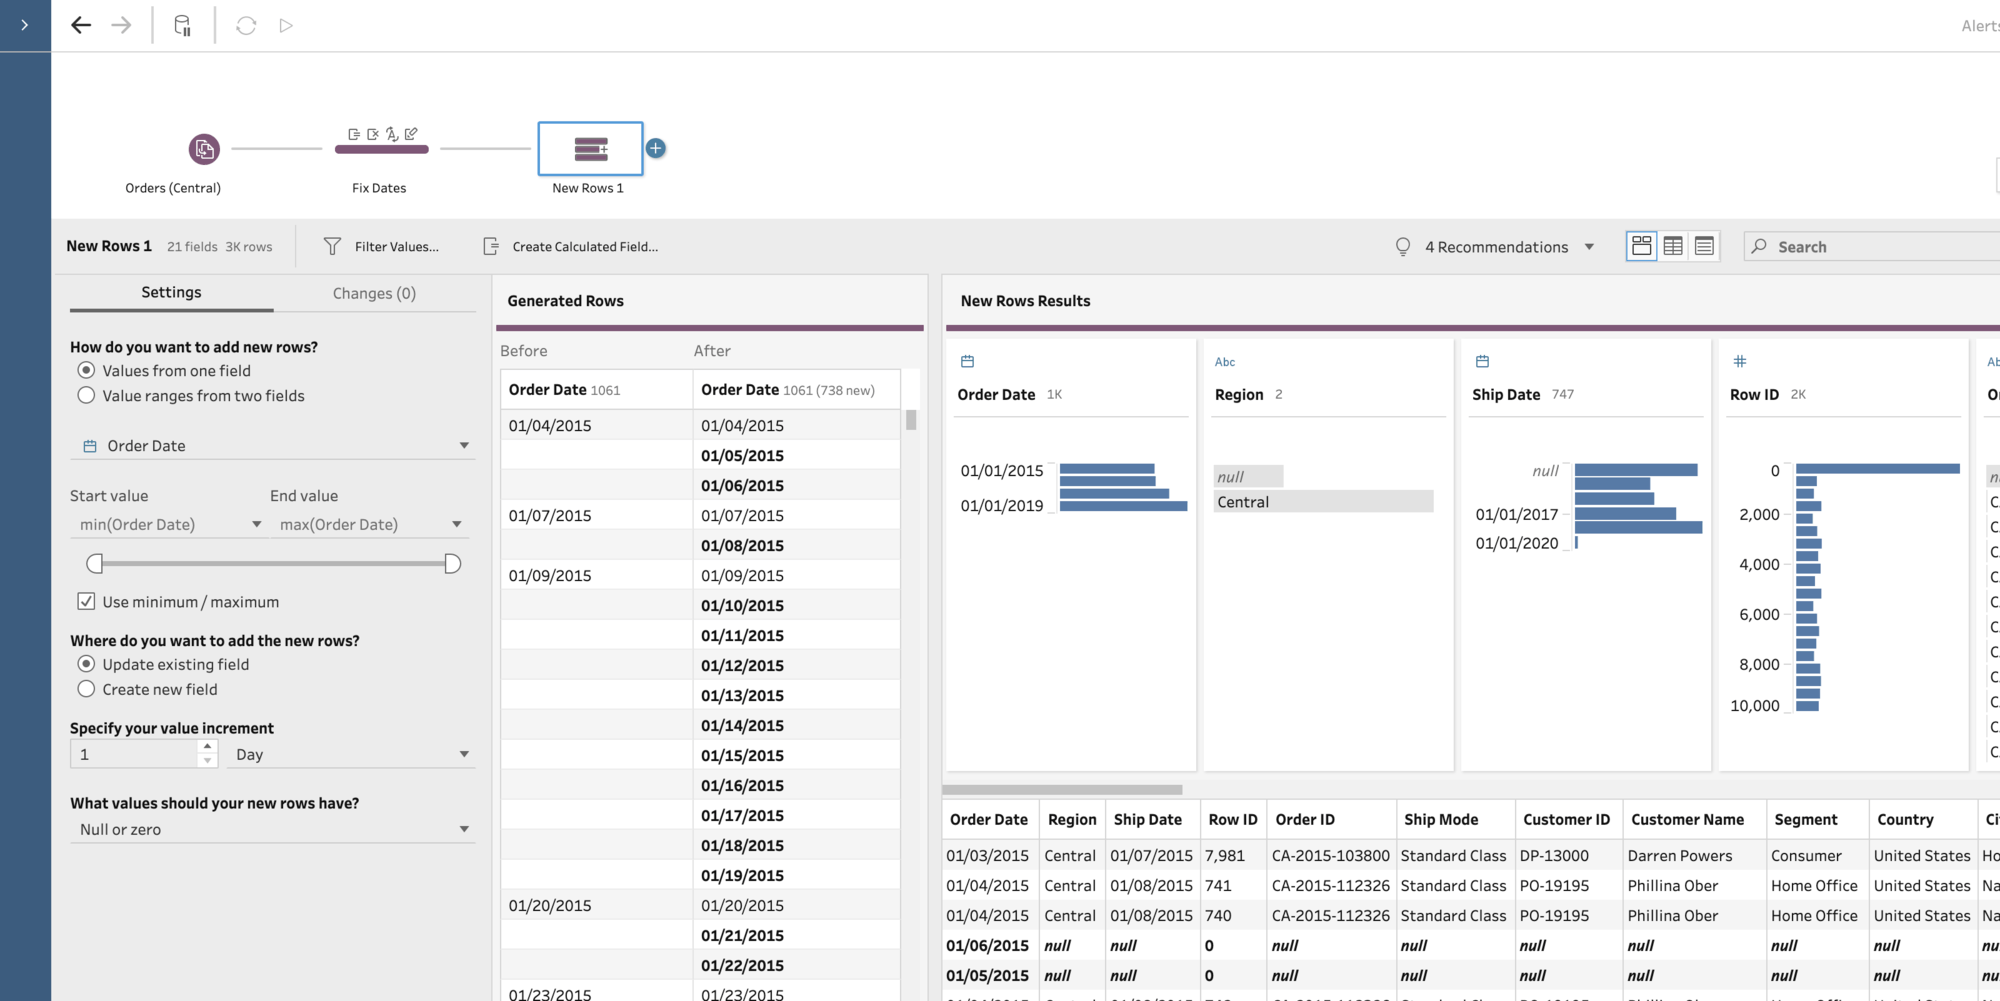
Generate rows with Tableau Prep
Generate a set of missing rows in a table with Tableau Prep based on dates, date times, or integers. Easily fill gaps in data to ensure downstream processes have full and complete datasets to work on, and build more accurate visualizations.
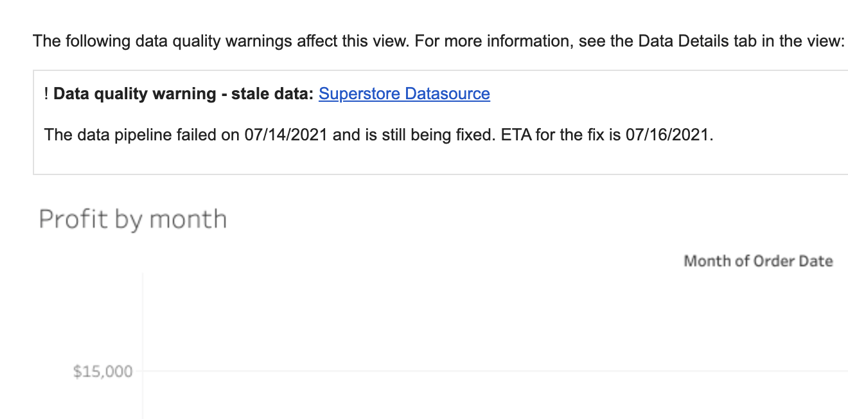
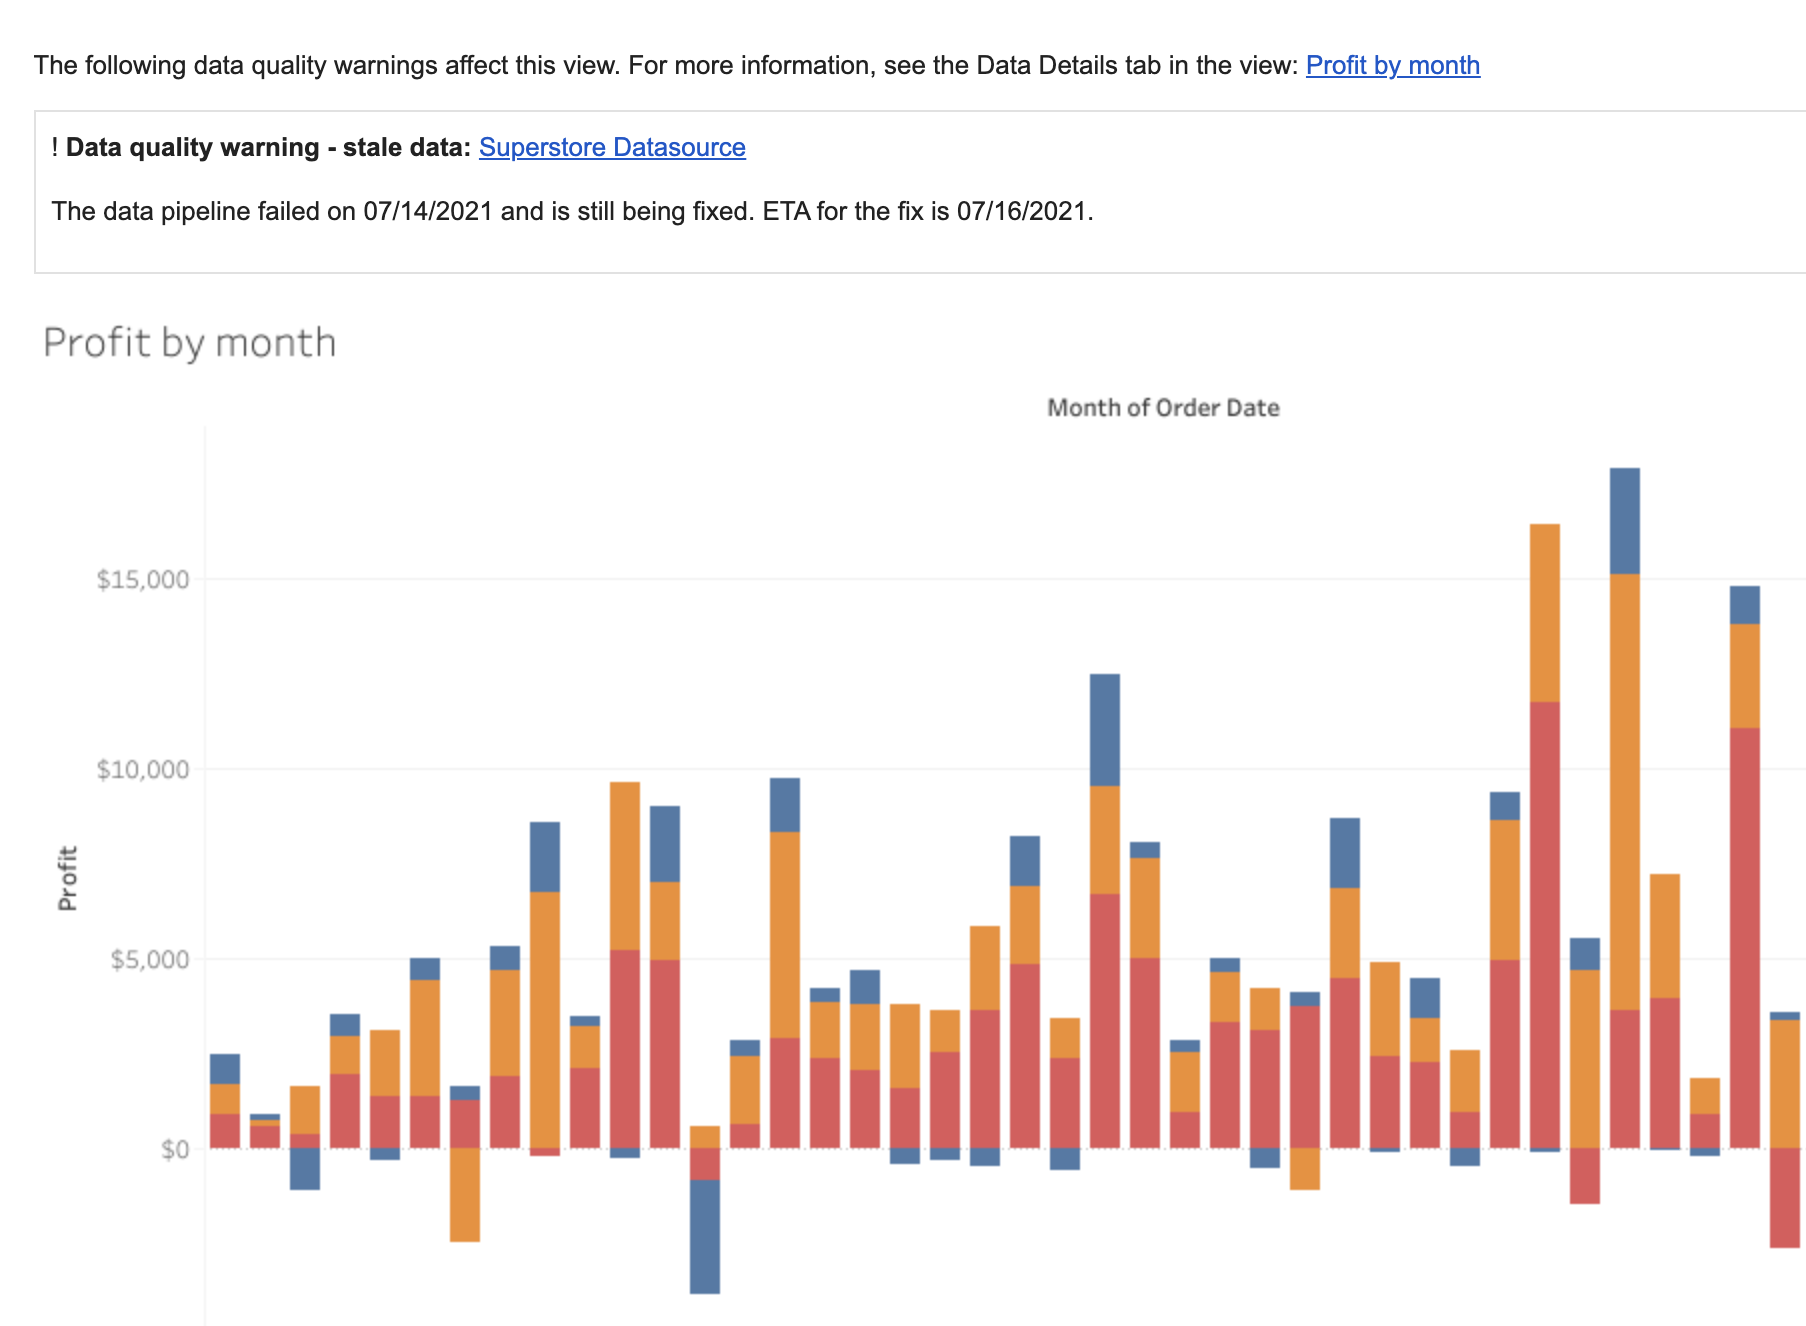
Data quality warnings in subscription emails
Get notified about potential issues with data through Data quality warnings (DQW) directly in email subscriptions. Simply click on the link in the email to go directly to the dashboard impacted by the warning, and see additional details right away within the Data Details panel.
Inherited descriptions in web authoring
With Tableau Catalog, you can now see inherited descriptions right within your web authoring flow. If a description for a field or a column exists upstream from that field or column in a data source or a workbook, you'll be able to see information about where the description is inherited from.
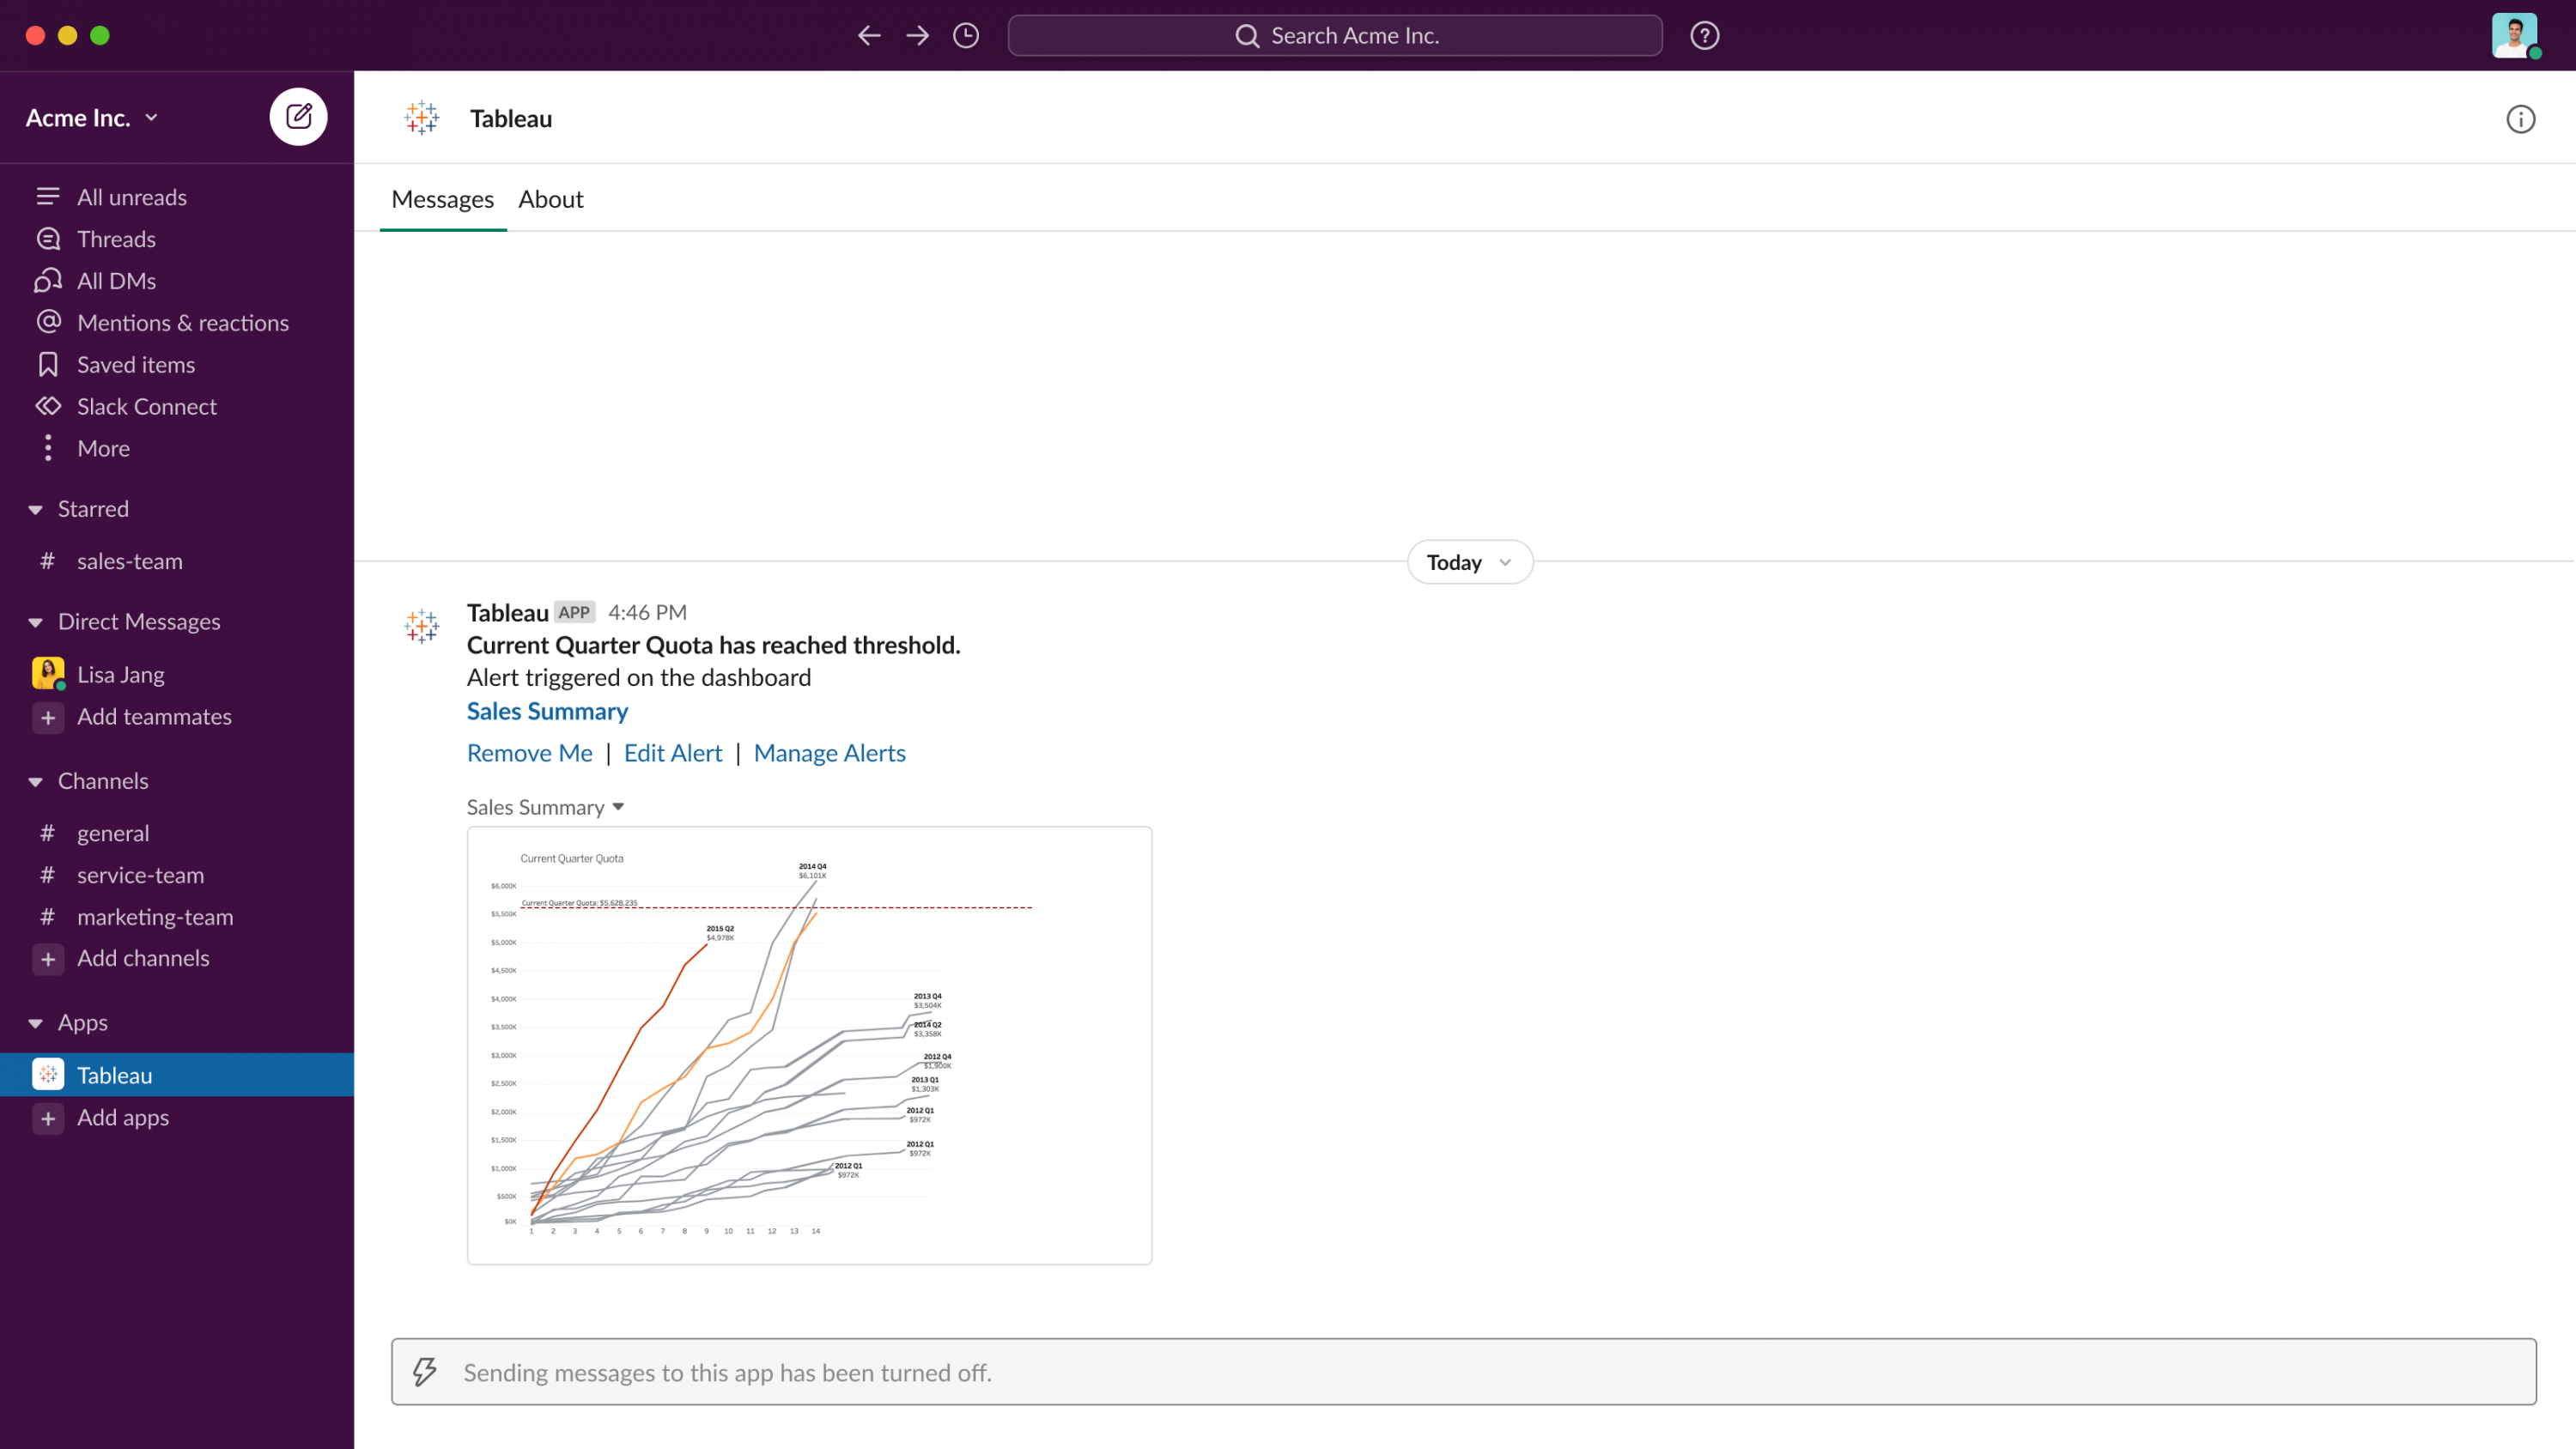
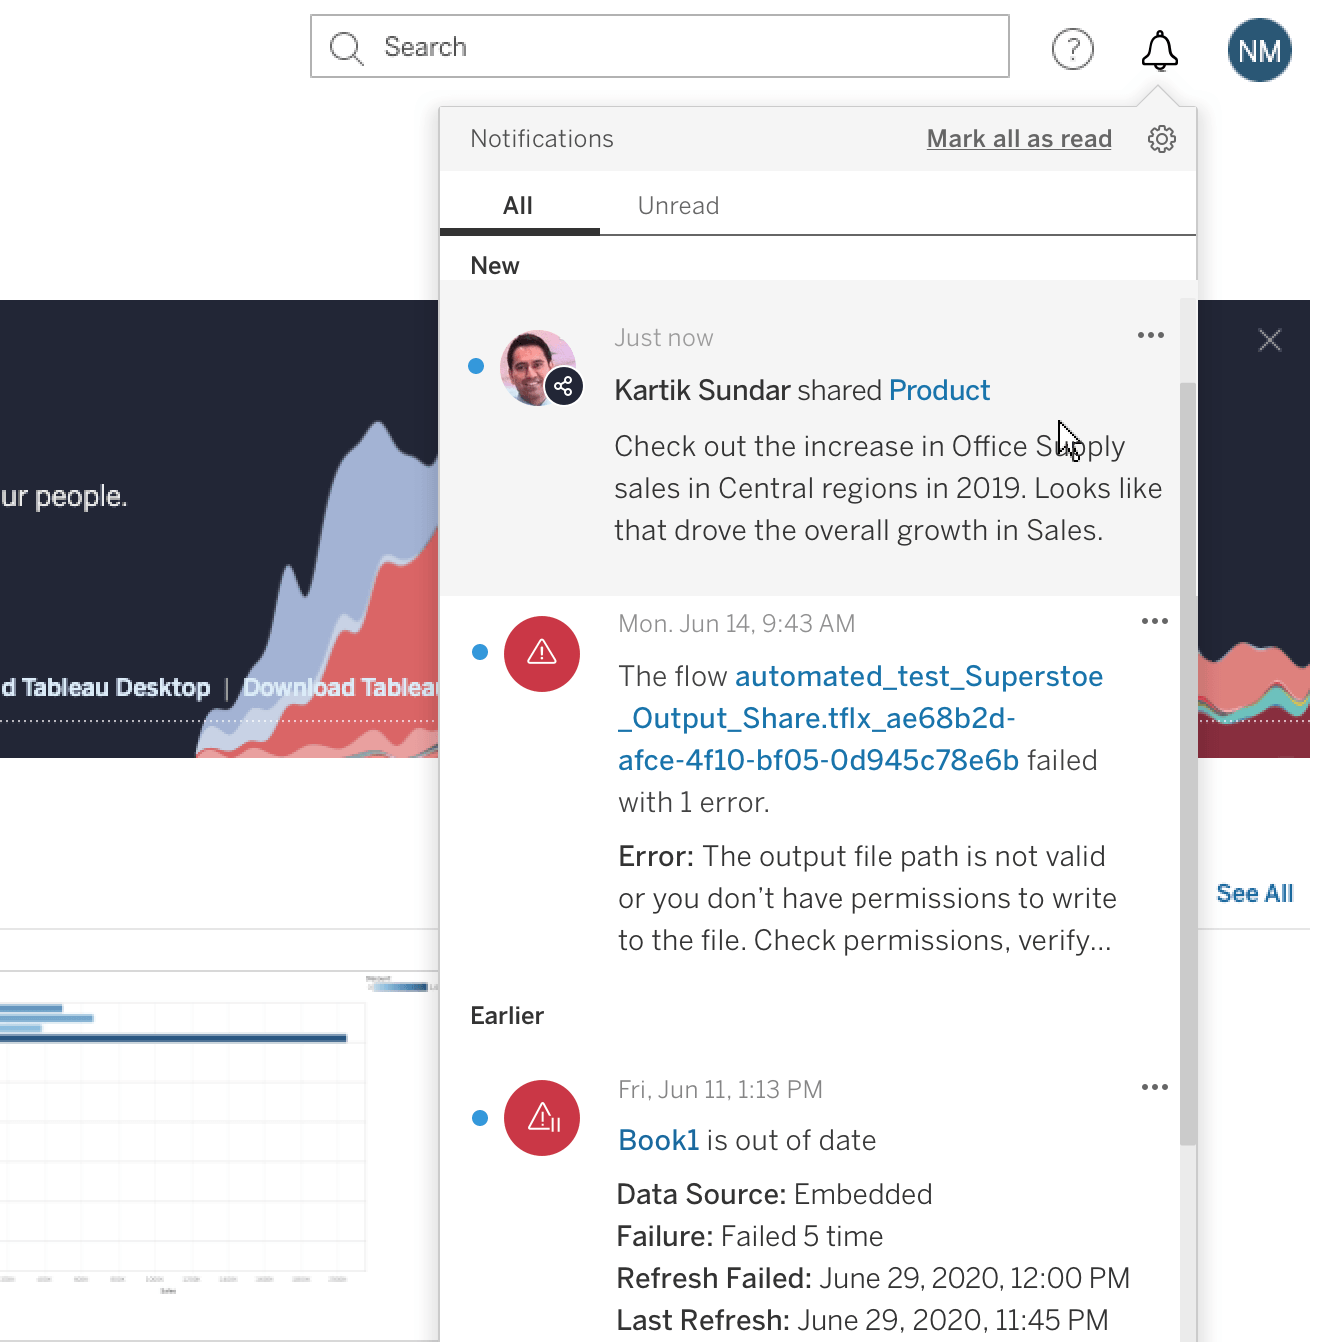
Tableau Notifications in Slack
With Tableau for Slack, you can stay up to date on all of your data from anywhere. With our new product integrations, you can now get notified directly in Slack for data-driven alerts, when you are @mentioned in a comment, or when someone shares content with you in Tableau.
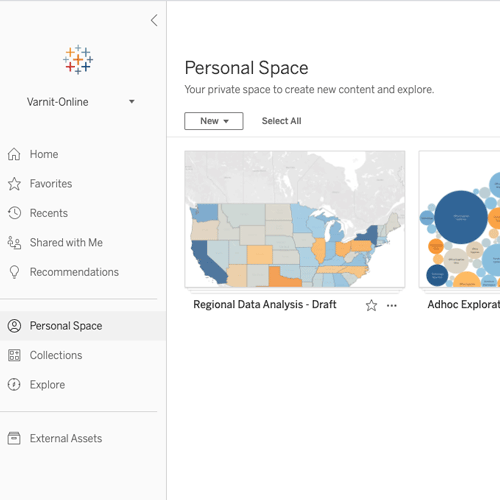
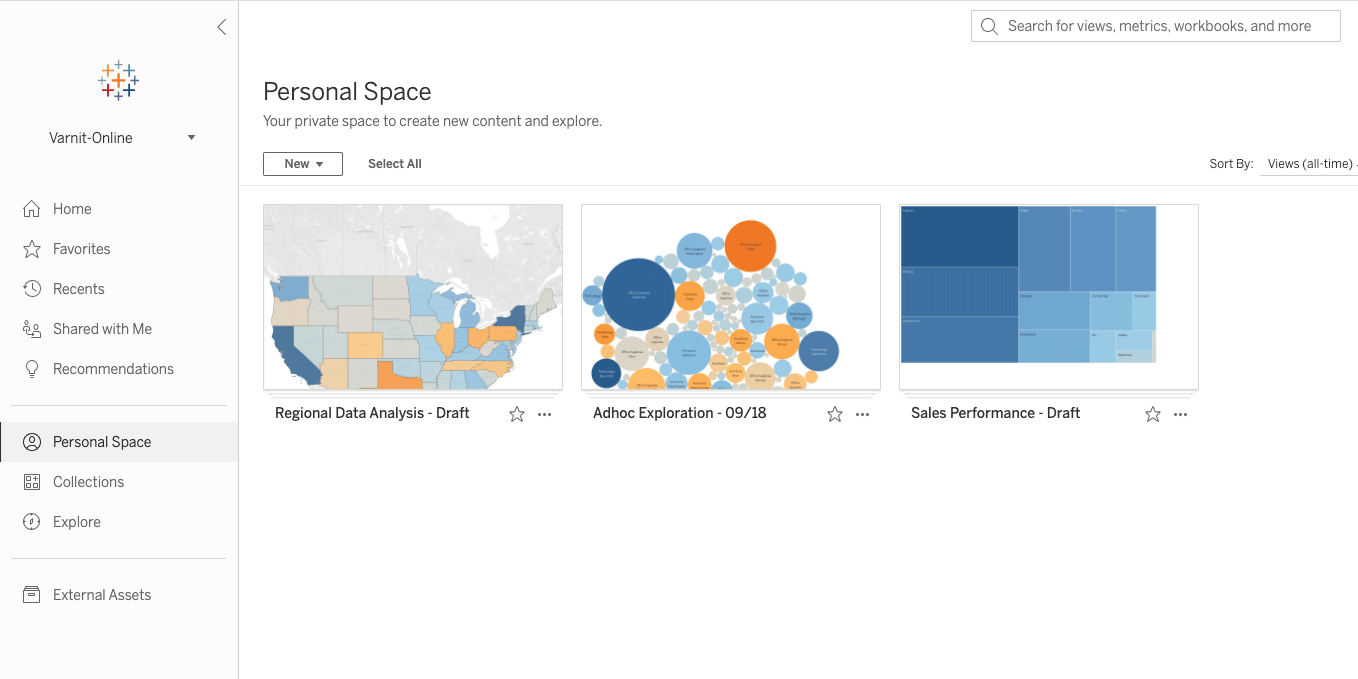
Personal Space
Personal Space is a new, private location on Tableau Server and Online where users can save content before it’s ready to be shared with others. Users can feel comfortable exploring data and staging workbooks in their own dedicated space, and admins no longer need to create private projects for every individual to achieve this on their site. Personal Space is available to any user with an Explorer or above license.
Tableau 2021.2
Tableau 2021.2 มาพร้อมกับประสิทธิภาพข้อมูลสำหรับทุกคนทั่วทั้งองค์กร เพื่อให้ทุกคนถามคำถามและรับคำตอบจากข้อมูลของพวกเขาได้ จุดเด่นรวมถึงประสบการณ์ใหม่สำหรับโปรแกรมสอบถามข้อมูลและอธิบายข้อมูล การเก็บรวบรวมข้อมูล และประสบการณ์ Tableau Desktop ที่เชื่อมต่อสำหรับการเขียนเว็บ
Ask Data for Viewers
We’ve broadened the reach of Ask Data by making it available to Viewers. Everyone with a Tableau license can now use Ask Data! We have a completely redefined natural language experience for business users, including seamless integration into dashboards with a new dashboard button. Additionally, a new content type, Ask Data Lenses, makes it easy to curate data with definition of column and value synonyms and suggested questions so you can better leverage existing published data sources.

Explain Data for Viewers
We’ve broadened the reach for Explain Data with a reimagined user interface optimized for deeper exploration and a wider business audience. Now available for Viewers, Explain Data makes it easier for anyone to explore and interact with data. When you select a mark and run Explain Data, Tableau proposes possible explanations for that mark based on statistical models. Explain Data gives you a jumping-off point to help you explore data more deeply and ask better questions.
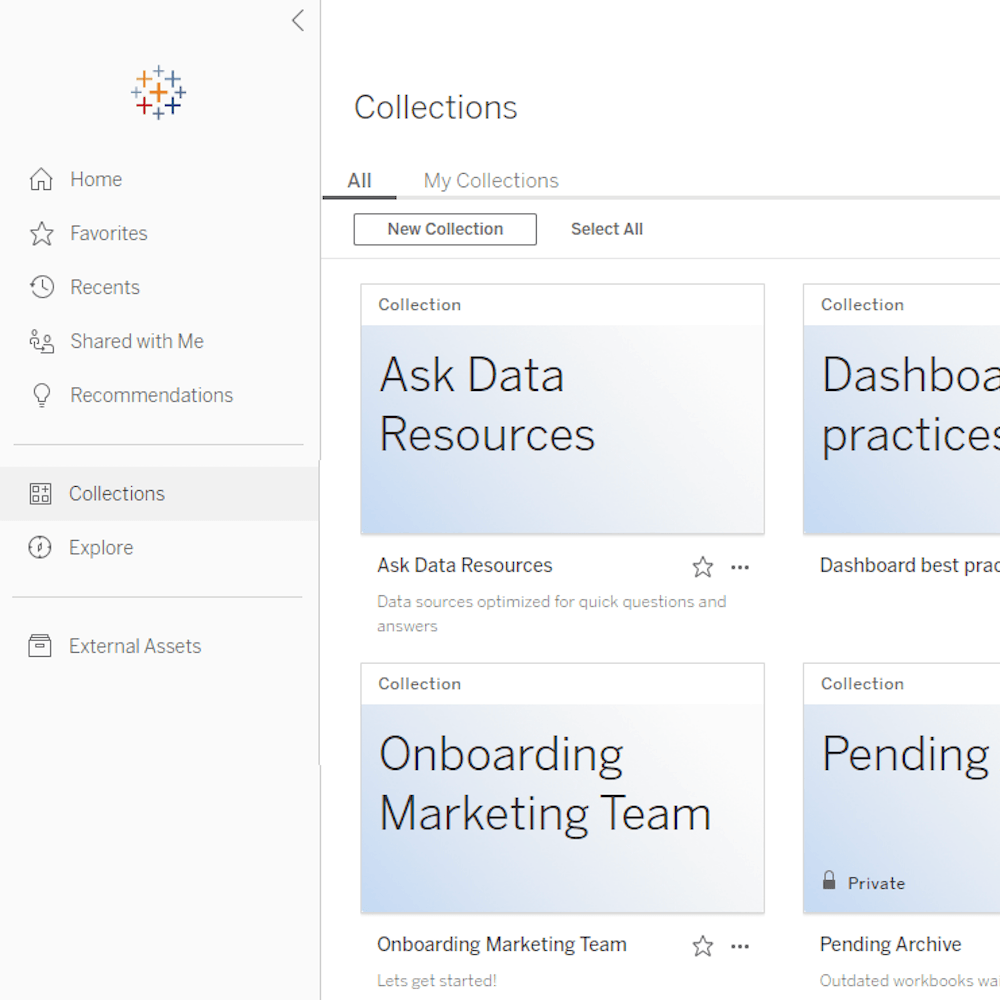
Collections
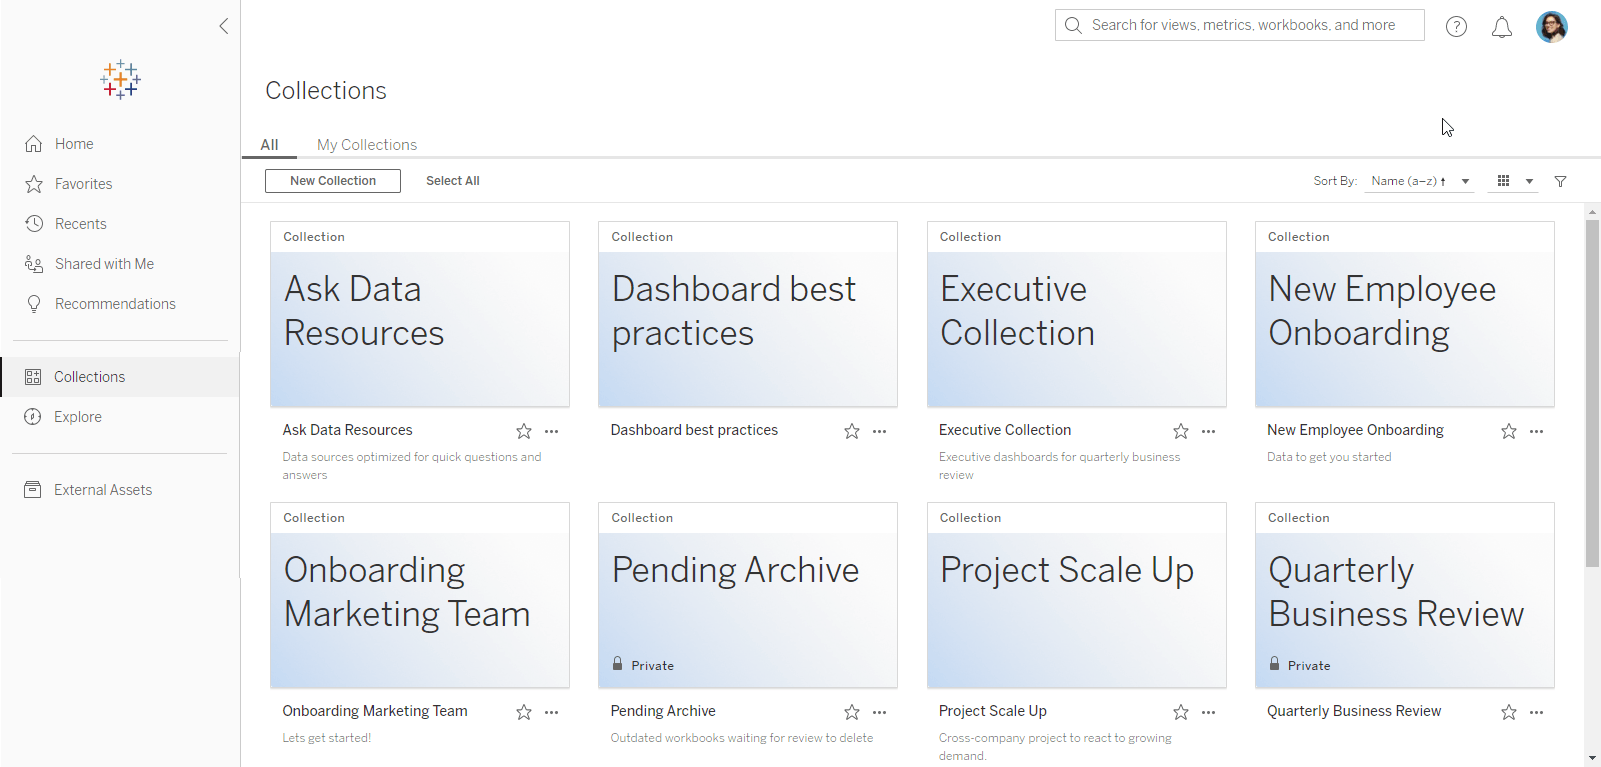
Finding the data you need for your analysis has never been easier. Collections are a new way to gather the content from across your site on Tableau Online or Server and organize it to fit how you use it. Collections can contain items that span different projects and workbooks, allowing you to reuse content in multiple contexts without additional storage or resources. And, it’s easy to organize and share content around key topics such as curated resources for new users for onboarding or a center of excellence collection that includes dashboards showcasing best practices.
Connected Desktop for web authoring
Enjoy a more cohesive and flexible web authoring experience. Creators can now transition seamlessly from web authoring to Tableau Desktop with a click of a button. Start your workflow in web authoring and choose to transition to Desktop at any point in your analysis—without having to download the workbook. When you’re finished, simply save to Tableau Online or Server so your content reflects the latest changes for others in your organization.
Jumpstart your Salesforce Connection
You can now log into your Tableau Online account using Salesforce login credentials, and a newly enabled Integrations Tab makes it simple to tap into and analyze your Sales Cloud and Service Cloud data—all via a ready-to-go workbook that keeps your data fresh.

Native Intelligence Connector
The Intelligence Connector is now available natively out of the box in Tableau Desktop, Prep, Server, and Online. The Intelligence Integration connects Tableau to Intelligence, creating an easy way for customers to consume harmonized Intelligence reports in Tableau.
Tableau 2021.1
Tableau 2021.1 นำการใช้งานที่น่าตื่นเต้นเพื่อช่วยบุคลากรของคุณทำการตัดสินใจทางธุรกิจได้เร็วขึ้นและฉลาดขึ้น จุดเด่นประกอบด้วย Einstein Discovery ใน Tableau, LODs ด่วน และประสบการณ์การแจ้งเตือนใหม่ที่เป็นหนึ่งเดียวกัน
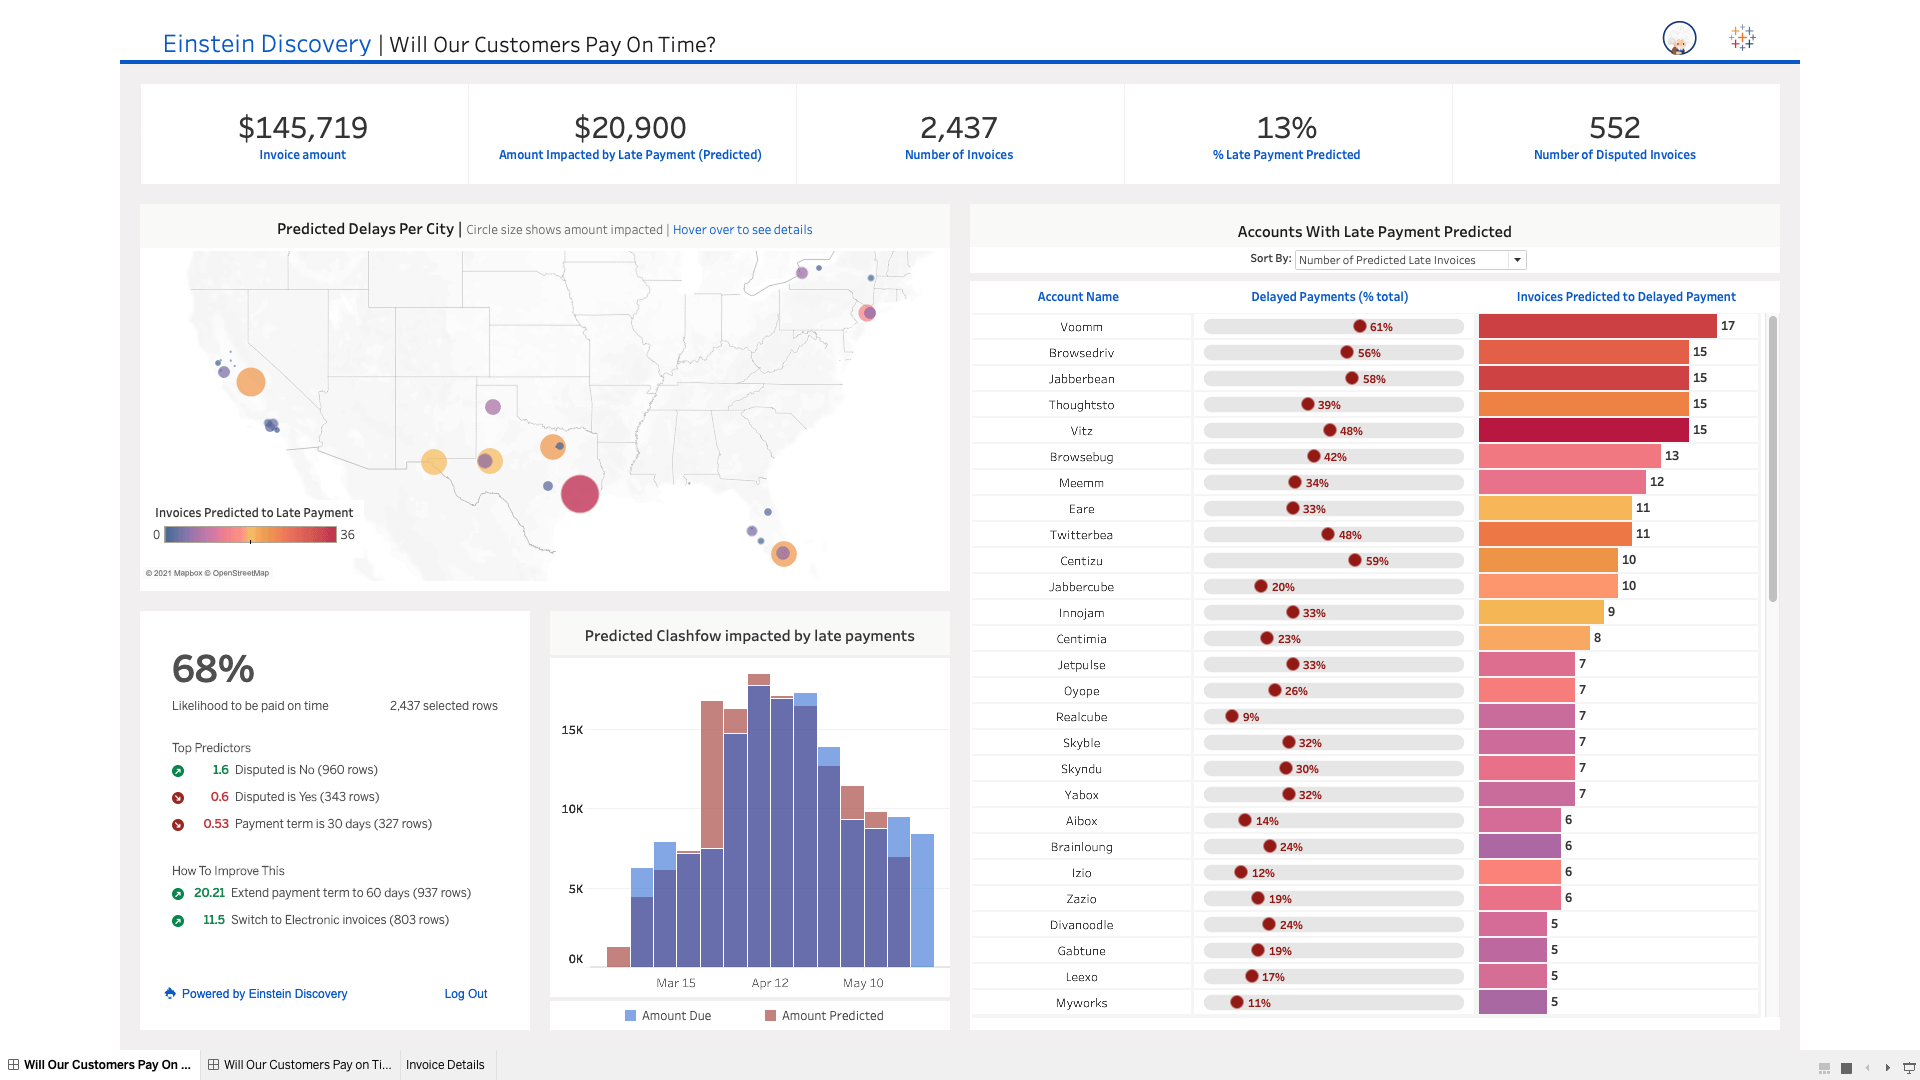
Einstein Discovery in Tableau
Einstein Discovery in Tableau brings trusted, intuitive predictions and recommendations from Einstein Discovery to every Tableau user across your organization. Get smarter, guided decisions for every team with cutting-edge, augmented analytics in a no-code required, rapid iteration environment.
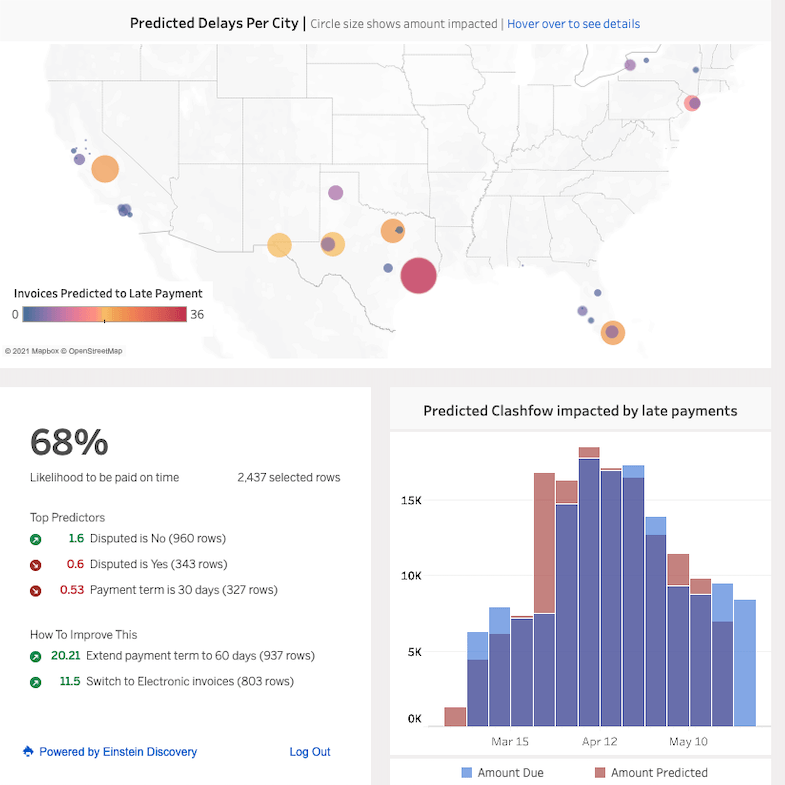
Einstein Discovery dashboard extension
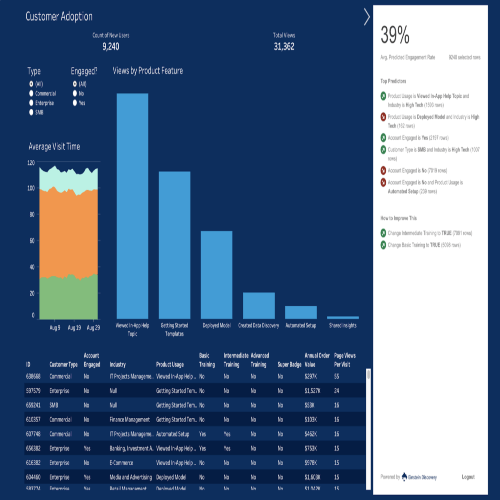
Enjoy on-demand, interpretable ML predictions from Einstein Discovery natively integrated in Tableau dashboards. Users can click on one or more rows of data from a Tableau visualization to get dynamic predictions, see key drivers of predictions, and learn ways to improve predictions based on the model.
Einstein in Tableau Calcs
Feed Tableau analytics with dynamic predictive intelligence and connect Einstein predictions directly into Tableau calculated fields. Construct, share, and scale interactive visualizations and dashboards incorporating dynamic predictions using existing Tableau infrastructure, and test new scenarios using Tableau parameters. Note: Available in Tableau Desktop and Tableau Server.
Quick LODs
Create Level of Detail expressions more easily. Use context menus or drag-and-drop a measure onto a dimension to automatically create a Level of Detail expression with the default aggregation.
Unified notification experience
Manage all of your notifications in the newly redesigned notification center within Tableau Server and Online. This dedicated space shows your shares, comments, extracts, and prep flows all in one place, consolidating all of the important changes across your organization. You can also control where you receive these notifications via preferences—directly in Tableau, email notifications, or both—helping you to never miss an important alert to take action.


Microsoft Azure connectivity improvements
You can now connect to your data in Azure SQL Database (with Azure Active Directory) and Azure Data Lake Gen 2. In addition, we now have support for Azure Active Directory in two of our existing connectors in Azure Synapse and Azure Databricks. For guidance and best practices around optimizing Tableau and Azure together for analytics, read our updated Tableau Server on Microsoft Azure Whitepaper.
Read our WhitepaperTableau 2020.4
Tableau 2020.4 มาพร้อมกับการปรับปรุงเชิงปฏิบัติเพื่อให้การวิเคราะห์ในองค์กรของคุณราบรื่นและปรับขนาดได้มากขึ้น จุดเด่นประกอบด้วย Tableau Prep Builder ในเบราวเซอร์ การปรับปรุงเกี่ยวกับพื้นที่ และ Resource Monitoring Tool สำหรับ Tableau Server บน Linux
Tableau Prep Builder in the browser
Tableau Prep Builder in the browser allows you to prep your data from wherever you have access to a browser, bringing the data prep process into one integrated platform on the web. No need to manage individual desktops, IT admins can now upgrade the server to get everyone in the organization on the latest version.
Multiple marks layer support for maps
Enhance your geospatial analysis with multiple marks layer support for maps. You can now add unlimited marks layers from a single data source to your map visualizations, bringing multiple spatial layers and context together for better understanding and analysis.

Redshift spatial support
We’re expanding Tableau’s spatial database connections to make solving location-based questions easier than ever. You can now connect directly to tables in Redshift that contain spatial data, and instantly visualize that data in Tableau.
Spatial support in Tableau Prep
Tableau Prep Builder can now import, recognize, and export spatial data to extracts and published data sources, bringing spatial context into the data preparation flow for better analysis.
Offline map support for Tableau Server
We’re making it easier to access and analyze spatial data on Tableau Server with offline map support. You can now create maps using the offline map style in web authoring, ensuring that maps remain accessible to all users—especially in organizations with strict internet access requirements.
Resource Monitoring Tool for Tableau Server on Linux
Previously available for Windows only, Resource Monitoring Tool now provides agent-based monitoring of your Tableau Server on Linux deployment as part of Advanced Management for Tableau Server. Proactively monitor and troubleshoot server health with improved visibility into hardware and software performance.
Tableau 2020.3
Tableau 2020.3 มาพร้อมกับฟังก์ชันการใช้งานที่มีประสิทธิภาพเพื่อช่วยปรับขนาดการวิเคราะห์ของคุณ ทำให้มีข้อมูลที่น่าเชื่อถือมากขึ้นสำหรับทุกคน จุดเด่นประกอบด้วยการเขียนไปที่ฐานข้อมูลภายนอกใน Tableau Prep รับใบอนุญาตในการเข้าสู่ระบบ และการรวมเข้ากับ SAP ที่ละเอียดมากขึ้น
Tableau Mobile for Workspace One (iOS)
Tableau Mobile for Workspace ONE is an update to the existing app that provides a quick and secure way to view, analyze and leverage the data in your organization. The new app, compatible with iOS13, includes a newer design that is faster and more intuitive, an improved search and browsing experience consistent with Tableau Server and Tableau Online, as well as enhanced offline capabilities that are quick to load and offer richness and interactivity for visualizations.
Support for Google BigQuery NUMERIC types
Take advantage of using Google BigQuery's NUMERIC data type without having to use CustomSQL, instead convert your NUMERIC type to DOUBLE.
Dashboard extension images
When you generate a .png or .pdf of a dashboard that you are viewing in Tableau Desktop, it will now render the Extension zone's image.
Relationship improvements
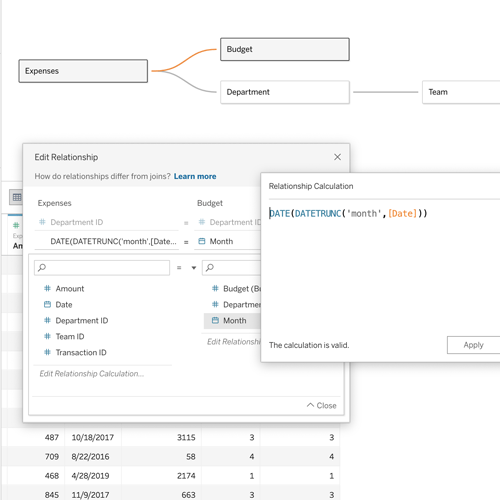
Create relationships between tables in your data source with more flexibility. You can now relate tables based on custom calculated fields, like concatenated fields or date truncation, and inequality operators. Additionally, we've improved the drag-and-drop experience in the data model.
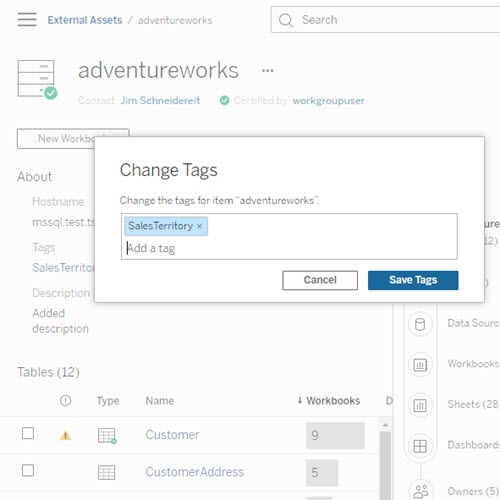
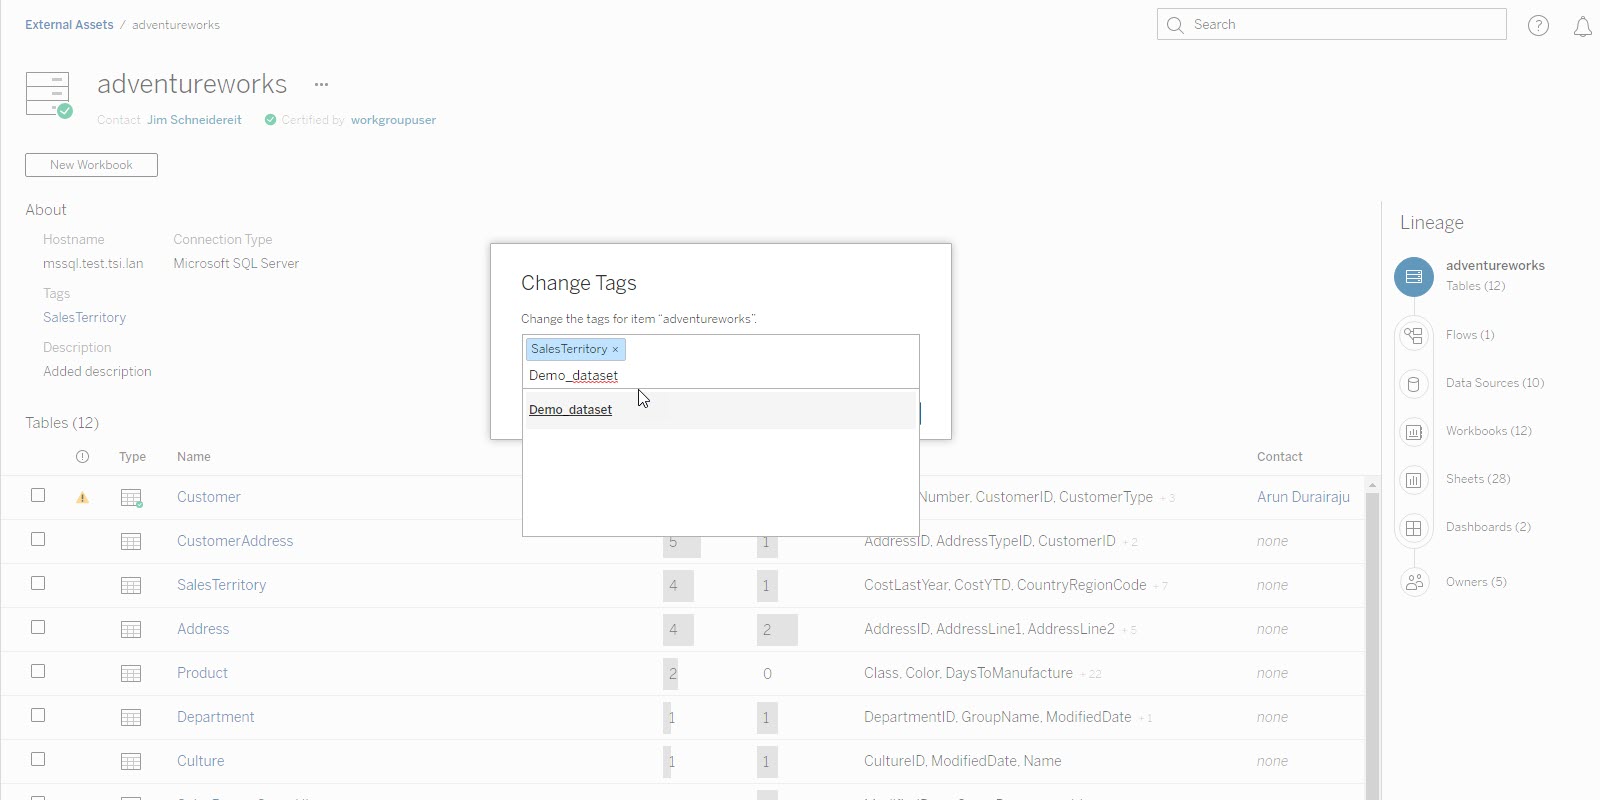
Tag External Assets in Tableau Catalog
Make it even easier to find the right data by tagging external assets, including databases, tables, and columns.
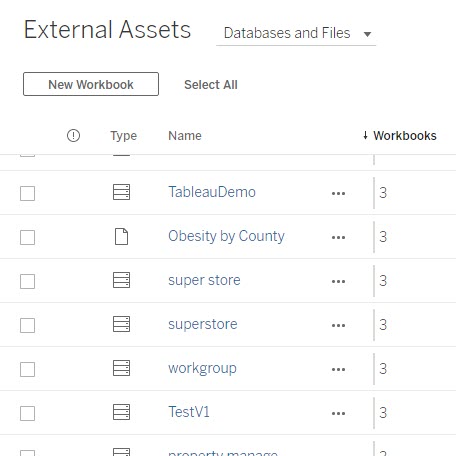
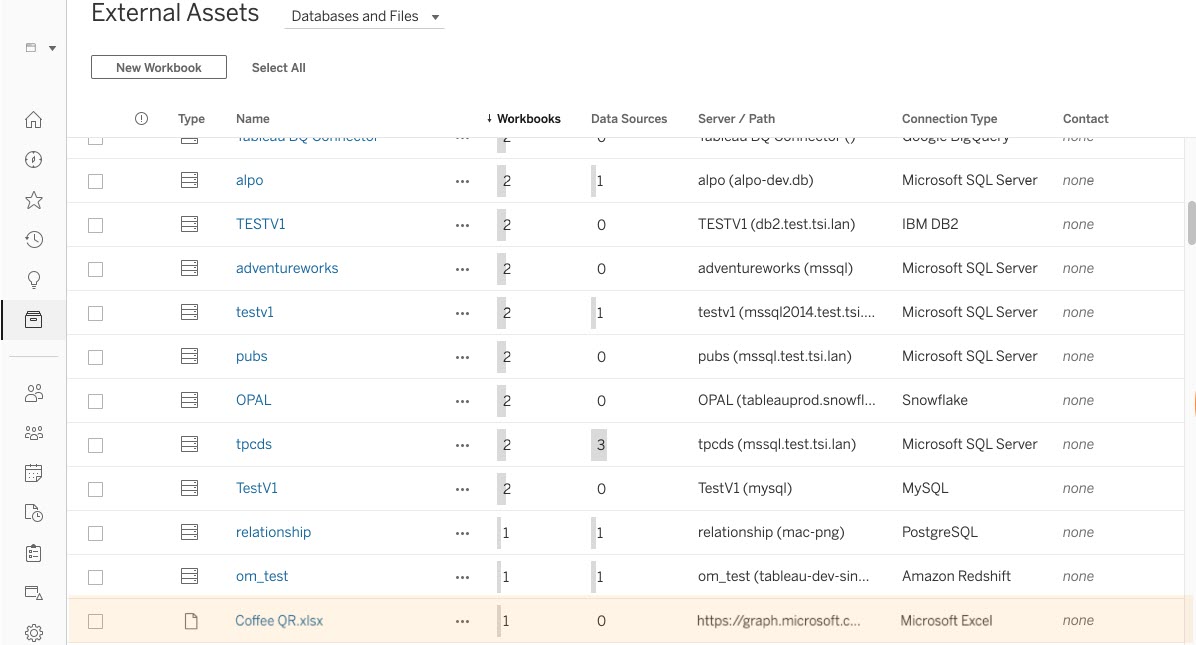
Include embedded files in External Assets list
See every asset in your environment via External Assets, including files and tables that are embedded in workbooks. This provides a holistic view of what data users are leveraging outside of published data or content.
Tableau 2020.2
Tableau 2020.2 มาพร้อมกับการปรับปรุงที่สำคัญเพื่อช่วยเหลือองค์กรผ่านทางเส้นทางการวิเคราะห์ จุดเด่นรวมถึงเมตริก การควบคุมการตั้งค่า และการปรับปรุงโมเดลข้อมูลของ Tableau ที่มีความสัมพันธ์เพื่อช่วยยกระดับความสัมพันธ์กับข้อมูลของคุณ
View recommendations on Tableau Mobile
View recommendations are now on Tableau Mobile. Get personalized suggestions that instantly connect you to relevant vizzes on the go. Powered by machine learning, these recommendations leverage users' preferences and surface vizzes that others with similar viewing habits found interesting, and that are popular on your site. With the home tab, you can find recommendations in a dedicated channel on your Tableau Mobile App.
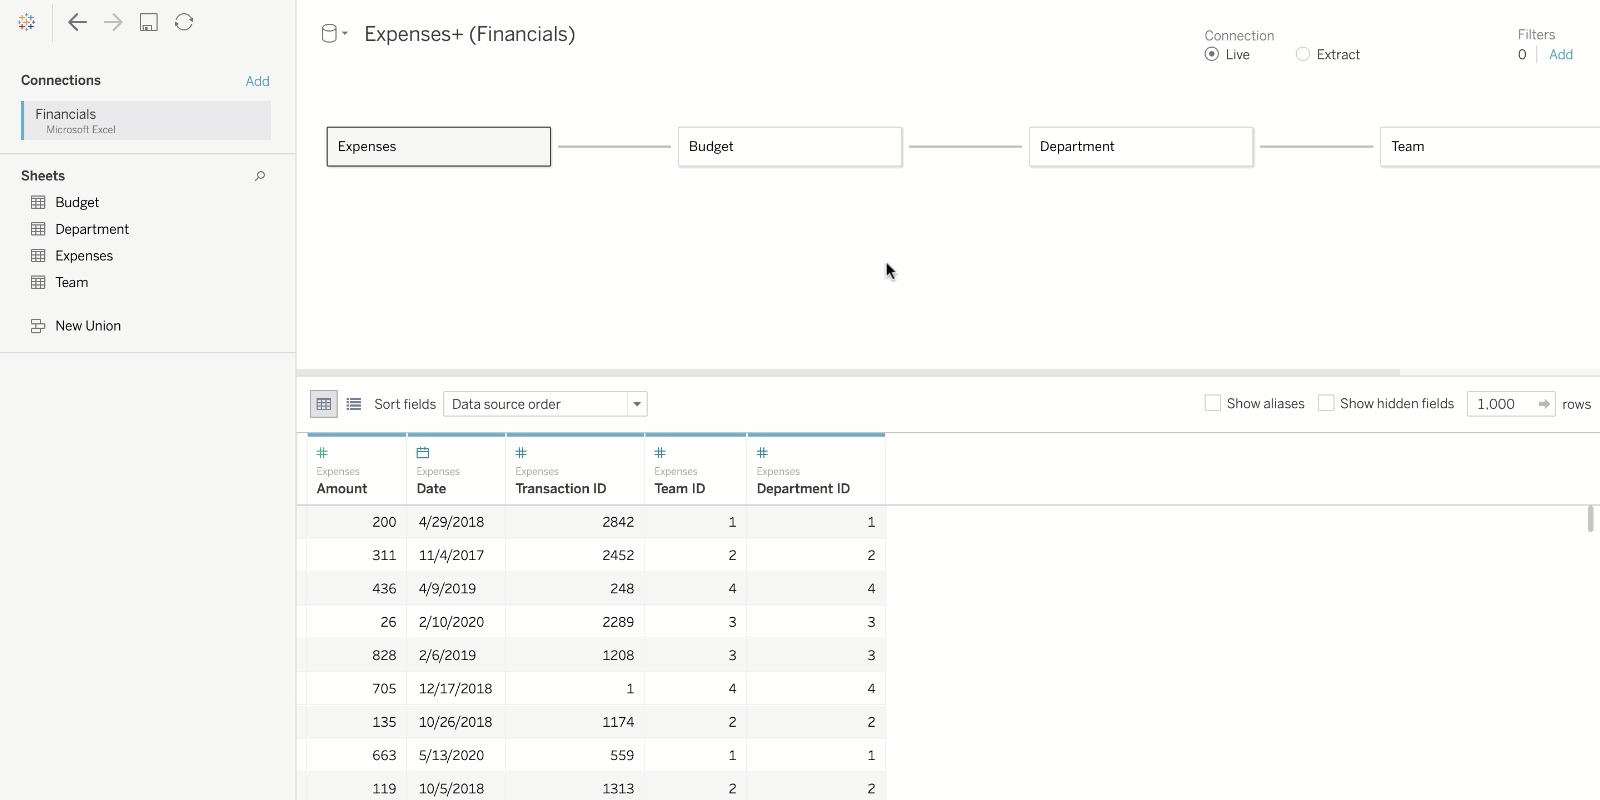
Relationships
Combining data just got easier and more powerful. By visually creating logical relationships between tables, Tableau will only query the data relevant to your analysis at the right level of detail. Analyze complex data faster and with more confidence.
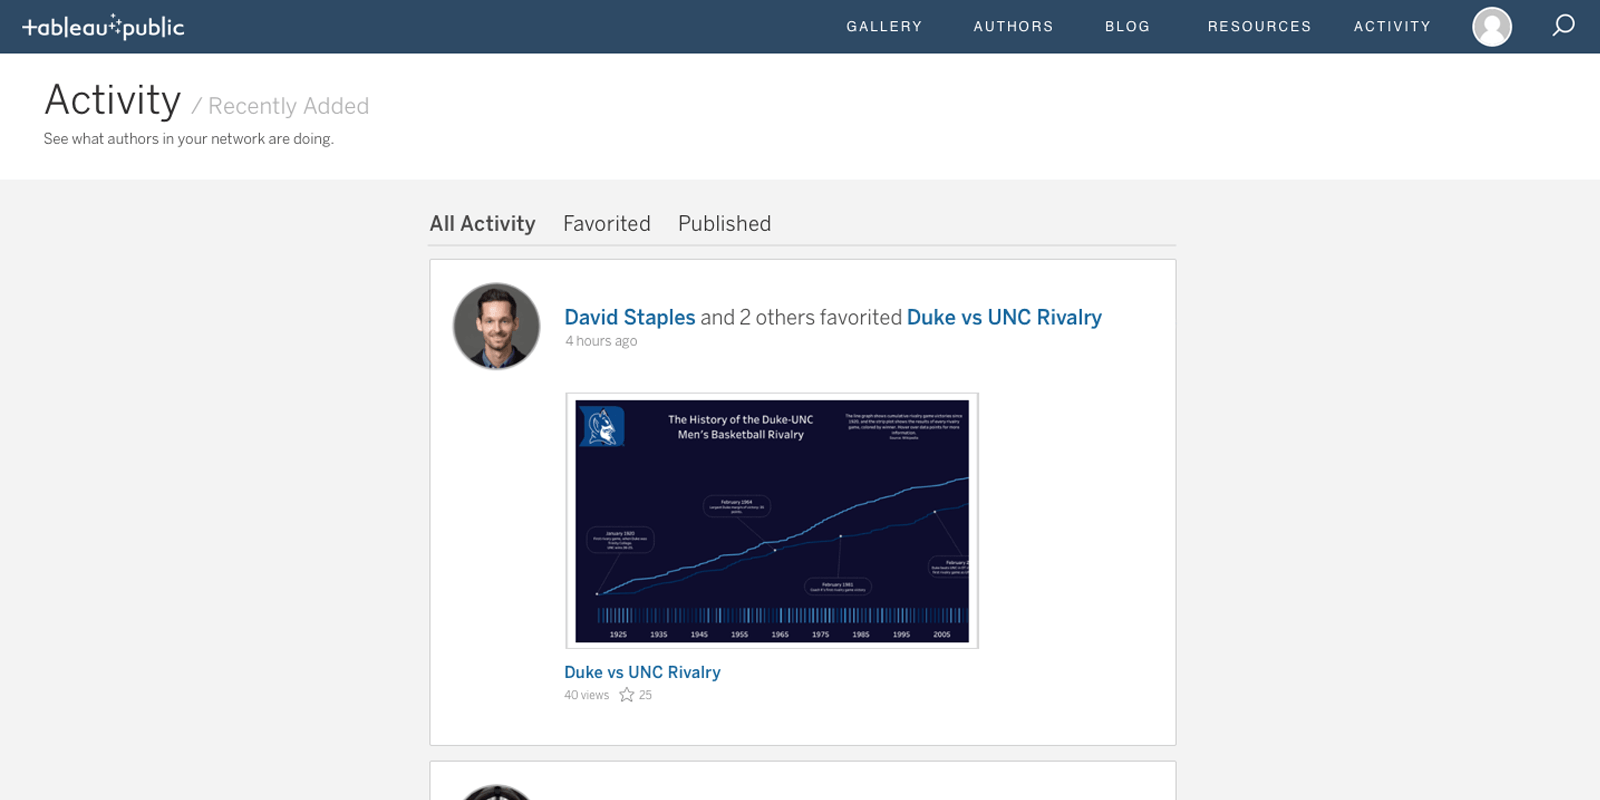
Activity feed improvements
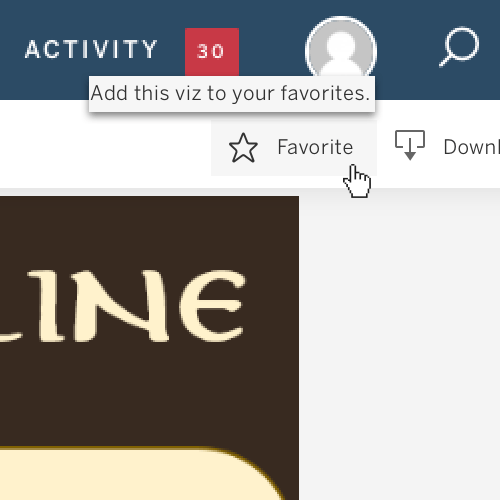
See a viz in your activity feed you like? You can now add vizzes to your favorites directly from your Tableau Public activity feed.
Set actions improvements
Set actions just got even more powerful with two new selection modes. You can now incrementally add and remove values from a set by interacting with marks in the view, even after a selection is cleared.
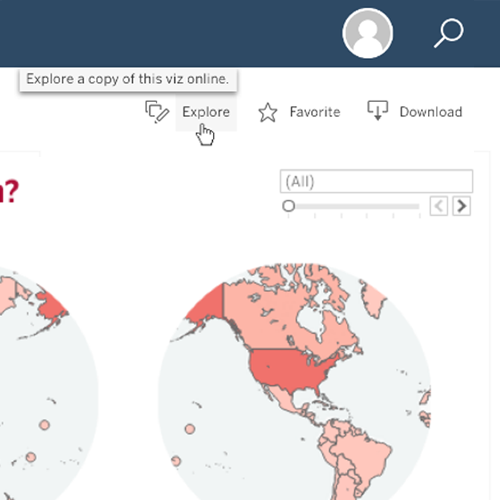
Explore a viz in the browser
Want to see how a viz on Tableau Public was made? You can now explore a viz directly in a browser. Explore, make your own version, and save as a copy to your profile with automatic attribution to the original author.
SAP HANA connector improvements
We have improved our OData Connector which now supports S/4HANA. Additionally, users can now connect to an OData service URL to list all the feeds inside their service and can join those feeds together just as they would any other tables in a Tableau datasource.
Tableau 2020.1
Tableau 2020.1 มีวิธีที่น่าตื่นเต้นในการเพิ่มปฏิสัมพันธ์ที่มีประสิทธิภาพไปยังข้อมูลของคุณ นำฟีเจอร์ที่มีการร้องขอมากที่สุดในชุมชน Tableau ให้เกิดขึ้นในชีวิตจริง เพลิดเพลินกับพารามิเตอร์แบบไดนามิก การคำนวณบัฟเฟอร์ และแอนิเมชันการแสดงภาพ เพื่อบอกเล่าเรื่องราวเบื้องหลังข้อมูลของคุณด้วยภาพเคลื่อนไหวที่มีพลังยิ่งกว่าที่เคย
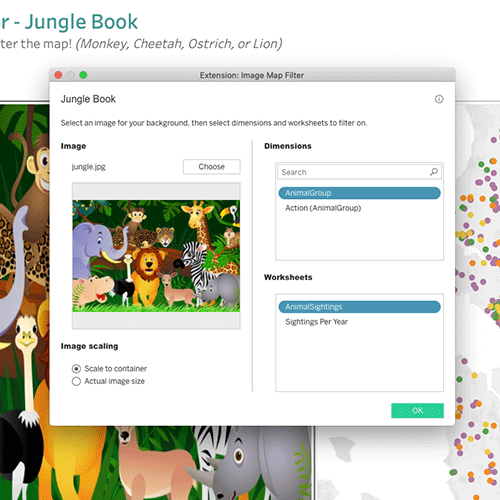
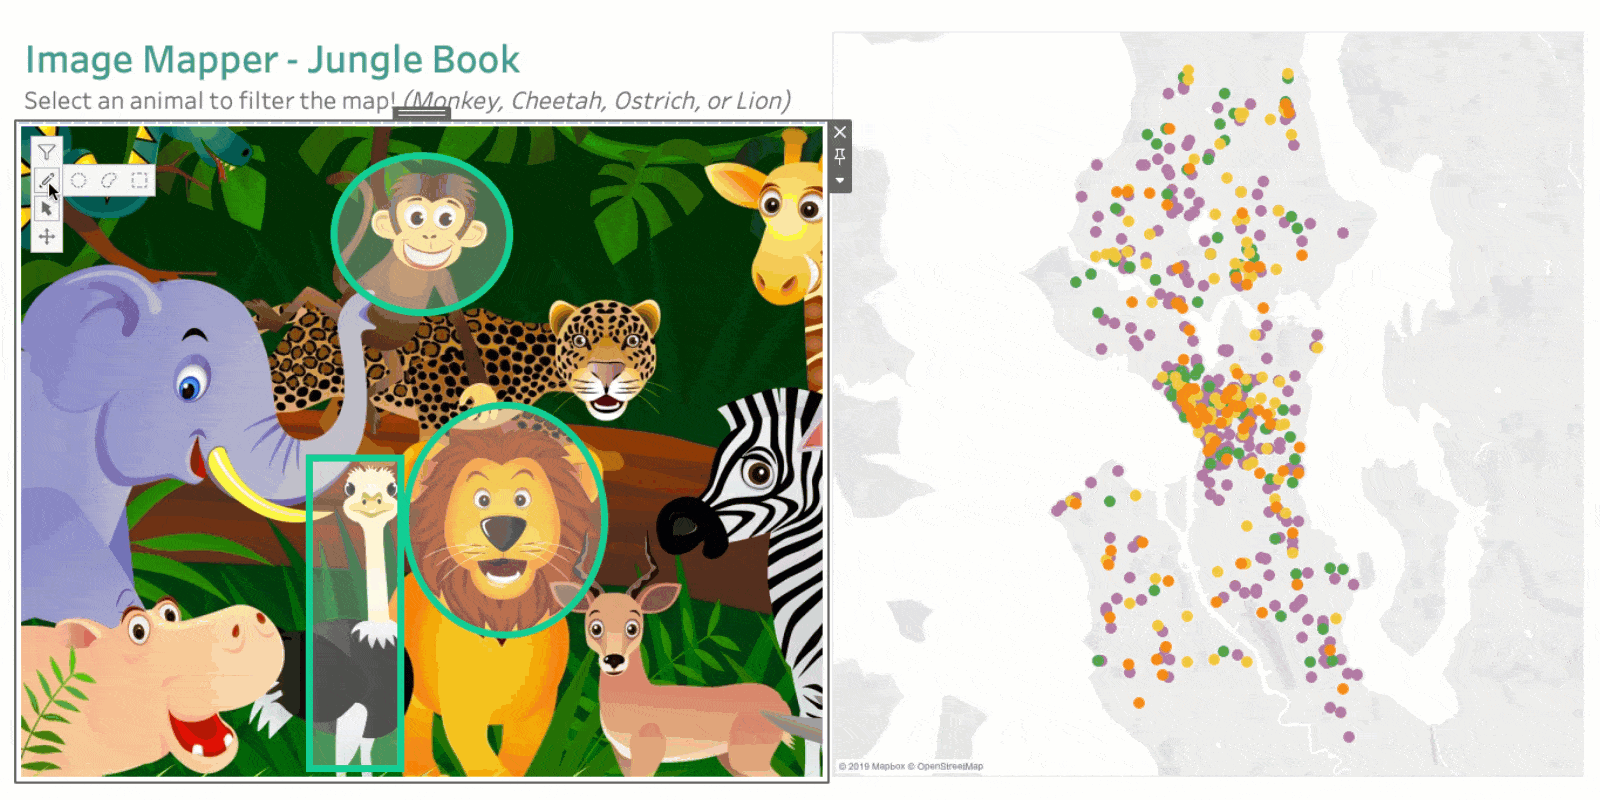
Dashboard Extensions for Tableau Public
With extensions, you can create more customized visualizations. We are now supporting the Image Map Filter, Single Checkbox Parameters, and Filter Bookmarks extensions on Tableau Public. These extensions are available for download in our Tableau Exchange.
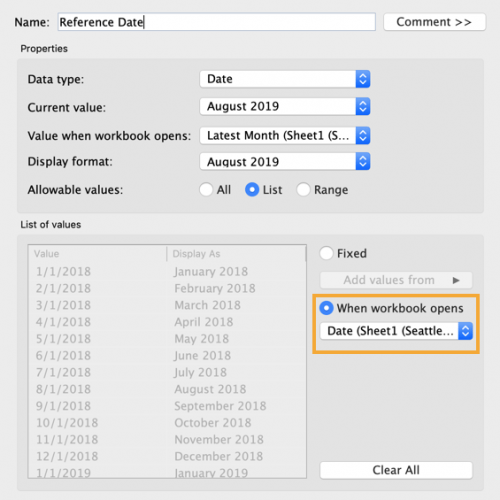
Dynamic parameters
Say goodbye to republishing workbooks with parameters every time the underlying data changes. Set your parameter once, and Tableau will automatically update the parameter’s list of values every time someone opens the workbook.
Customizable Discover Pane for Tableau Desktop
You can now customize the Discover Pane that appears on the start page in Tableau Desktop to show your own custom content instead of the content Tableau shows by default. Provide links and information specific to your organization to make it easier for your users to get started using Tableau quickly. Learn more about it here.
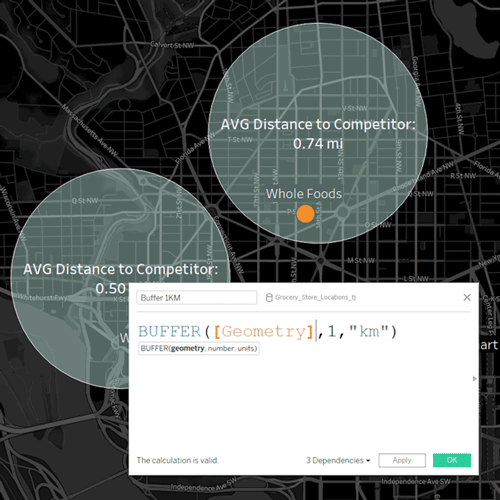
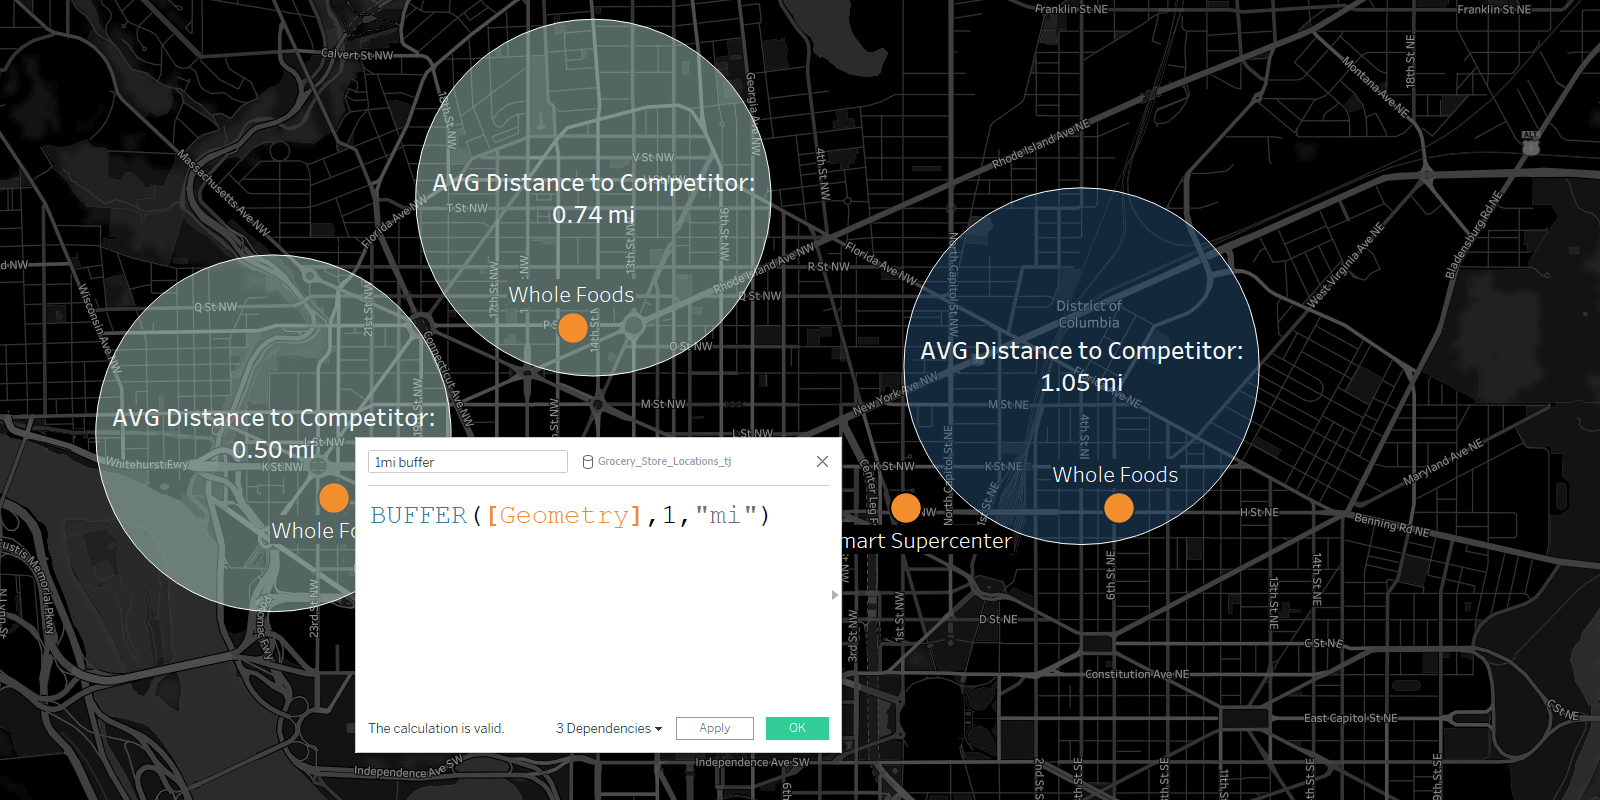
Buffer by distance calculations
Buffer calculations allow you to visualize the distance around point locations. Give Tableau three parameters—location, distance, and a unit of measure—and a buffer, or boundary is instantly created. Answering complex spatial questions becomes easier than ever before—visualize what properties are within 200 meters of a proposed transit site, or how many competitors’ stores are within 1 mile of their store, and more.
Play button in the browser
For workbooks using pages, press play directly in the browser to see how a given measure affects the rest of your data. Combine with Viz Animations for smooth, coherent transitions showing changes between states or over time.
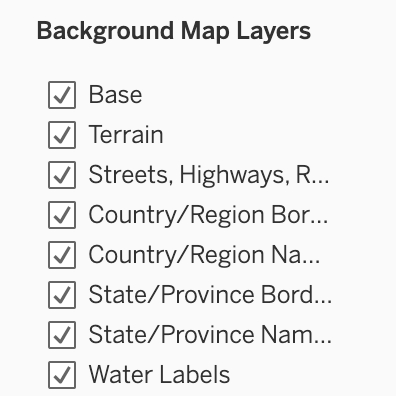
Map improvements in the browser
Control more aspects of your map in the browser. Change background map styles, repeat backgrounds, map layers, and demographic data layers. In addition, the style picker dropdown makes it easier to find and distinguish between map styles.
Tableau 2019.4
รุ่น 2019.4 มาพร้อมฟังก์ชันการใช้งานที่ทำให้ลูกค้าค้นหา เชื่อมต่อ และวิเคราะห์ข้อมูลของพวกเขาได้ง่ายขึ้น จุดเด่นฟีเจอร์ในรุ่นการเปิดตัวนี้รวมถึงการปรับปรุงตารางที่สำคัญ การแนะนำมุมมองสำหรับ Tableau Server และ Online และรองรับ Webhook เพื่อช่วยผสานรวมและขยายแพลตฟอร์ม Tableau เพิ่มมากขึ้น


Alibaba Connectors
Now, through a partnership with Alibaba, Tableau customers will be able to natively connect and analyze data in MaxCompute, AnalyticDB, or Data Lake Analytics.
Read more about this partnership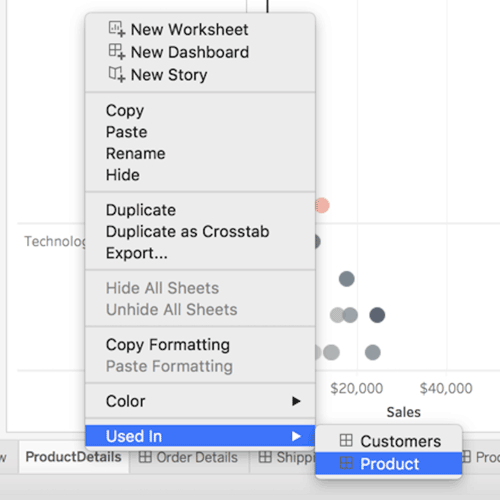
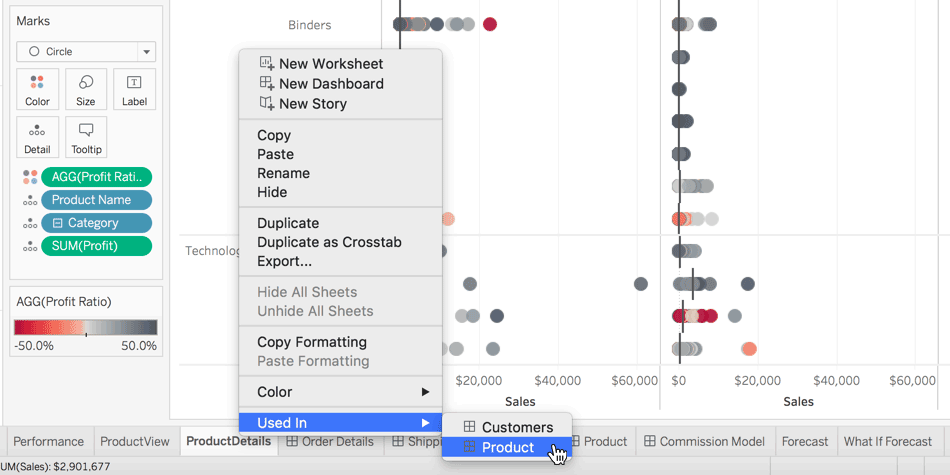
Go to where a sheet is used
We’re making it faster to navigate larger, complex workbooks that contain multiple sheets. Easily view and jump to all locations in a workbook (dashboards, stories) where a worksheet is used.
Activity feed improvements
Filter your personalized Tableau Public activity feed by toggling between activity type. Favorites are now grouped together for the same viz.
SAP HANA connector improvements
Now when you connect to SAP HANA, leveled hierarchies utilized in calculation views will automatically be available in Tableau.

Kyvos Connector
For customers using Kyvos, you can now natively connect and start analyzing your data. Available for Tableau Desktop and Tableau Server.

For customers using Presto, you can now take full advantage of the innovation of Qubole as a native connector. Available for Tableau Desktop and Tableau Server.
Tableau 2019.3
รุ่น 2019.3 มาพร้อมความสามารถใหม่ที่ช่วยคุณและองค์กรของคุณทำงานกับข้อมูลของคุณได้มากขึ้น เข้าใจ “เหตุผล” ที่อยู่เบื้องหลังค่าผิดปกติด้วยโปรแกรมอธิบายข้อมูล สร้างความน่าเชื่อถือให้ข้อมูลของคุณด้วย Tableau Catalog และปฏิบัติการในขนาดที่มากขึ้นด้วยข้อเสนอ Tableau Server Management Add-on ใหม่ นอกจากนี้ยังเพลิดเพลินกับการปรับปรุงอย่างเช่น การเข้ารหัสอย่างปลอดภัย ความสามารถในการฝังโปรแกรมสอบถามข้อมูล และความสามารถในการเชื่อมต่อไปยังแหล่งข้อมูลที่เผยแพร่ใน Prep Builder
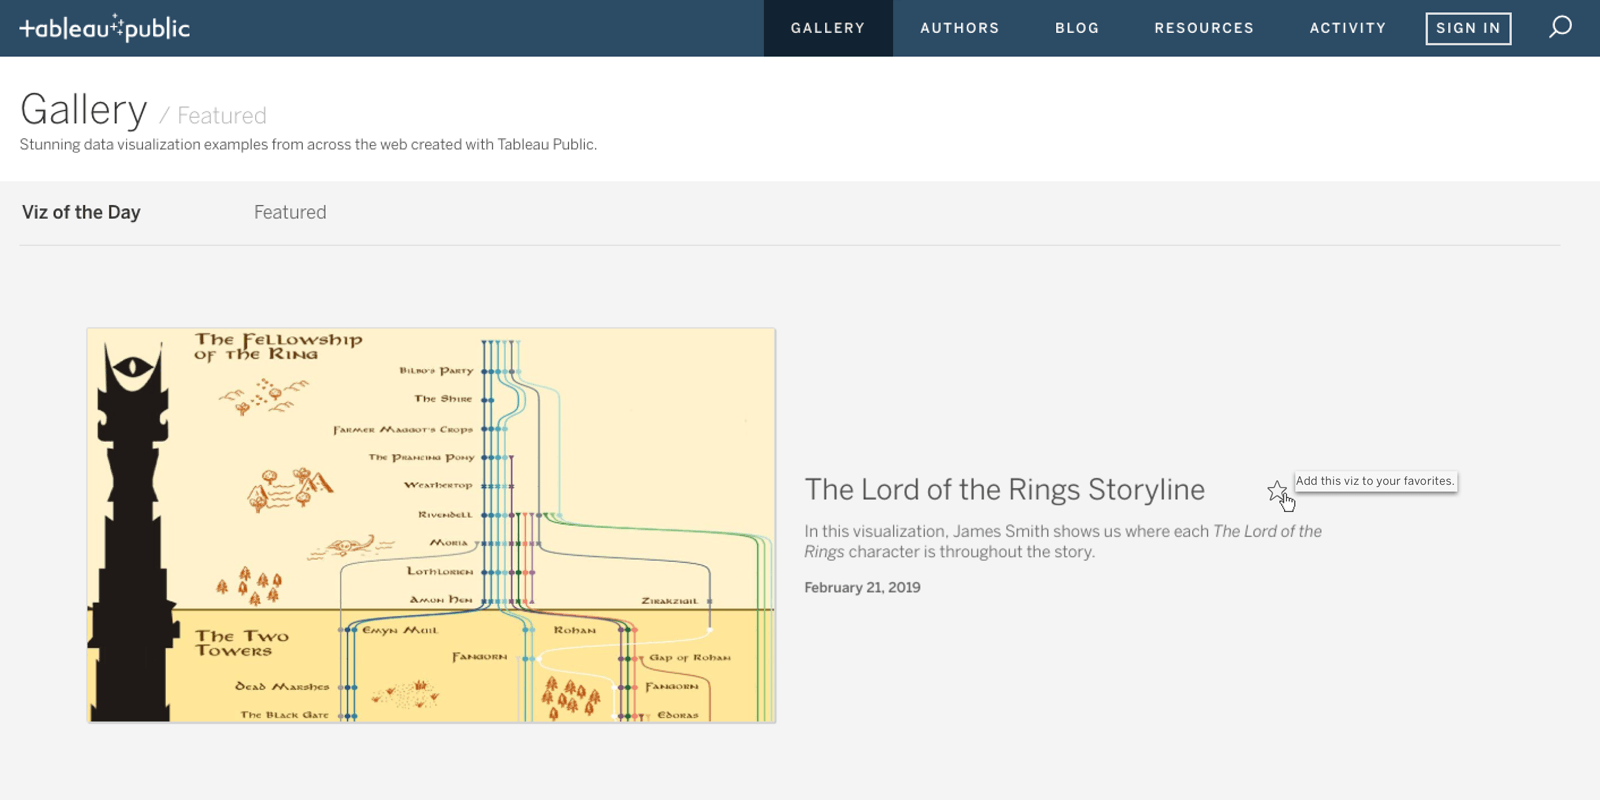
Favorite from gallery
You now have the ability to save vizzes from the Tableau Public gallery to your personal collection of favorites, making them easily accessible when searching for inspiration.
Web editing
Edit and save any of your Tableau Public vizzes directly in your browser. Any changes will be automatically updated in all embedded locations.
Spatial calculations: Distance
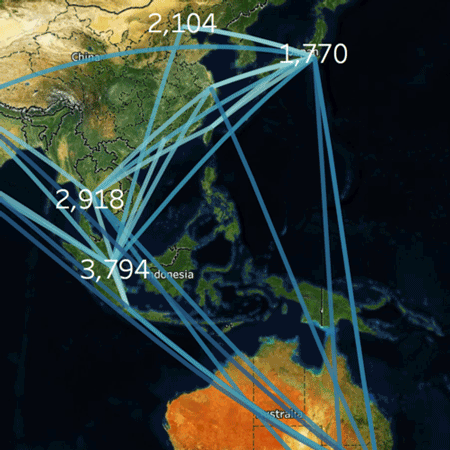
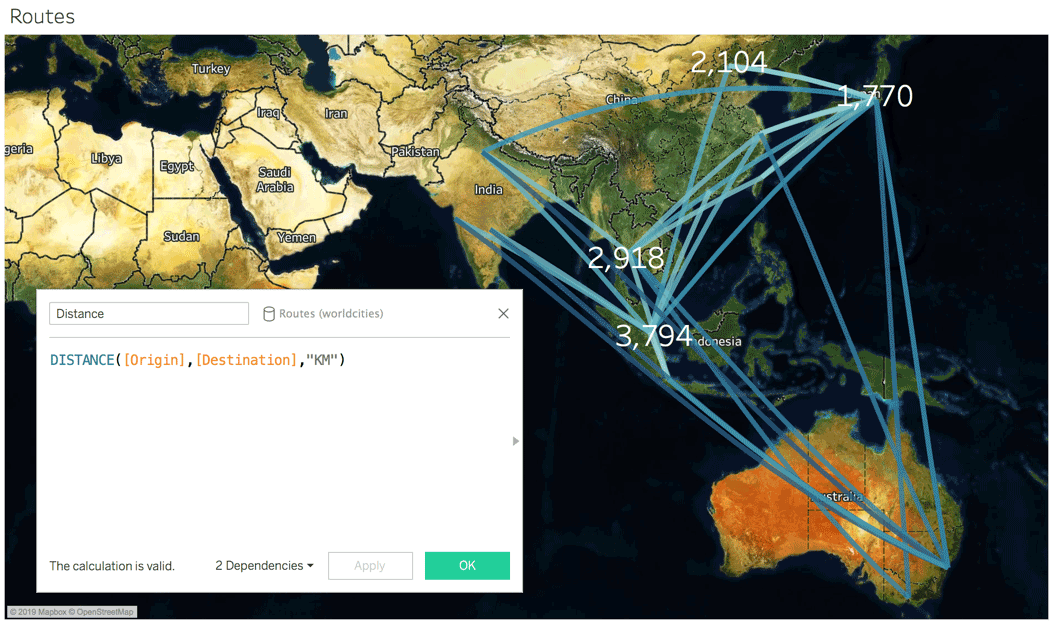
You can now easily measure the distance between two points, perfect for measuring the length of flight or shipping routes or driving proximity analysis around a store or hub.
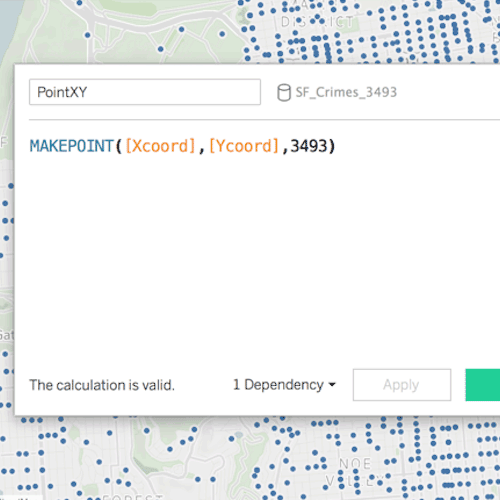
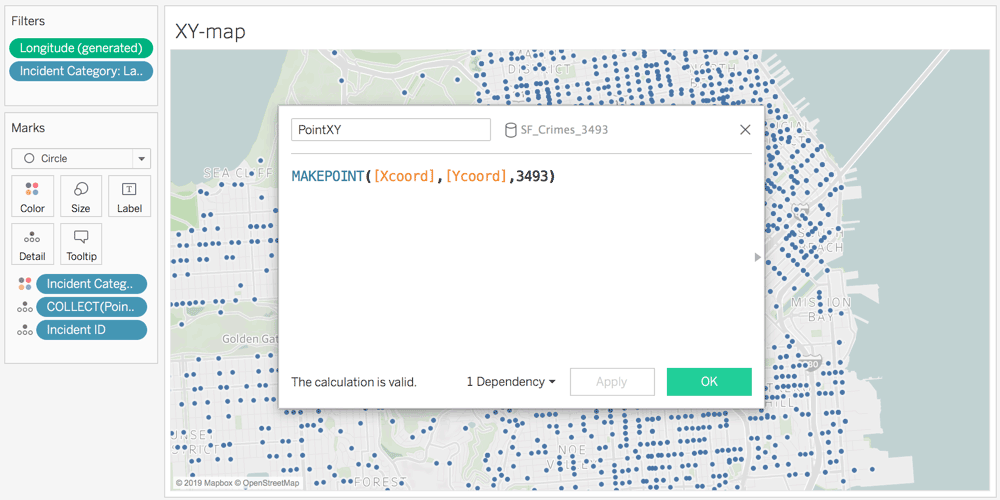
Spatial calculations: MakePoint improvements
You can now convert projected coordinates for locations, which might be in feet or meters, into latitudes and longitudes that Tableau can visualize and use in spatial joins. For instance, the Seattle Police Department logs location data using a local projection in US Feet, and can now use MakePoint to convert it directly into useable lat/long coordinates.
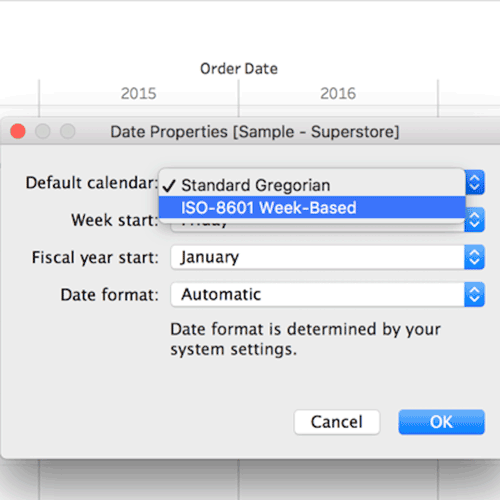
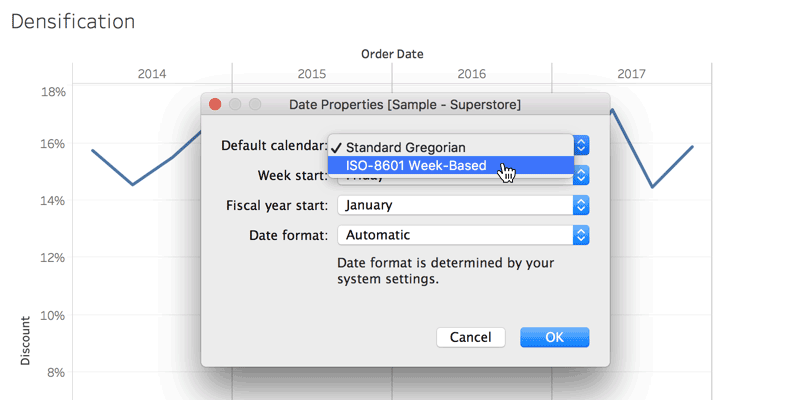
ISO-8601 calendar default
You can now set the ISO-8601 calendar so your date parts default to the iso-equivalent of year, quarter, week, and weekday for better calendar-based analysis.
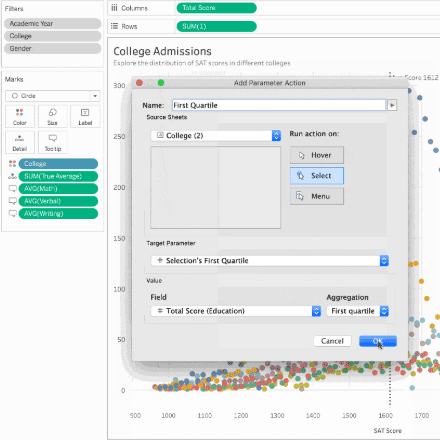
Parameter actions improvements
Parameter actions just got more powerful with three new aggregation functions: first quartile, third quartile, and concatenation. You also now have the option to create new parameters directly from the parameter action dialog.
Tableau 2019.2
รุ่น 2019.2 มีวิธีใหม่ๆ ที่น่าตื่นเต้นในการปฏิสัมพันธ์กับข้อมูลของคุณ และความสามารถของแดชบอร์ดใหม่ที่แตกต่างจากเดิมอย่างมากเพื่อประสบการณ์การเขียนที่แม่นยำและมีประสิทธิภาพมากขึ้น เพลิดเพลินกับการดำเนินการพารามิเตอร์ แผนที่เวกเตอร์ และวิธีใหม่ในการเรียกดูเนื้อหาของคุณบน Tableau Server และ Online
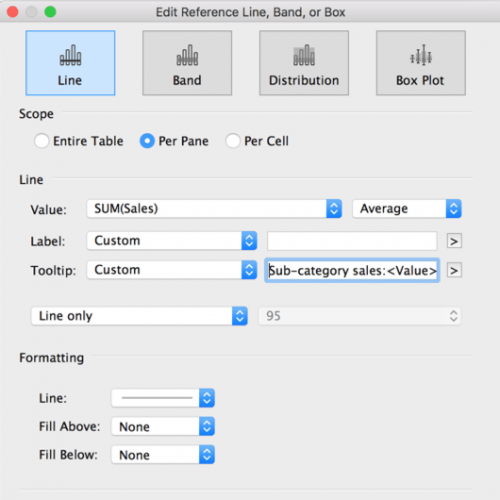
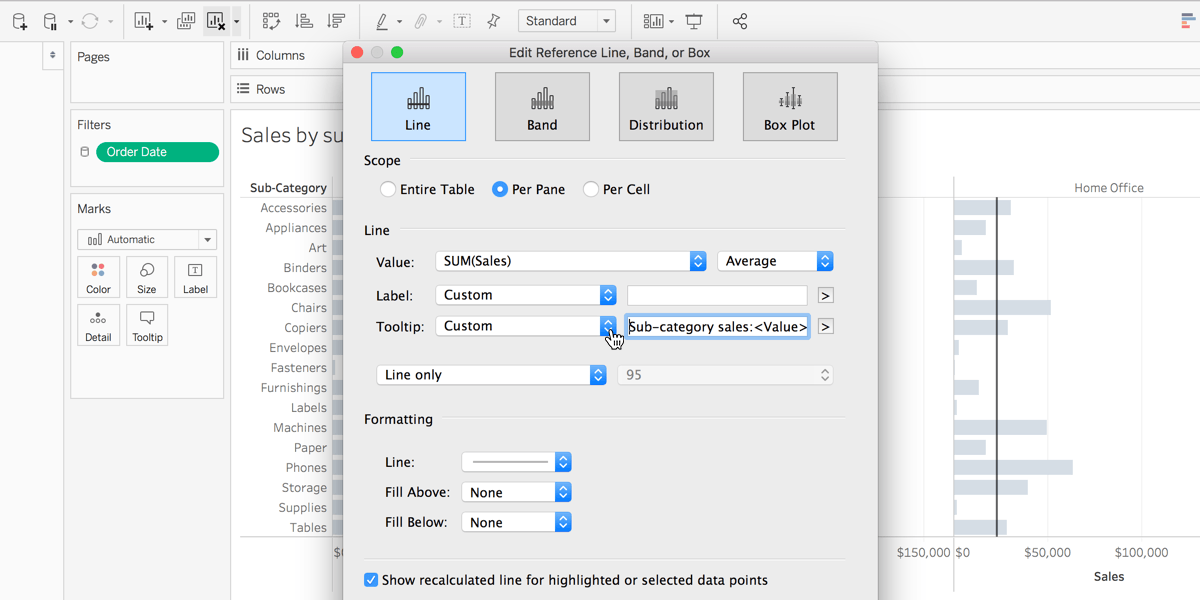
Customizable reference line tooltips
You now have the option to customize tooltips for reference lines, bands, and distributions. Edit the tooltip text, or choose to disable the tooltip altogether.
Spatial calculations: MakePoint
You can now turn latitude/longitude values from text files, excel, or any data source into spatial fields and use them in spatial joins. With MakePoint, you can spatially enable text files and excel spreadsheets, making it easer to spatially aggregate your data.
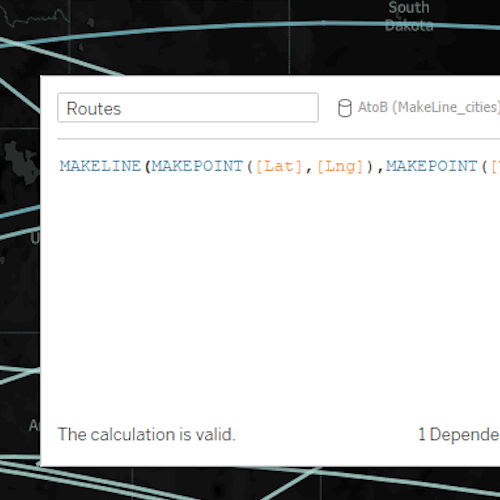
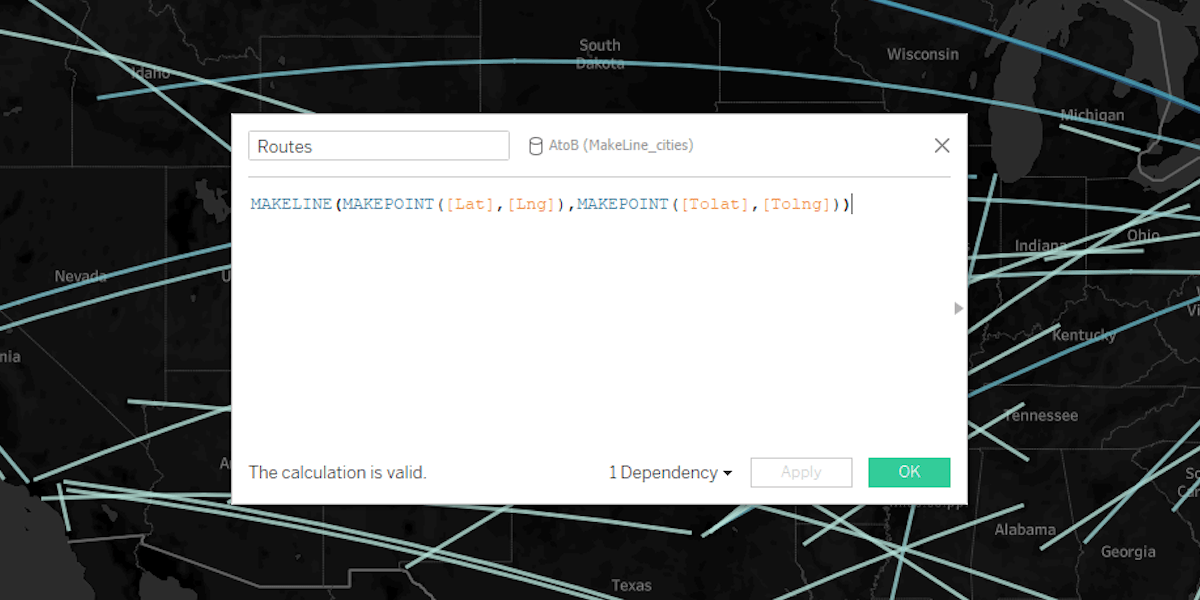
Spatial calculations: MakeLine
You can now easily create two-point origin-destination maps, perfect for making flight maps of airline routes.
Parameter actions
You now have the ability to visually change a parameter’s value. Use parameter actions to drive reference lines, calculations, filters, and SQL queries simply by interacting with marks on a viz, bringing visual interactivity to your data like never before.
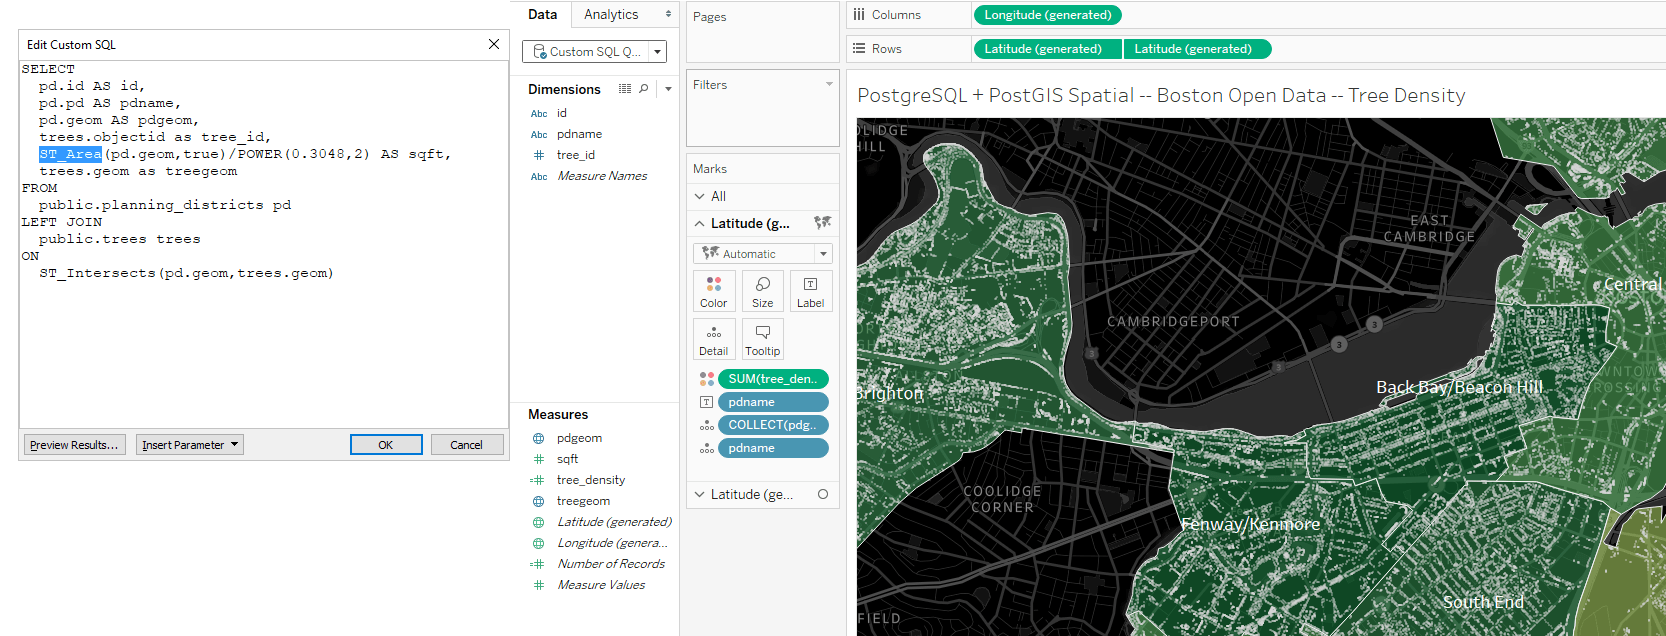
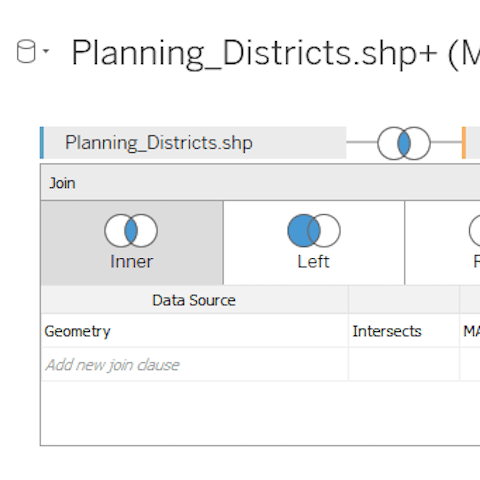
PostgreSQL+PostGIS Spatial support
You will now be able to use spatial data directly from a PostgreSQL or Pivotal Greenplum database with the PostGIS extension. No need to export or pre-process the data before diving into it in Tableau. And perform more advanced spatial analysis with the ability to now leverage the spatial operations supported by the database.
Show/hide dashboard containers
Maximize screen real estate with the flexibility to toggle between visible or hidden for any floating container on your dashboard. Streamline what content viewers see, such as customizing instructions, filters, or legends to be hidden when they are no longer useful.
Tableau 2019.1
รุ่น 2019.1 มีการเปิดตัวโปรแกรมสอบถามข้อมูล ซึ่งเป็นวิธีใหม่ในการปฏิสัมพันธ์กับข้อมูลของคุณใน Tableau รวมถึง Tableau Prep Conductor ซึ่งเป็น Add-on ใหม่ไปยัง Tableau Online และ Server ที่เพิ่มการจัดเตรียมข้อมูลในวงกว้างโดยทำให้ขั้นตอนและลำดับงานเป็นแบบอัตโนมัติ นอกจากนี้ยังจะได้ใช้งานมุมมองการแจ้งเตือนที่ขับเคลื่อนด้วยข้อมูล ชื่อโซนแดชบอร์ด และการปรับปรุงการดำเนินการ URL
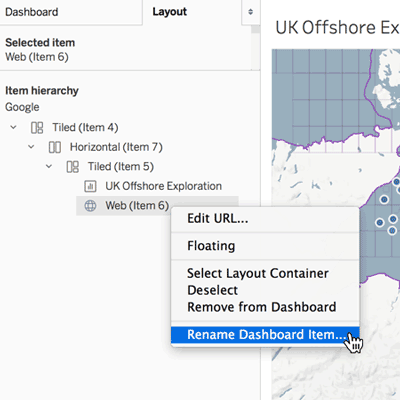
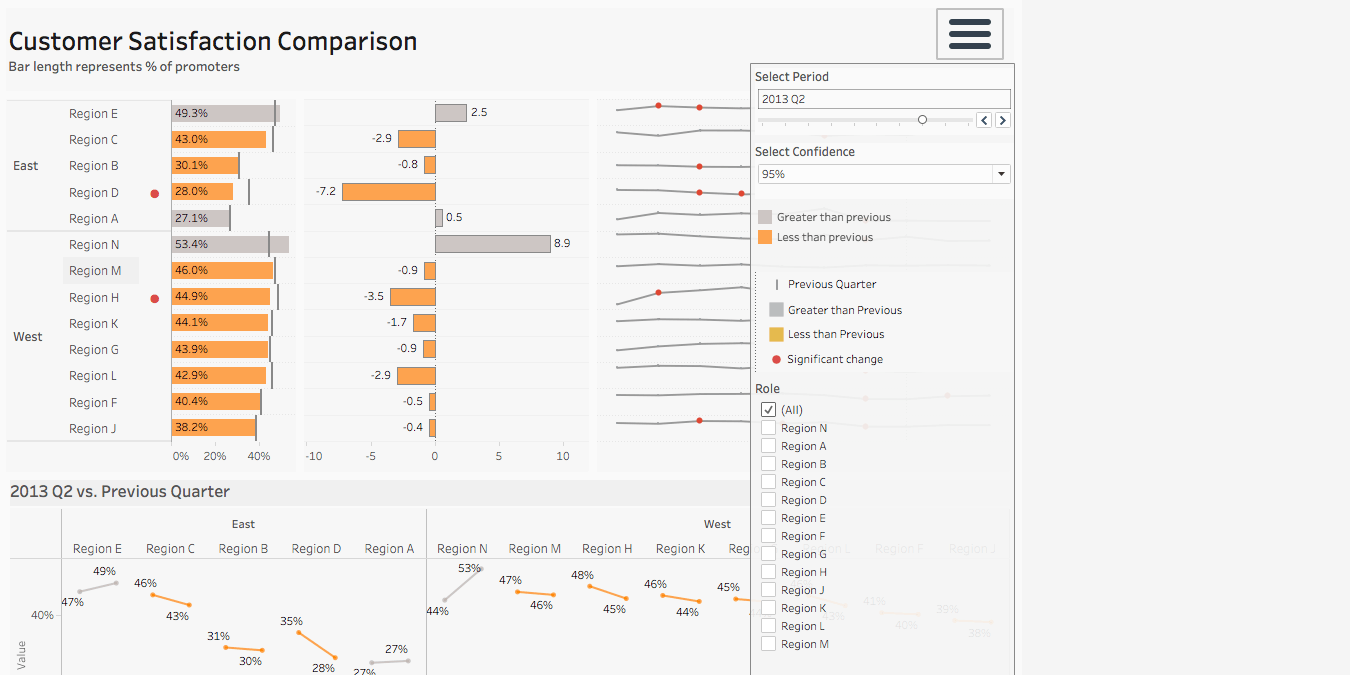
Dashboard zone names
You now have the ability to assign a name to any item on a dashboard, helping to better organize multiple zones when looking at the layout tree.
Nested sorting improvements
Sorting just got more intuitive. You can now sort within multiple dimensions, making it easy to spot trends in your categorical data.
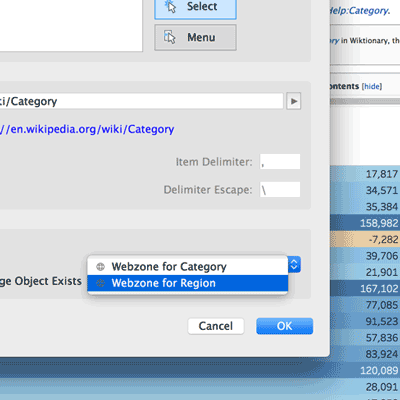
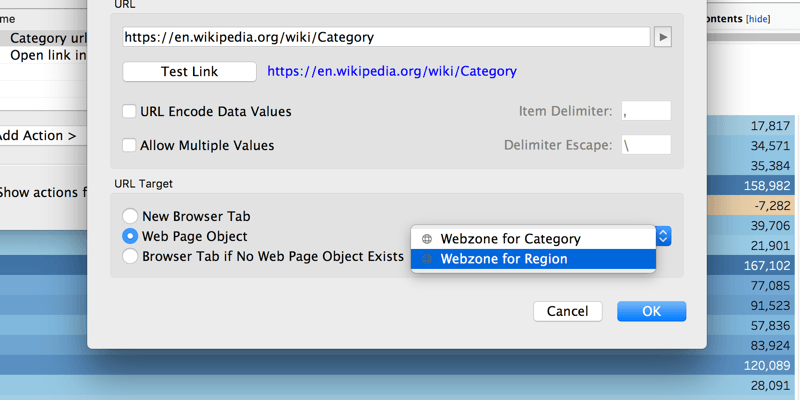
Url action improvements
Url actions can now target specific web zones in a dashboard, allowing authors the control to more seamlessly link to information that is hosted outside of their data source. Better integrate and add more meaningful content to your dashboard, and design more sophisticated app-like experiences.
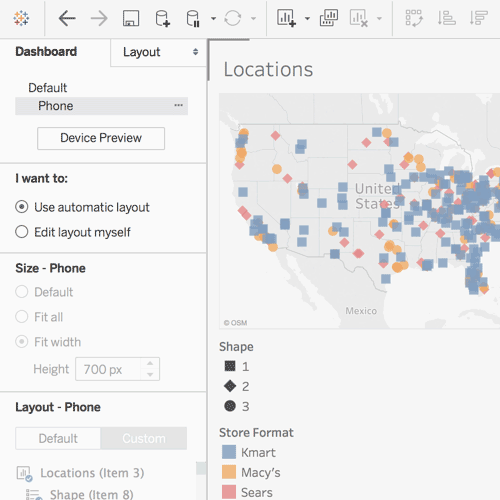
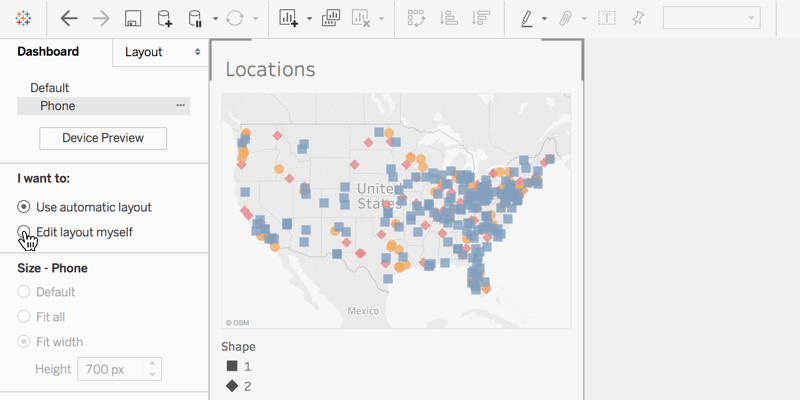
Automatic dashboard phone layouts
Authoring mobile dashboard layouts just got easier. Tableau will now automatically add phone layouts to new dashboards, with ability to further customize them for specific use cases.

OAuth enabled for Snowflake Connector
We’ve significantly improved the Snowflake connection experience. The Snowflake Connector is now available across our entire platform and we have added native OAuth integration for both security and convenience.
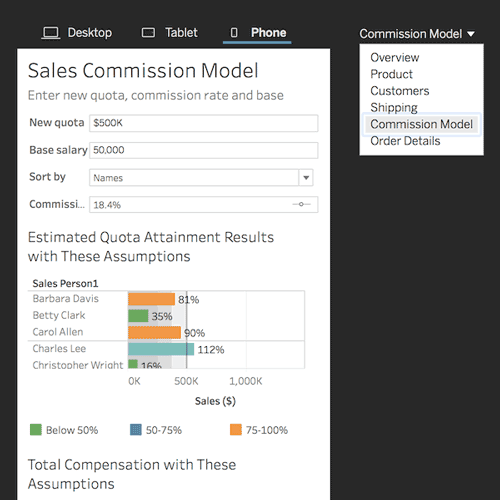
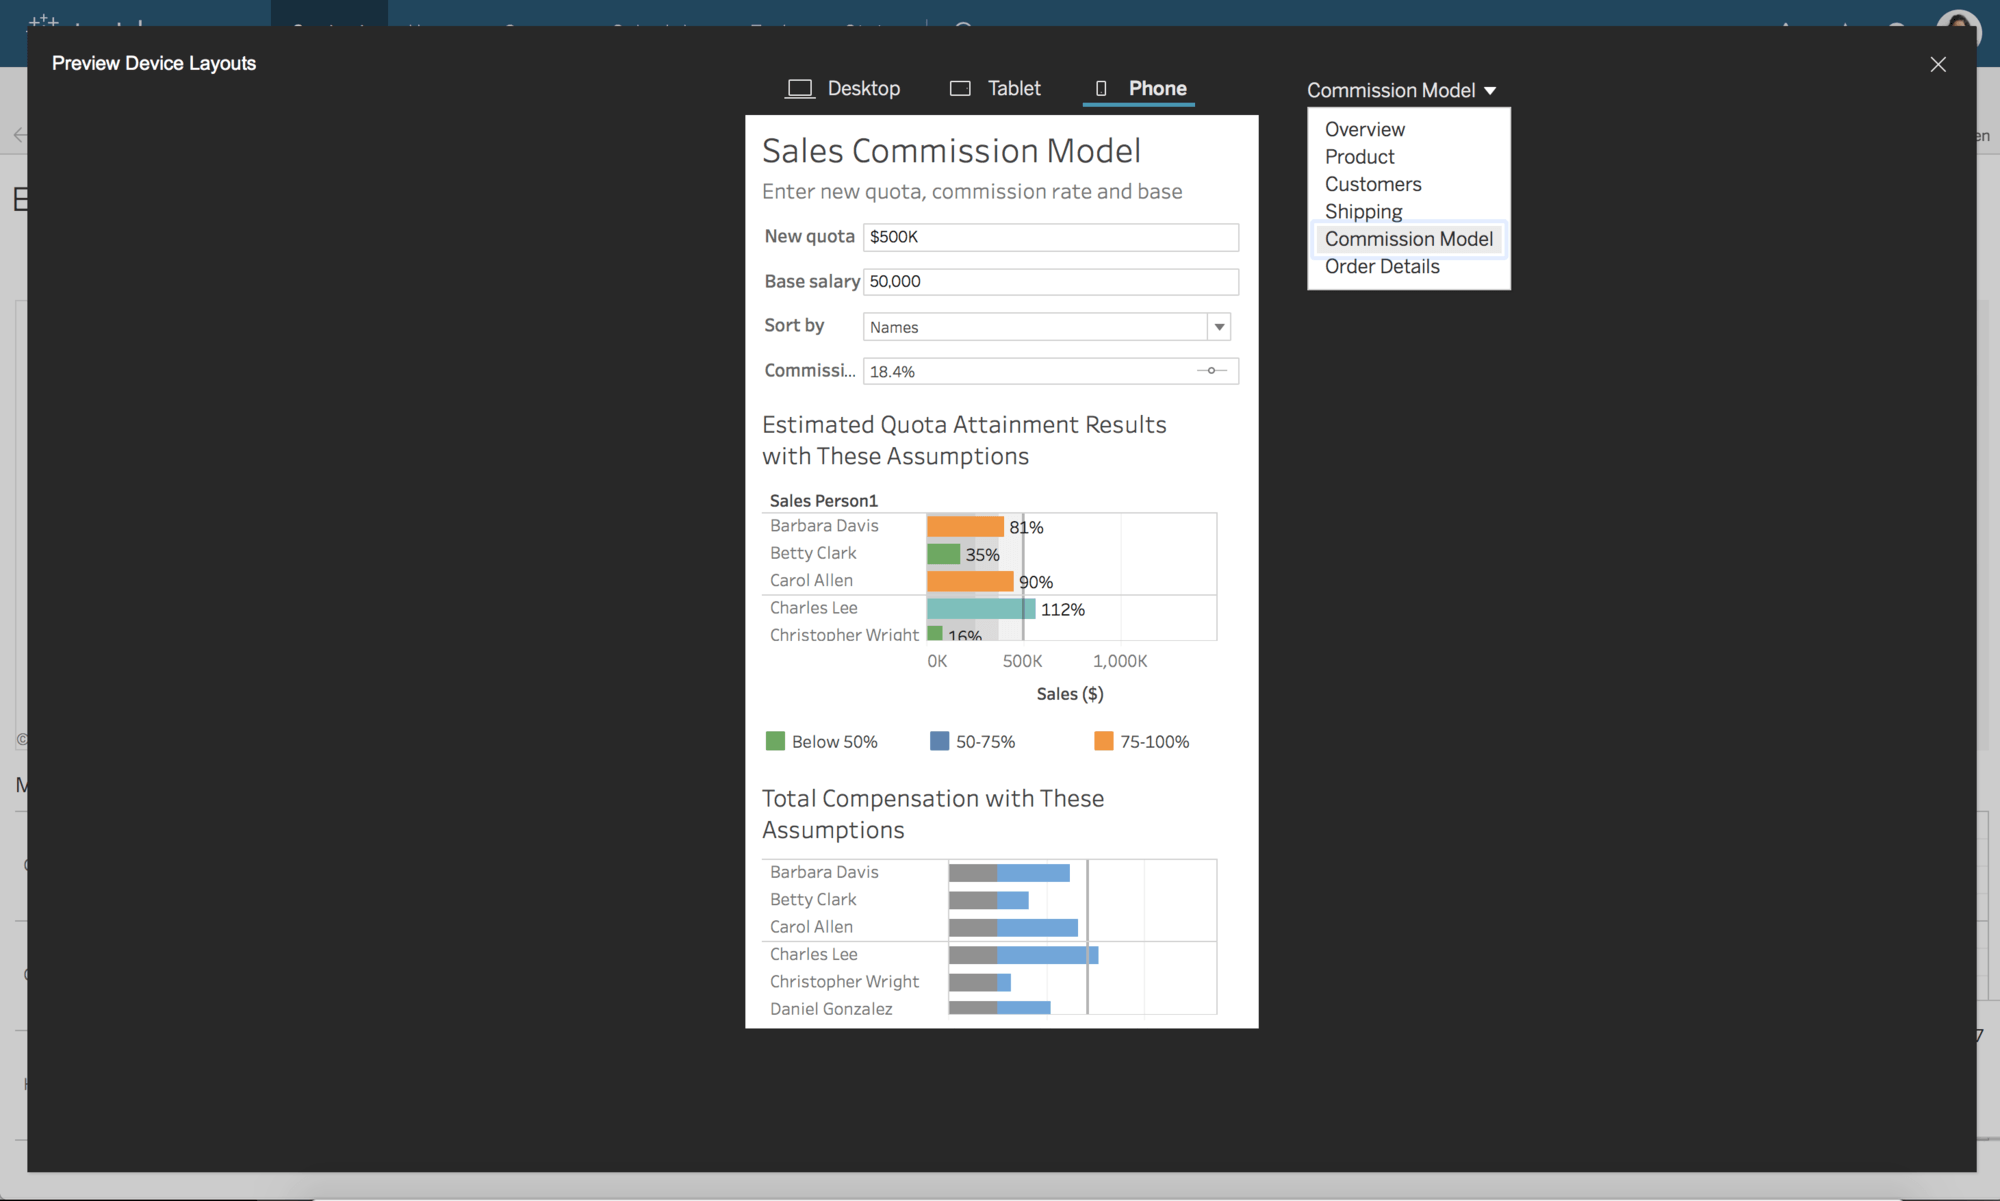
Device layout preview on the web
Device dashboard design just got easier. You can now preview what your laptop, tablet, and phone layouts will look like directly in the desktop browser. Make any necessary formatting or content adjustments to your dashboards, and save knowing your mobile layouts are pixel perfect.