
Tableau 2020.2
Introducing Relationships, Metrics, and Set Control in Tableau 2020.2
Elevate your relationship with data
Relationships
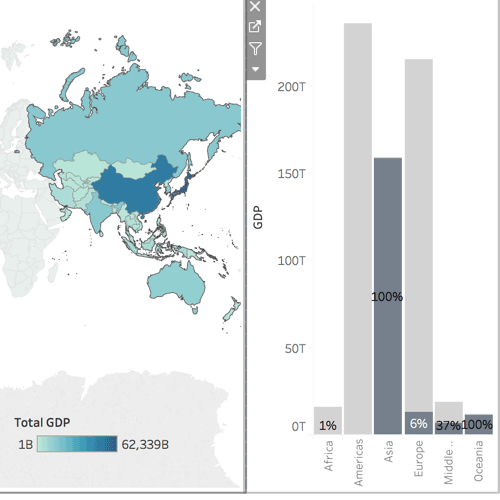
Combining data just got easier and more powerful. By visually creating logical relationships between tables, Tableau will only query the data relevant to your analysis at the right level of detail. Analyze complex data faster and with more confidence. Read more about using relationships here.
Watch now to learn more

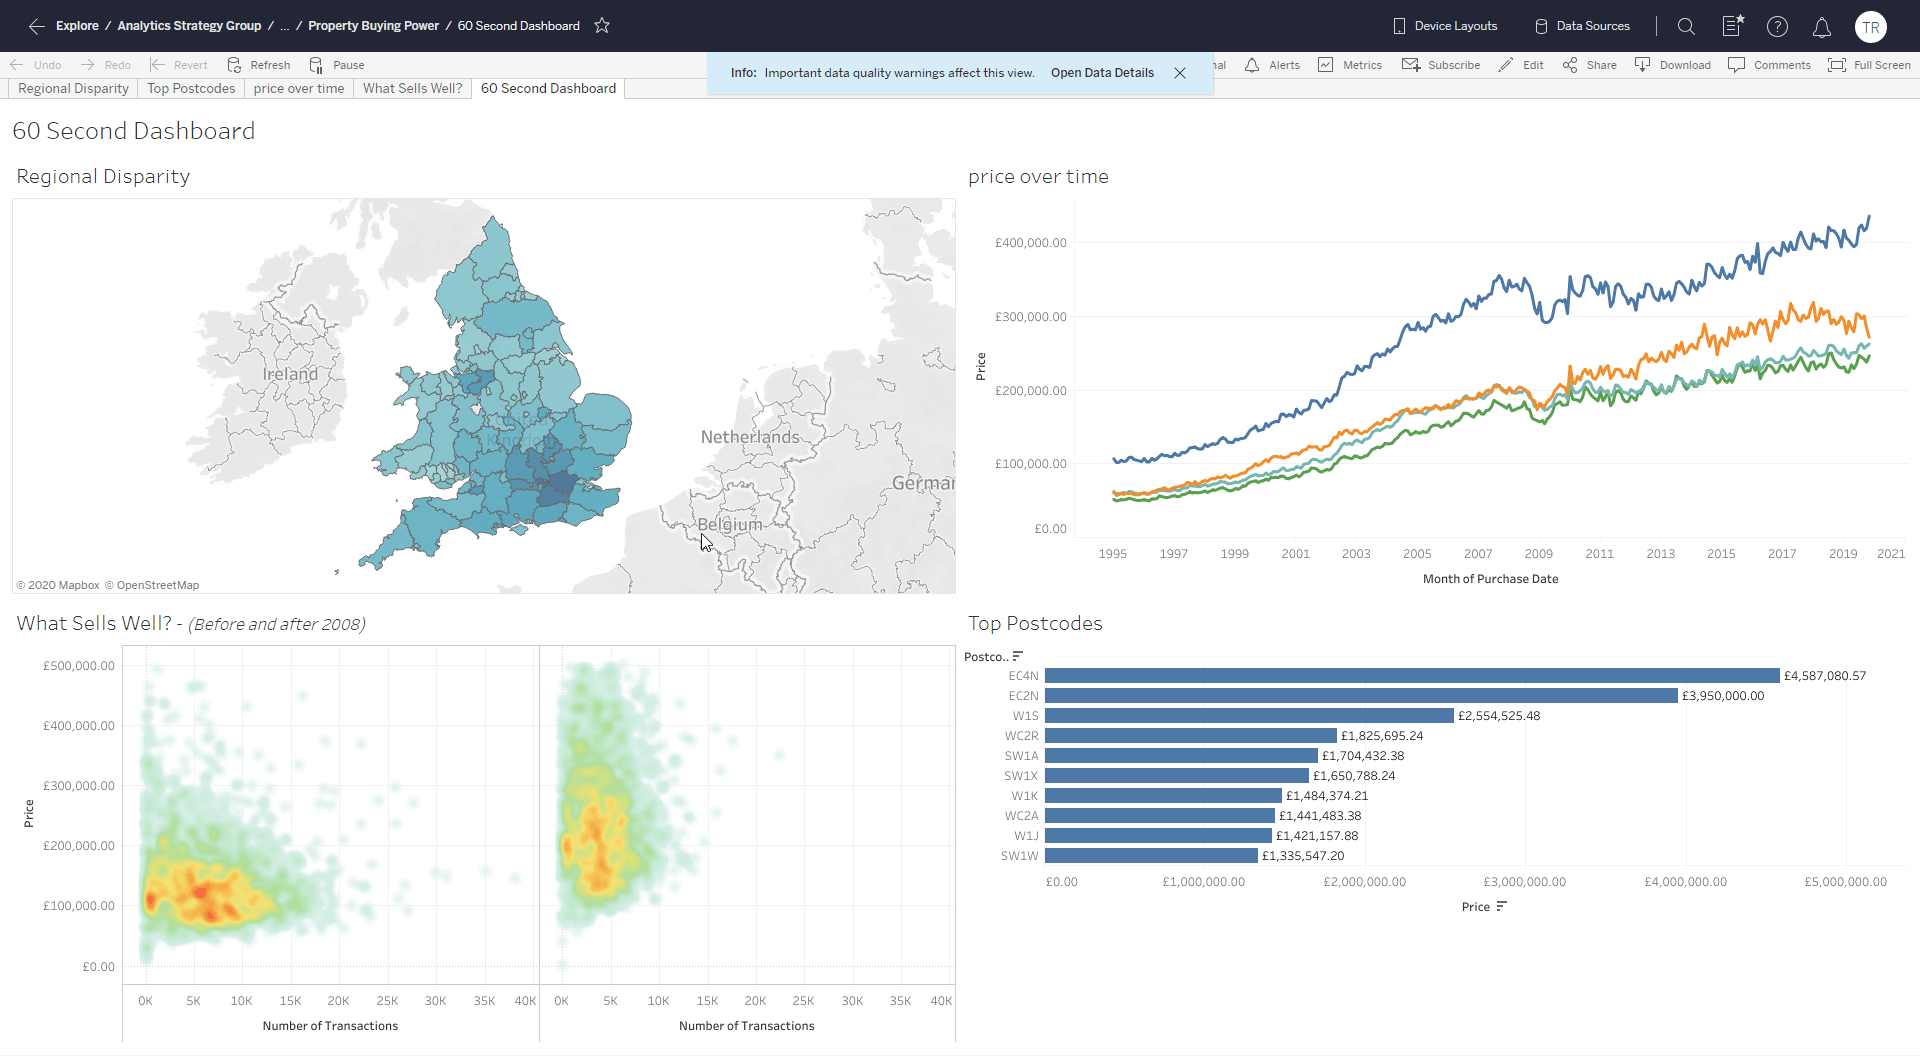
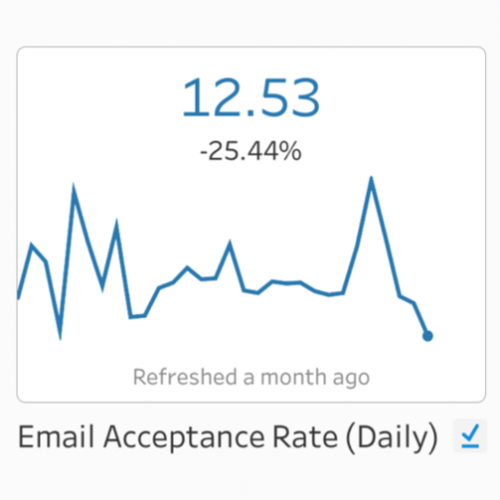
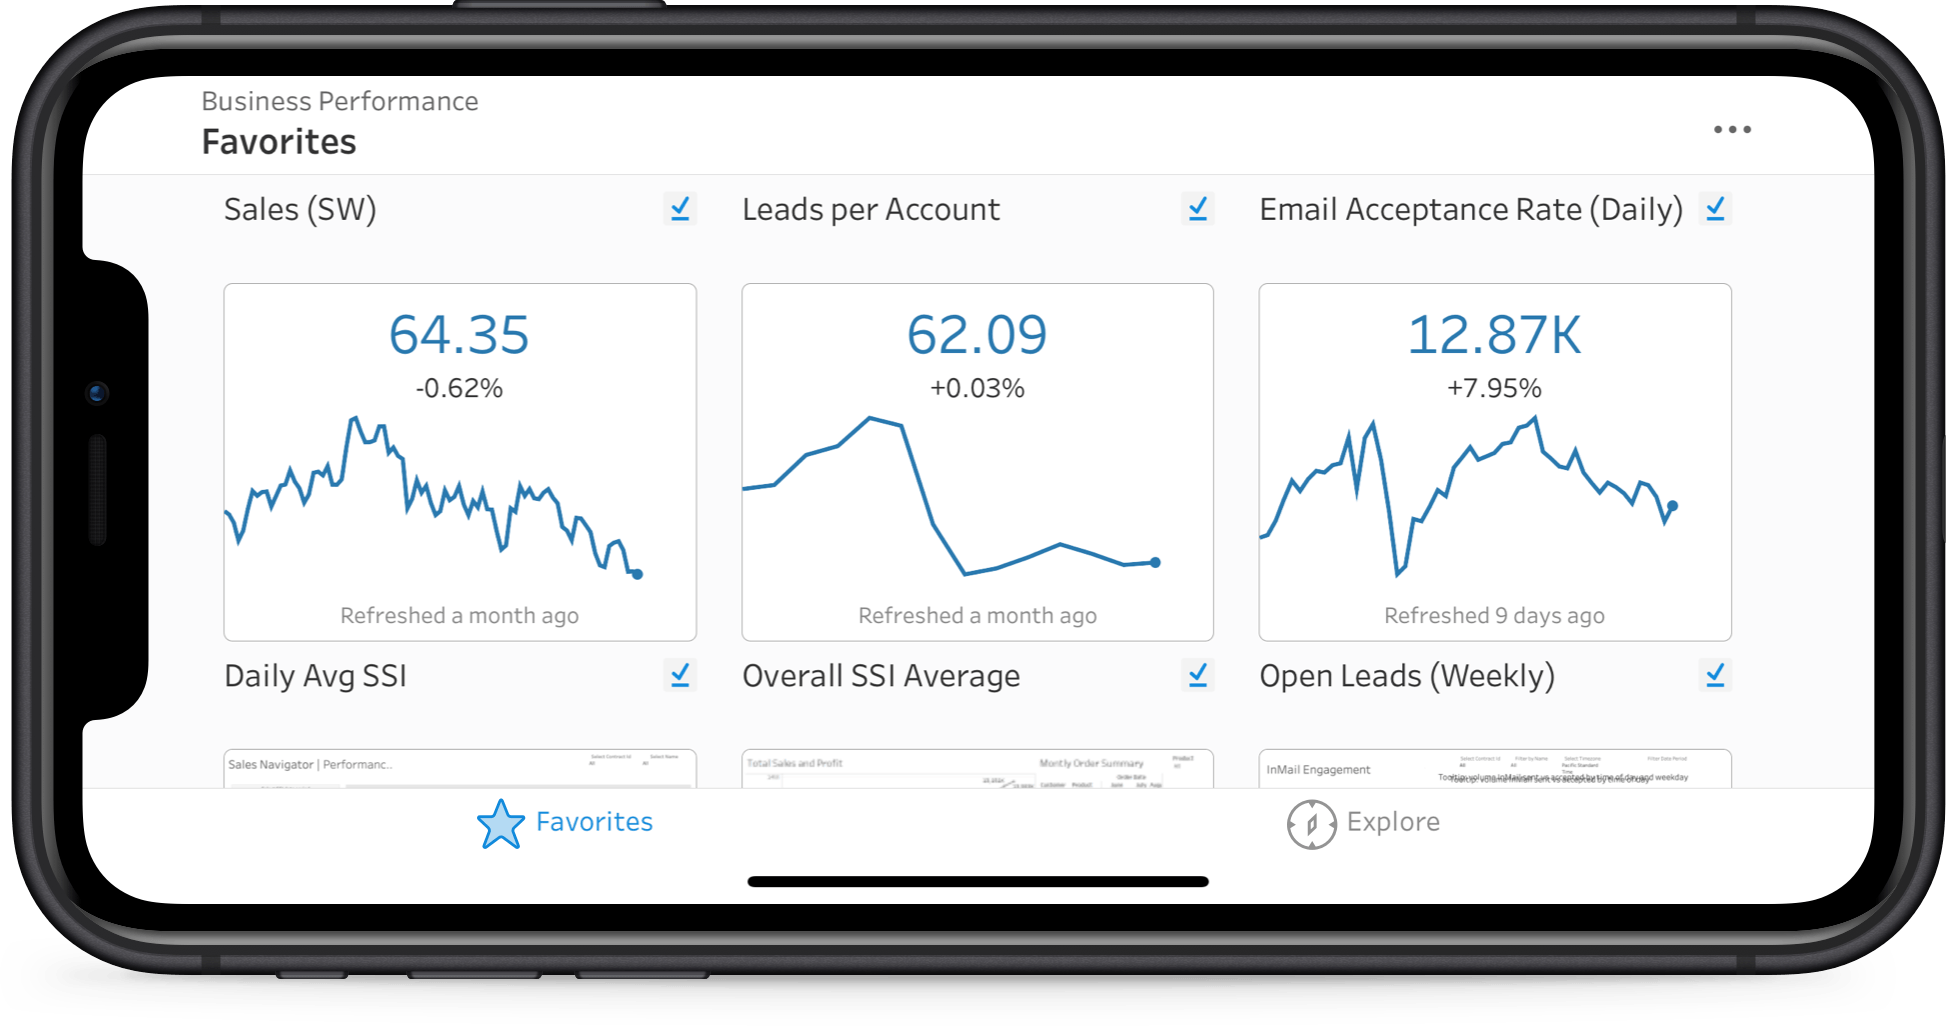
Metrics
Metrics are a simple way to get a curated and consistent view of your most important KPIs. Create a metric from nearly any Tableau dashboard with a single click and view your metrics across multiple dashboards in one spot - either on the web or the Tableau Mobile app.
Learn more about Metrics
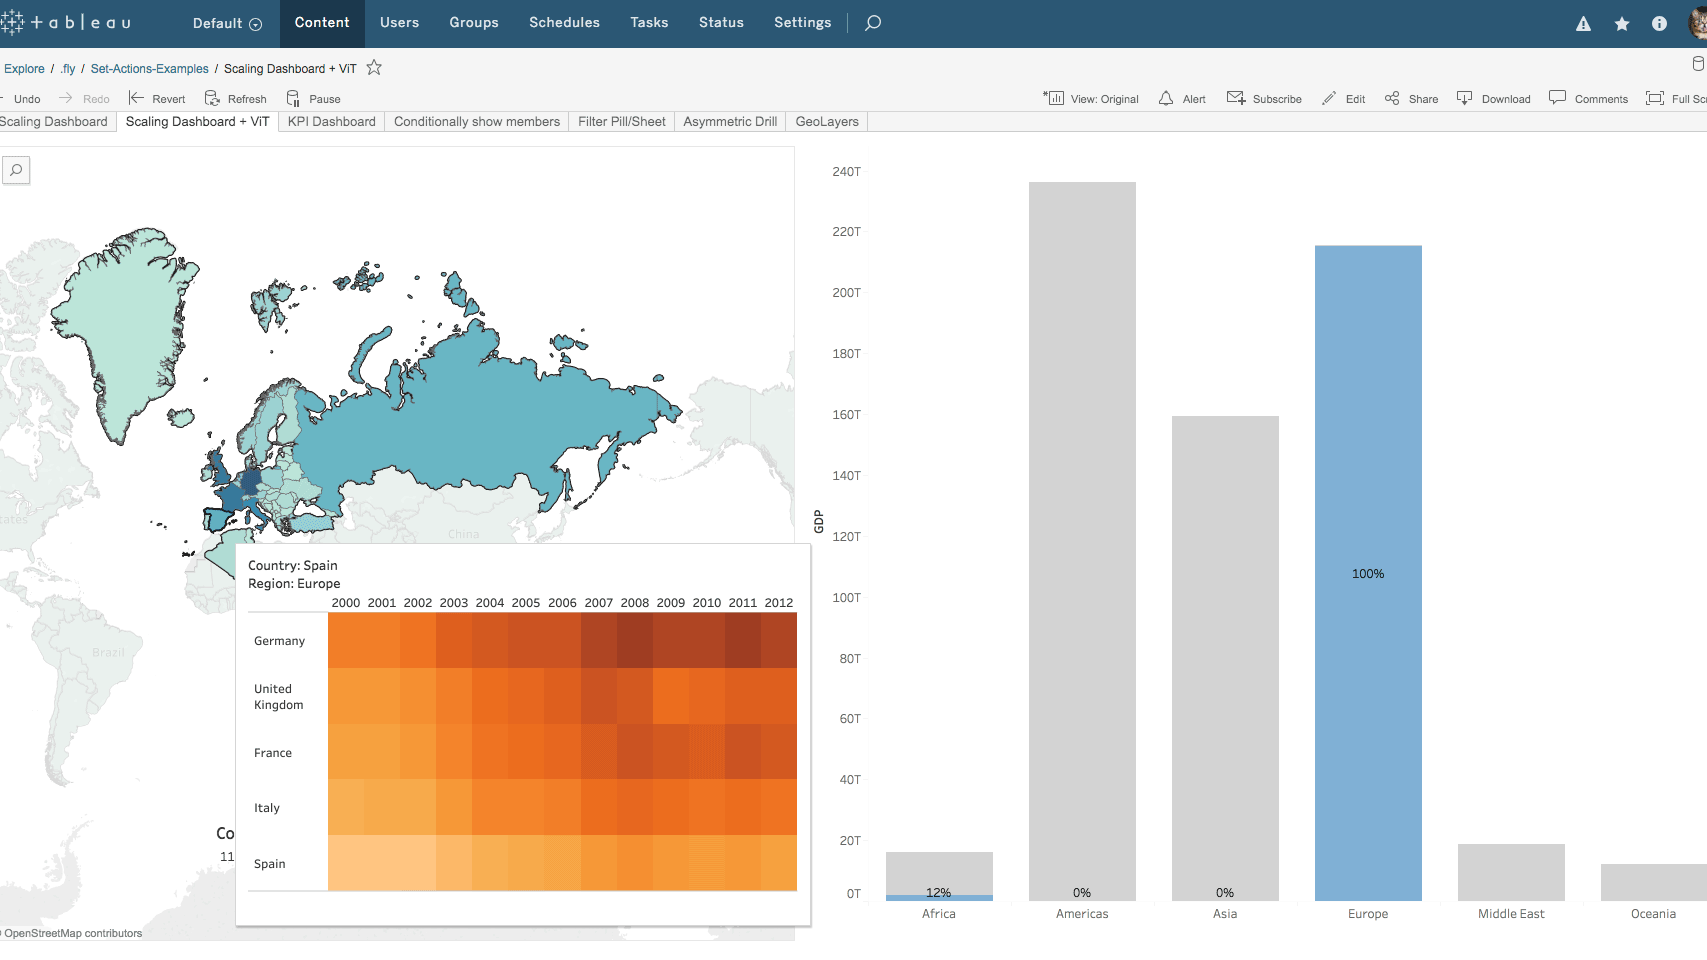
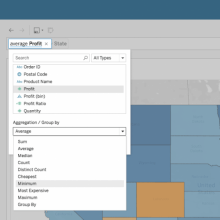
Set control
The set control allows users to dynamically change the members of a set using a familiar, quick filter-like interface. End users can change set membership with both a single and multi-select dropdown, and the set control automatically refreshes its domain so that the data stays fresh.
With Tableau’s data model improvements we are able to work faster in our COVID-19 analysis. We have COVID-19 case data at a county level, testing data at a date level, and hospital data at an institution level, and we’re overlaying census population data to normalize everything per capita. This would have required multiple join combinations into several disparate data sources to analyze the data, but with the improvements to Tableau’s data model, we can easily relate tables in a single, flexible data source.
All Features
View recommendations on Tableau Mobile
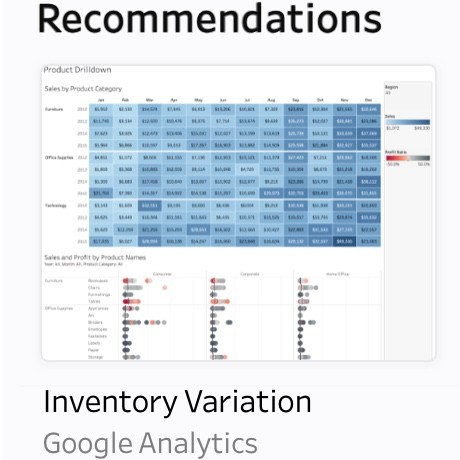
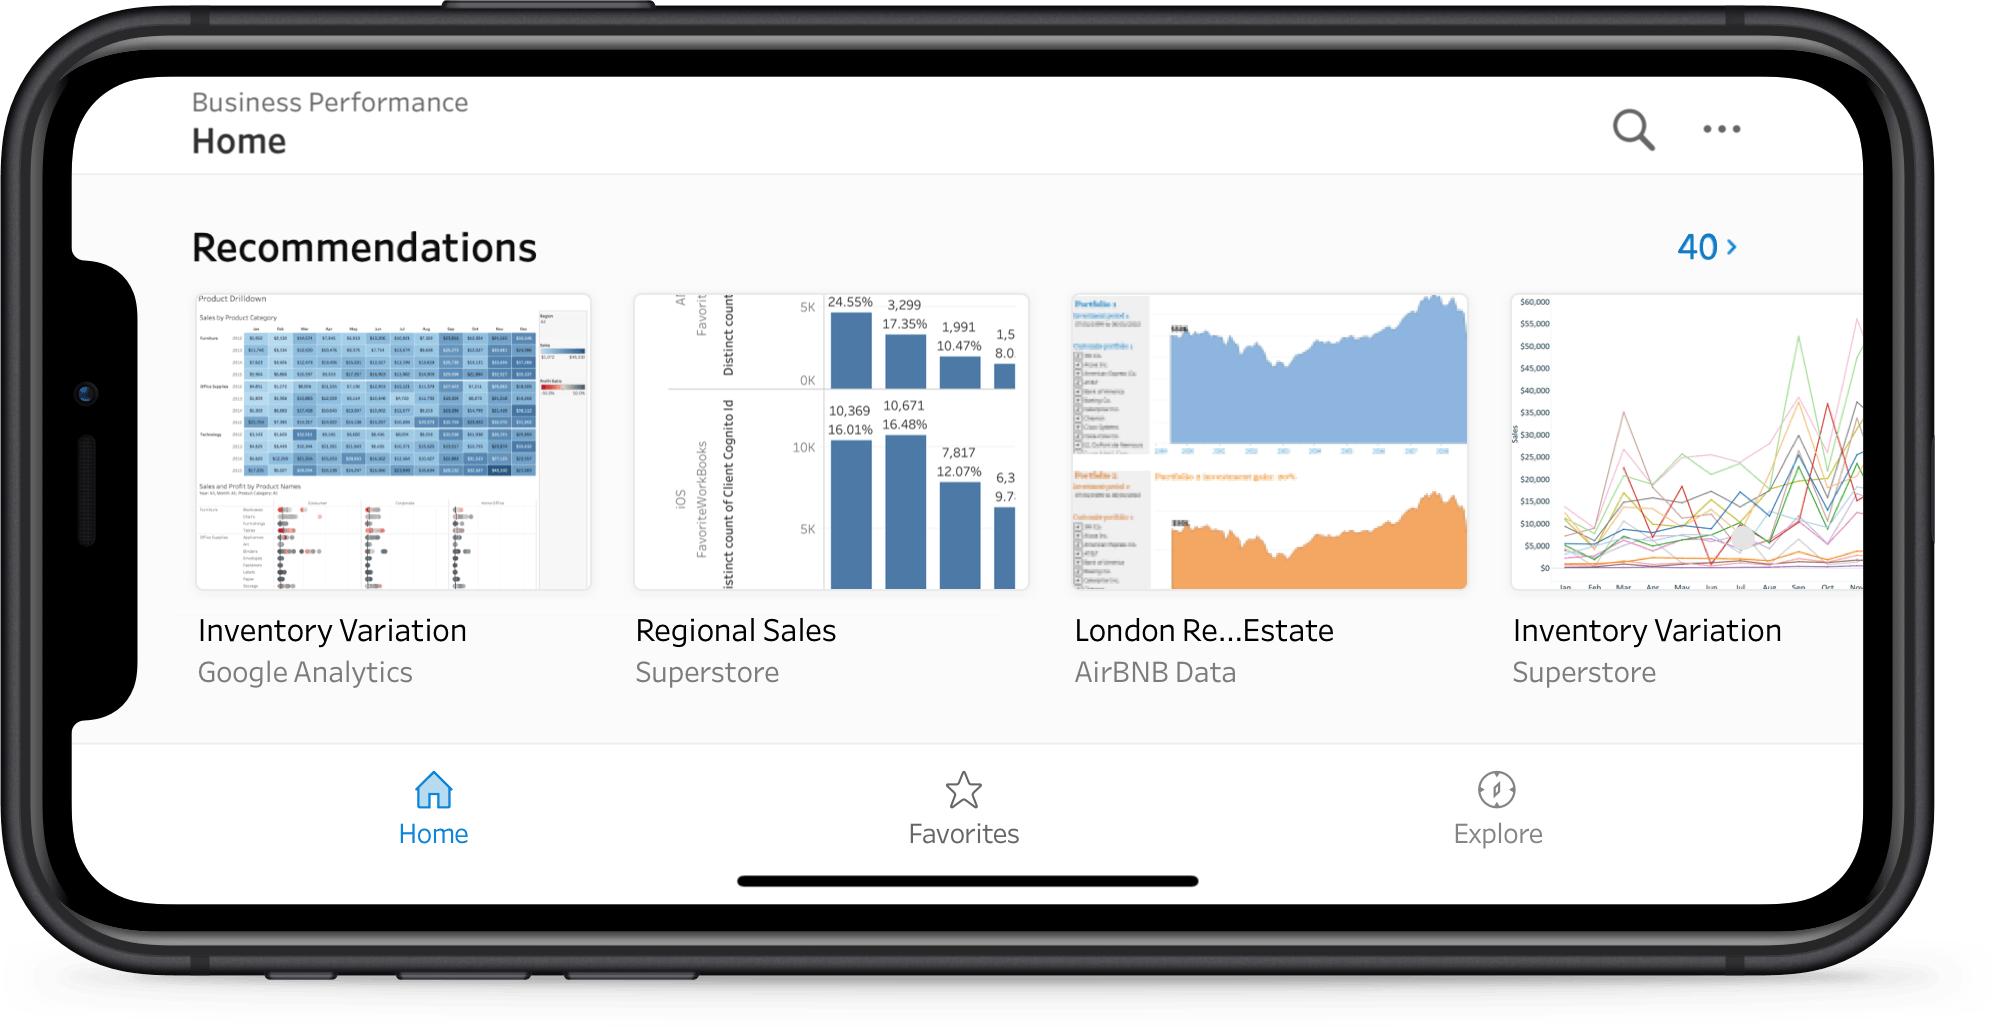
View recommendations are now on Tableau Mobile. Get personalized suggestions that instantly connect you to relevant vizzes on the go. Powered by machine learning, these recommendations leverage users' preferences and surface vizzes that others with similar viewing habits found interesting, and that are popular on your site. With the home tab, you can find recommendations in a dedicated channel on your Tableau Mobile App.
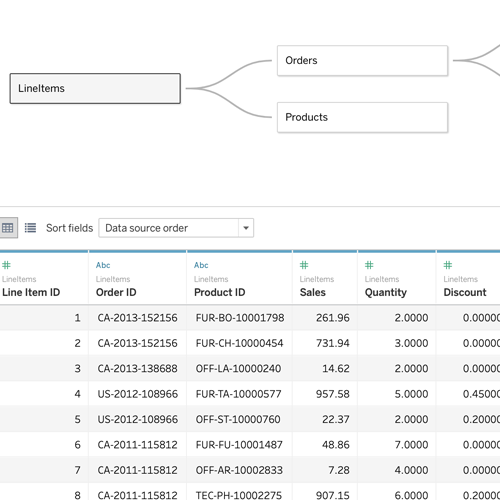
Relationships
Combining data just got easier and more powerful. By visually creating logical relationships between tables, Tableau will only query the data relevant to your analysis at the right level of detail. Analyze complex data faster and with more confidence.
Activity feed improvements
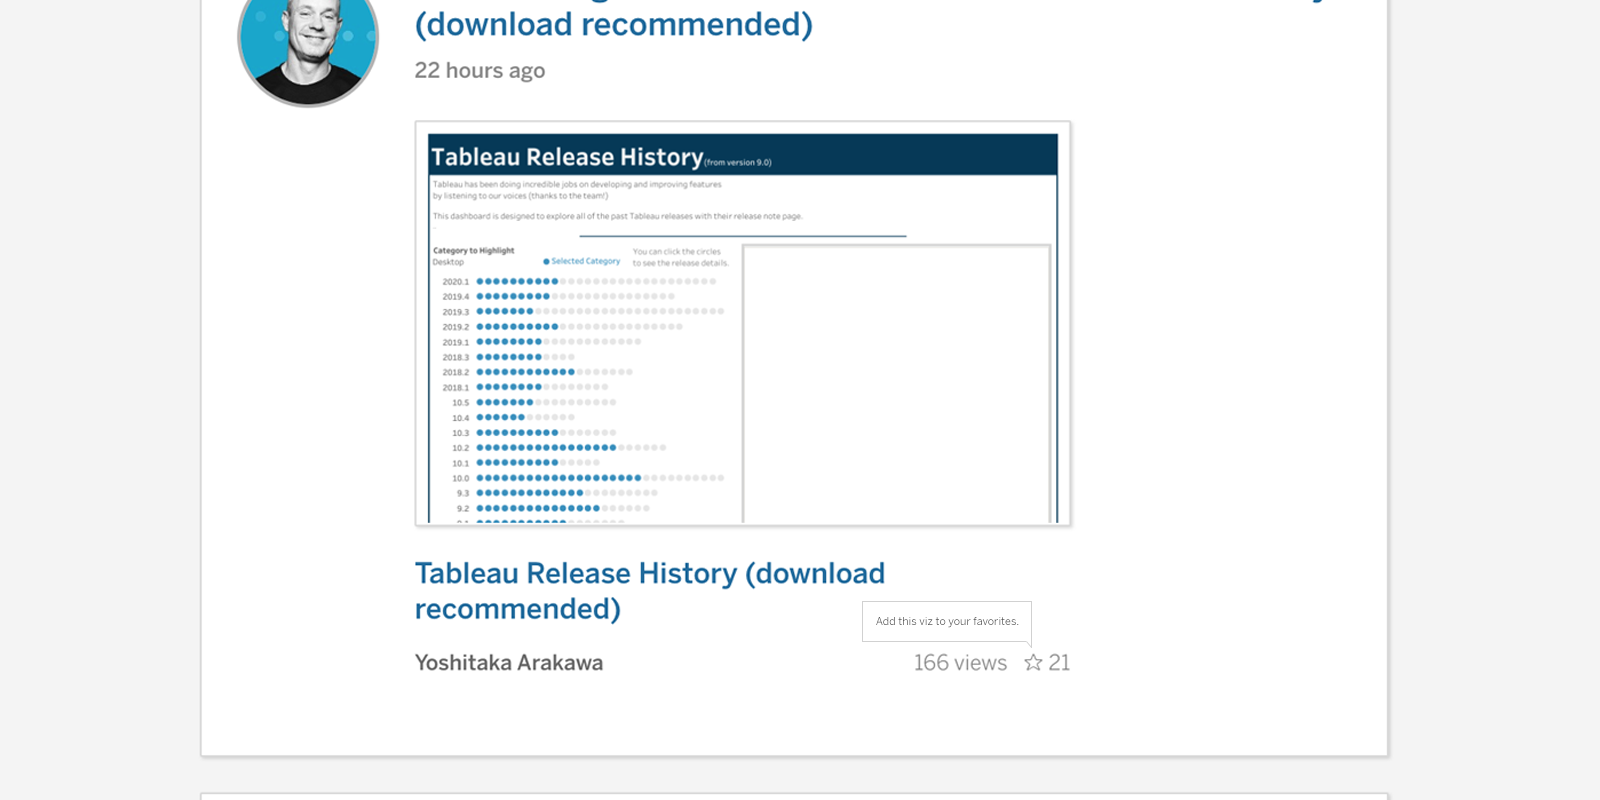
See a viz in your activity feed you like? You can now add vizzes to your favorites directly from your Tableau Public activity feed.
Set actions improvements
Set actions just got even more powerful with two new selection modes. You can now incrementally add and remove values from a set by interacting with marks in the view, even after a selection is cleared.
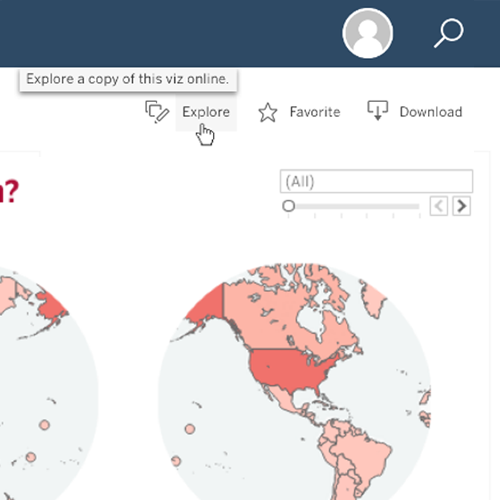
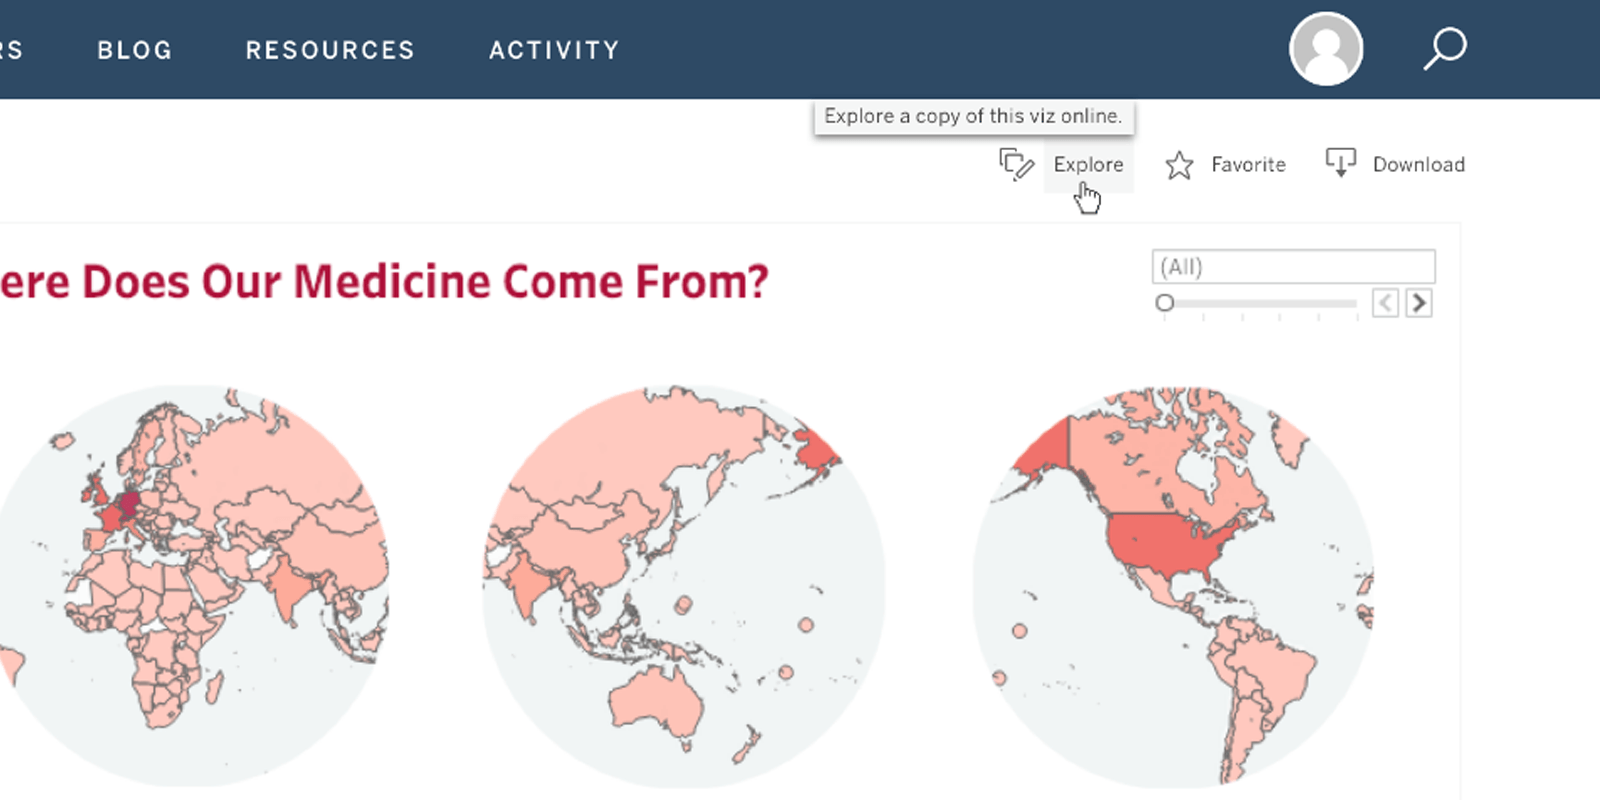
Explore a viz in the browser
Want to see how a viz on Tableau Public was made? You can now explore a viz directly in a browser. Explore, make your own version, and save as a copy to your profile with automatic attribution to the original author.
SAP HANA connector improvements
We have improved our OData Connector which now supports S/4HANA. Additionally, users can now connect to an OData service URL to list all the feeds inside their service and can join those feeds together just as they would any other tables in a Tableau datasource.
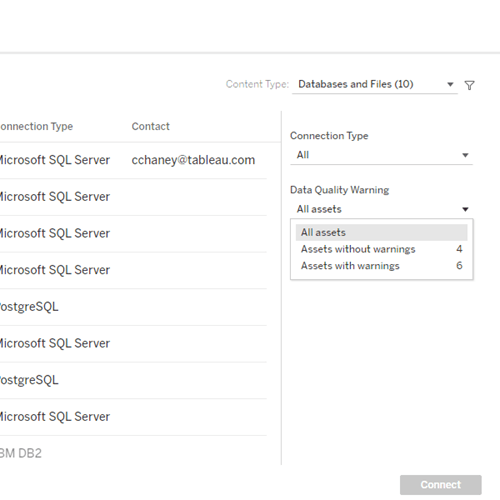
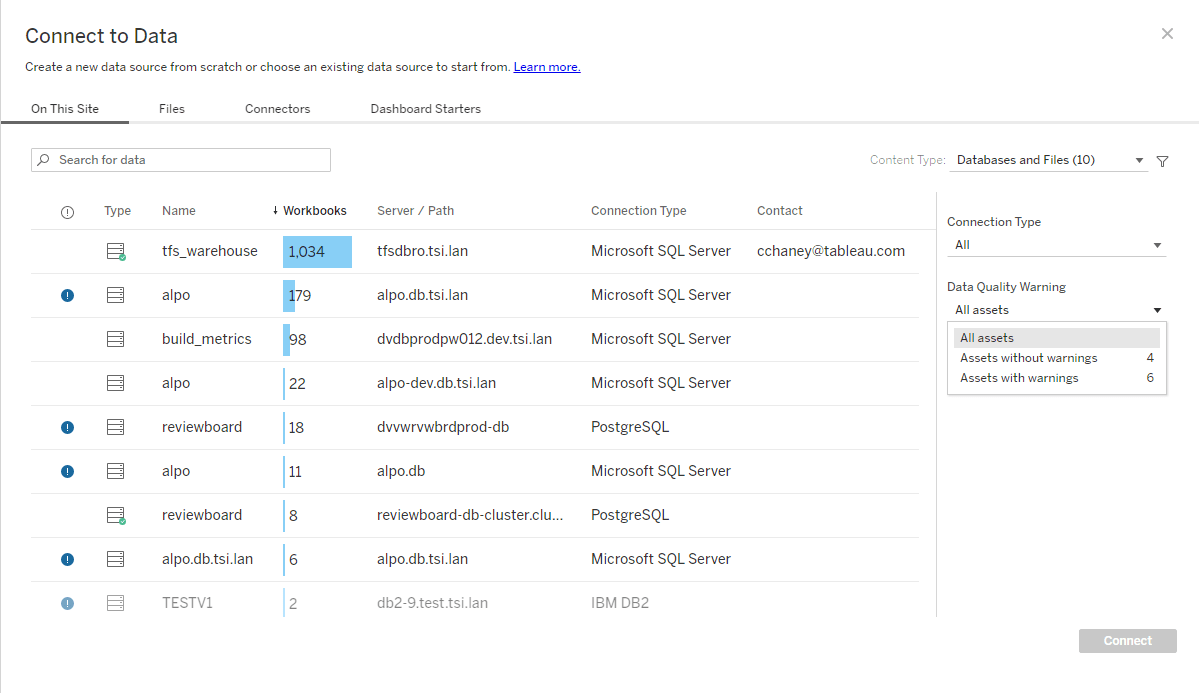
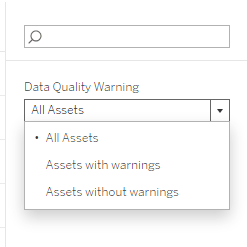
Filter data assets by warnings
When creating a new workbook, filter the data assets by those with or without the presence of a data quality warning. Be informed about the status of the data you're connecting to.
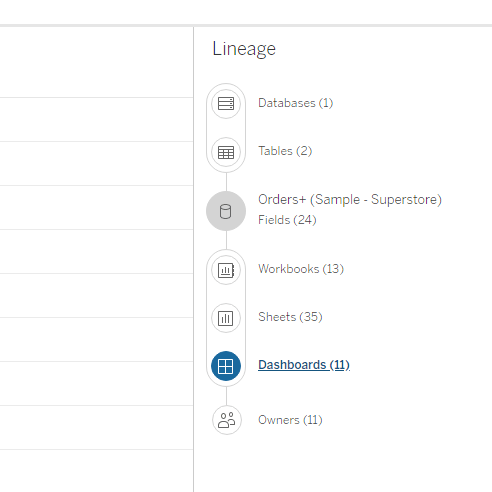
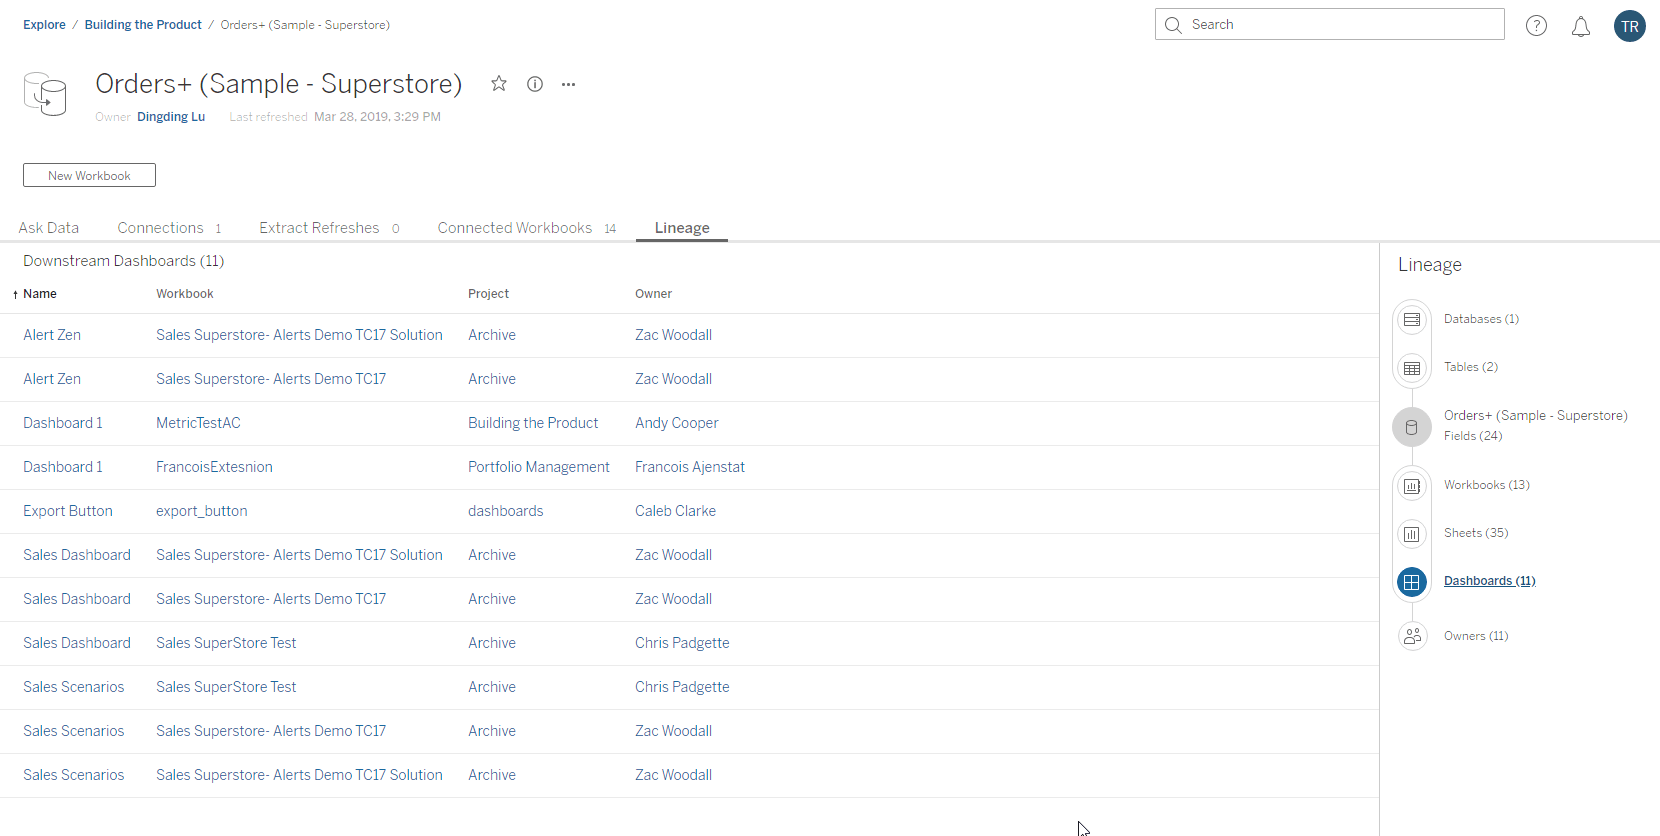
Dashboards in lineage
The lineage tool is powerful to understanding the relationships between all of the different data assets on your deployment. Now, you can see not only down to the sheet level, but also see dashboards.
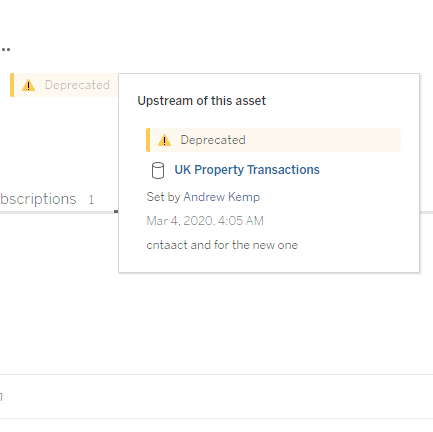
High visibility Data Quality Warnings
Data quality warnings make it possible to let users know when a data asset is flagged, whether because the data is under maintenance, it's stale, or some other reason. With high visibility data quality warnings, not only let users know about the issue but make sure they don't miss it.
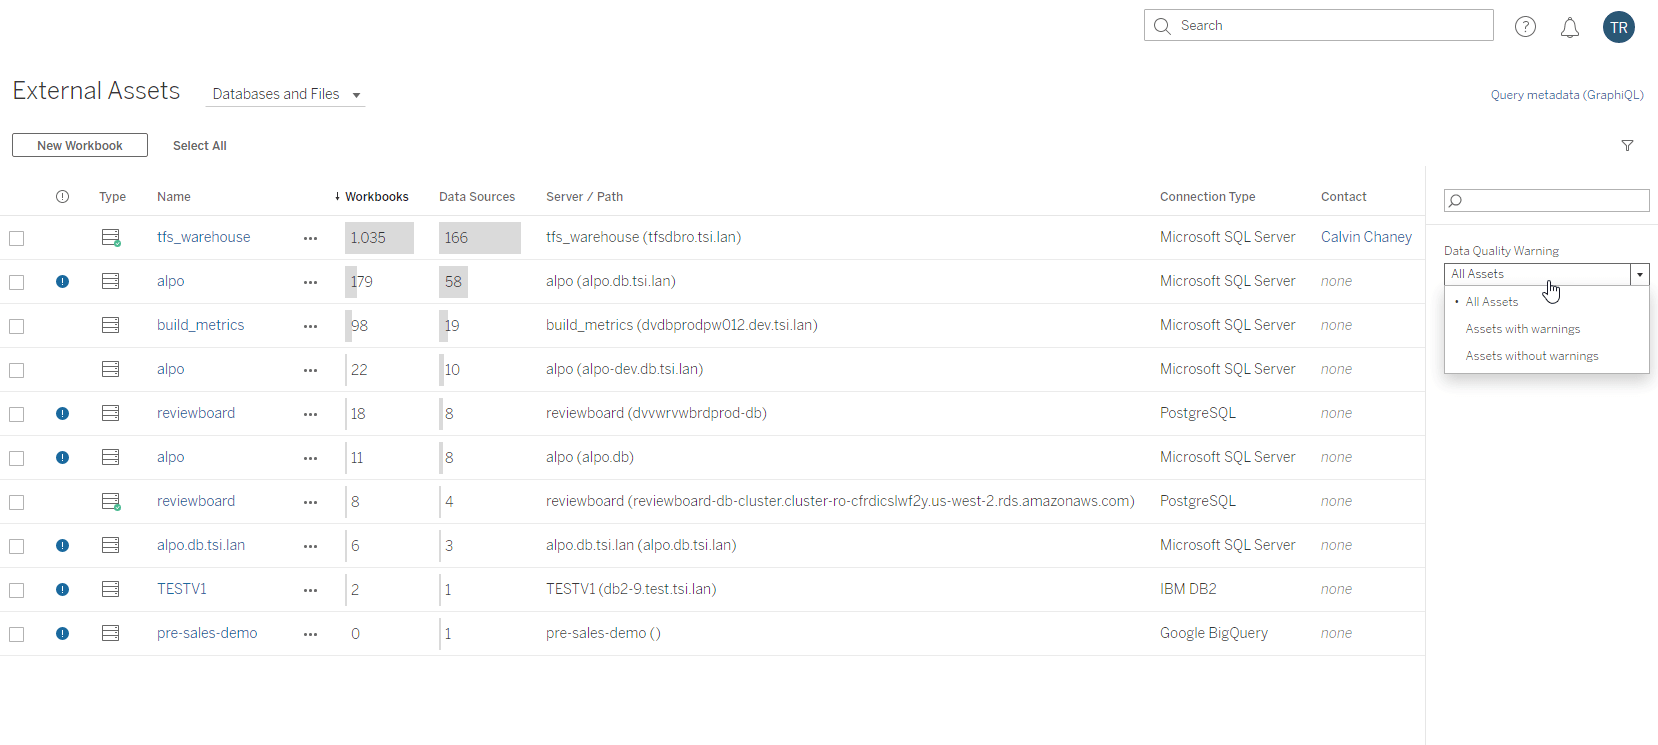
Filter External Assets
From the External Assets page, filter by connections type, certifications, or Data Quality Warnings. Get a better understanding of all the assets on your server or site.
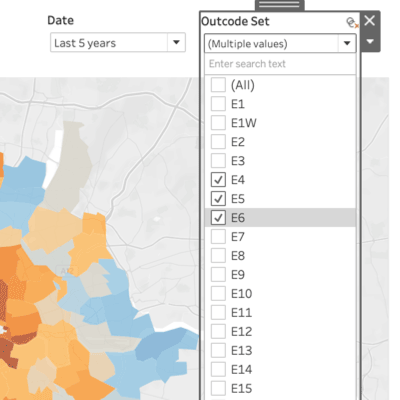

Set control
The set control allows users to dynamically change the members of a set using a familiar, quick filter-like interface. End users can change set membership with both a single and multi-select dropdown, and the set control automatically refreshes its domain so that the data stays fresh.
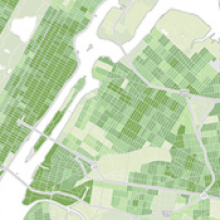
Oracle spatial support
We’re expanding Tableau’s spatial database connections to make solving location-based questions easier than ever. You can now connect to tables in Oracle that contain spatial data, and instantly visualize that data in Tableau.
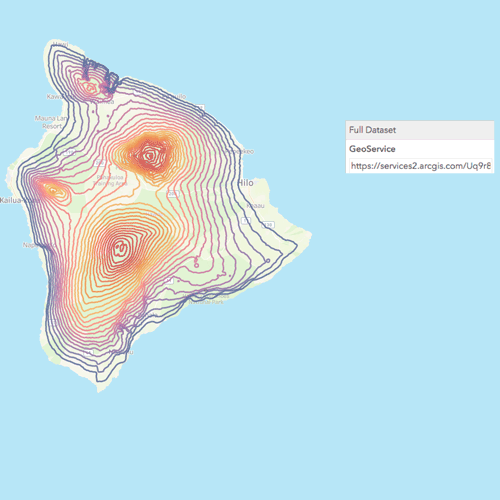
Esri web data connector
You can now connect Tableau directly to your location data in Esri by simply entering an ArcGIS Server URL or GeoService API URL. Automated extract refreshes ensure that visualizations are always up to date, and enable you to spend less time sourcing data and more time in analysis.
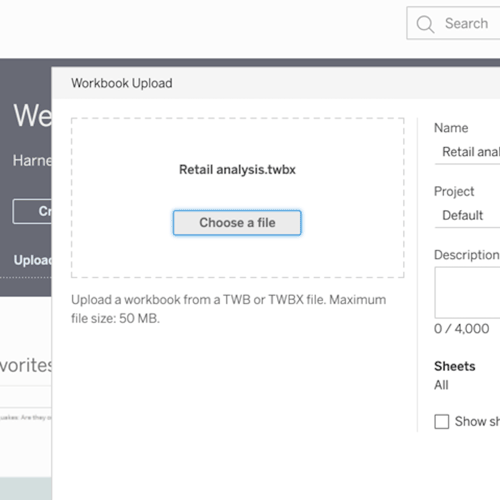
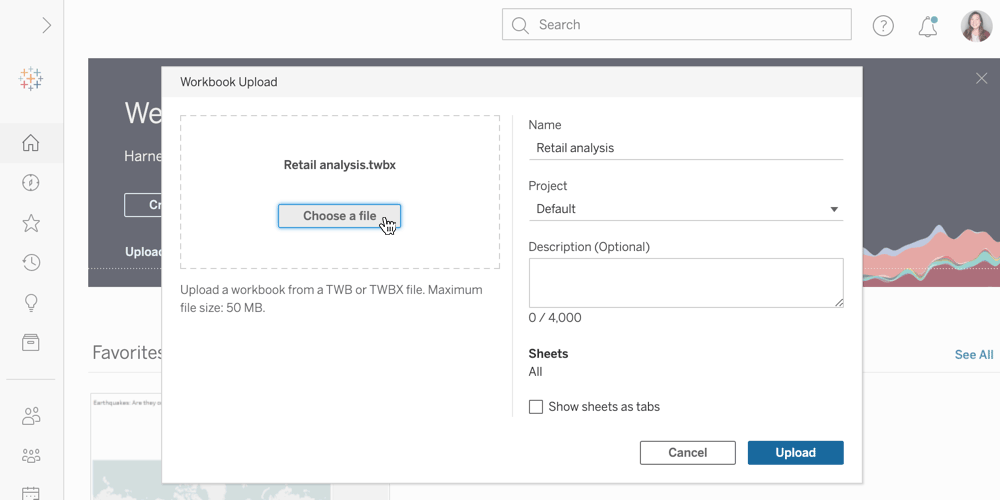
Open or upload workbooks on the web
Sharing your work and exploring insights from others just got easier. You can now open a Tableau workbook, or upload it straight to the web without having to use Tableau Desktop. Simply select the workbook (.twb or .twbx) you want to upload and publish directly to your site on Tableau Server or Online. Only users with the appropriate publishing permissions will have the ability to upload content.
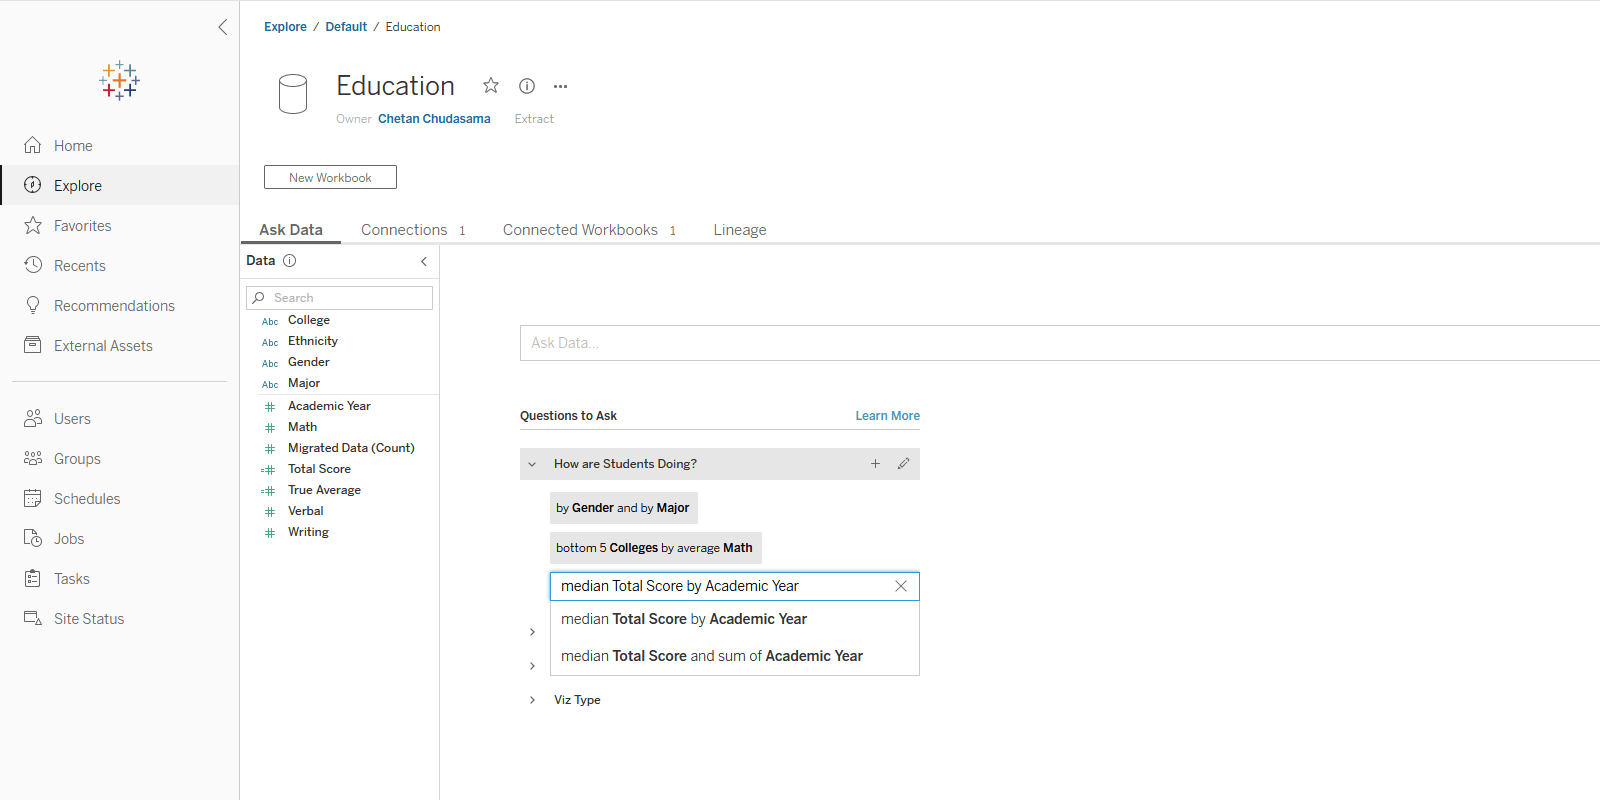
Ask Data improvements
You can now create custom suggestions and consistent semantic context with data roles. With customized suggestions, data source owners can provide relevant prompts that give users insight to the data and the types of questions they can ask. Data roles make it easy to add important context to field definitions and synonyms, and apply that information across data sources. Other improvements include support for scripted data sources and improved enterprise controls.
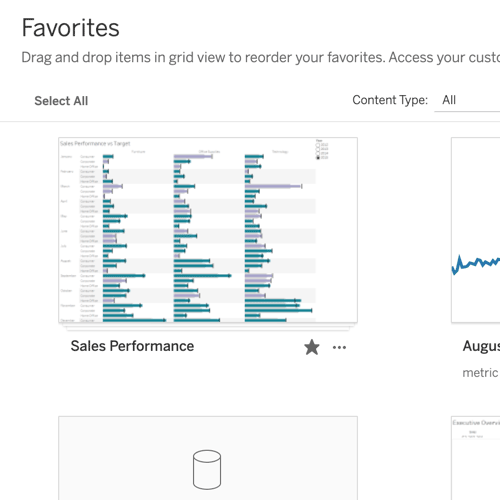
Reorder favorites
You can now manually sort your favorited content on Tableau Server and Tableau Online. From the grid view, simply drag and drop your Favorites in the order you want to see them, bringing your most important content front and center.
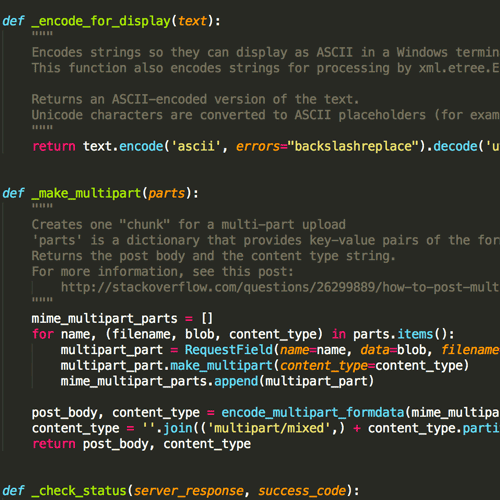
Multiple External Services Connections for Tableau Server
Server administrators can now configure multiple Analytics Extension (formerly External Service) connections in Tableau Server. Administrators can set one per site through the Settings UI and turn connections on or off at the Site level. Now teams using different R, Python, and other external data science environments can share their work with consumers across the same Server. Settings are easier than ever to configure with UI controls or via the Server REST API.
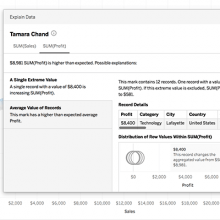
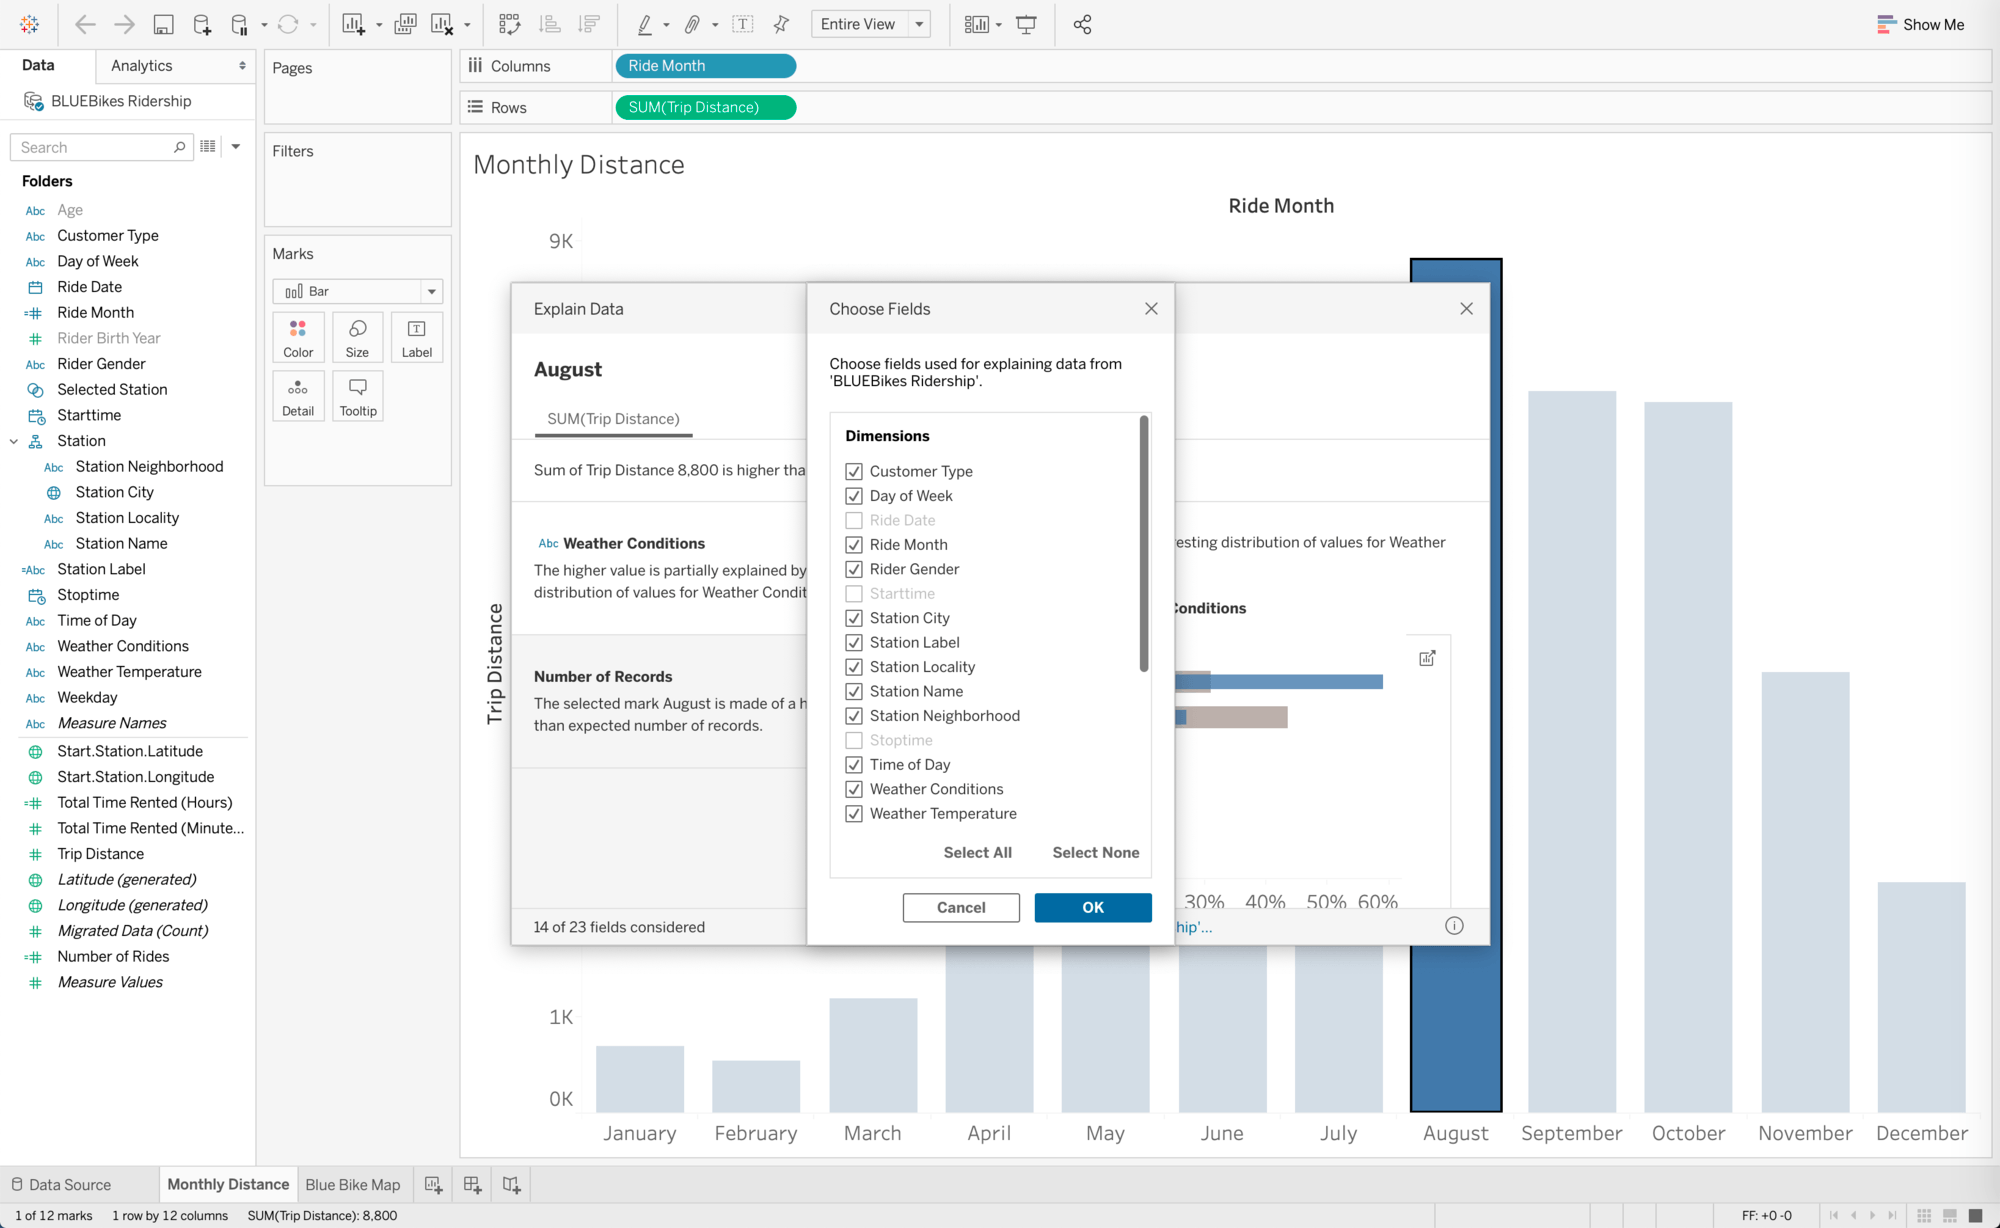
Explain Data improvements
Dashboard authors now control which columns are modeled in Explain Data. With the ability to select which columns are included and excluded from explanations, authors can better curate their analytical experience. Explain Data will also now surface multiple extreme values, allowing you to explore more than one outlier at a time.
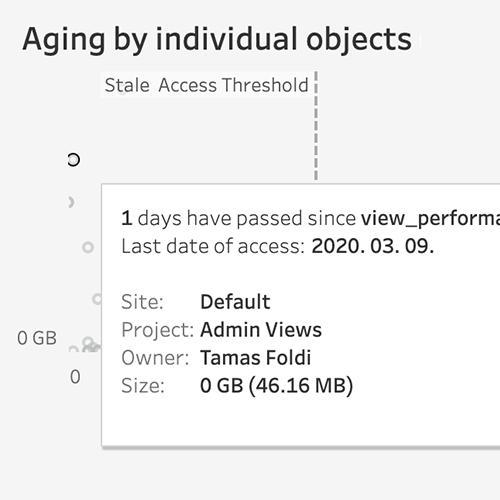
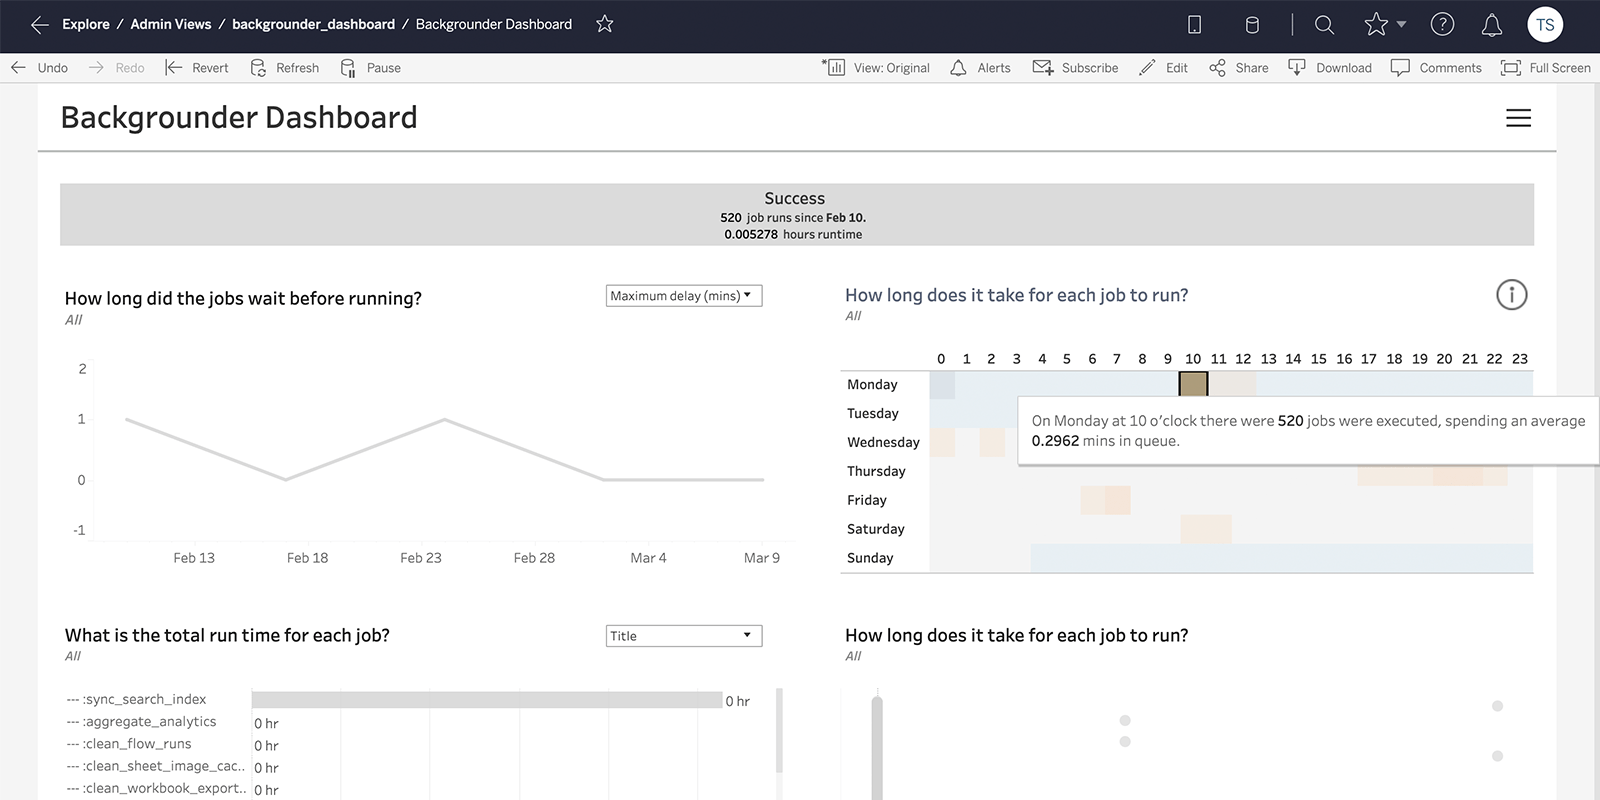
New Tableau Server admin views
We've added two new views to give you better insight into the health of your Tableau Server deployment. The new backgrounder view gives you additional insight into backgrounder load, how long jobs run for, and events like failures, cancellations, and completions. Our new stale content view helps you identify unused content based on customizable parameters that you can establish for your Tableau Server.

Hot configuration
Now many common TSM commands can be implemented without having to restart Tableau Server. Hot config commands are clearly identified in the command line when you are making changes.
Webhooks updates
You can now enable webhooks at the site level, giving you more fine-grain control across your deployment.
Rest API updates
You can now programmatically export a workbook as a Powerpoint file, making it easier to operationalize traditional reporting workflows. You can also lock nested projects programmatically.

Salesforce connector for Tableau Prep Builder
Connect to Salesforce directly within Tableau Prep Builder and start getting to analysis faster.
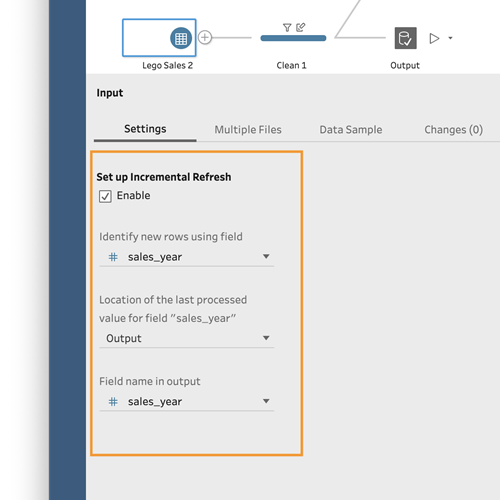
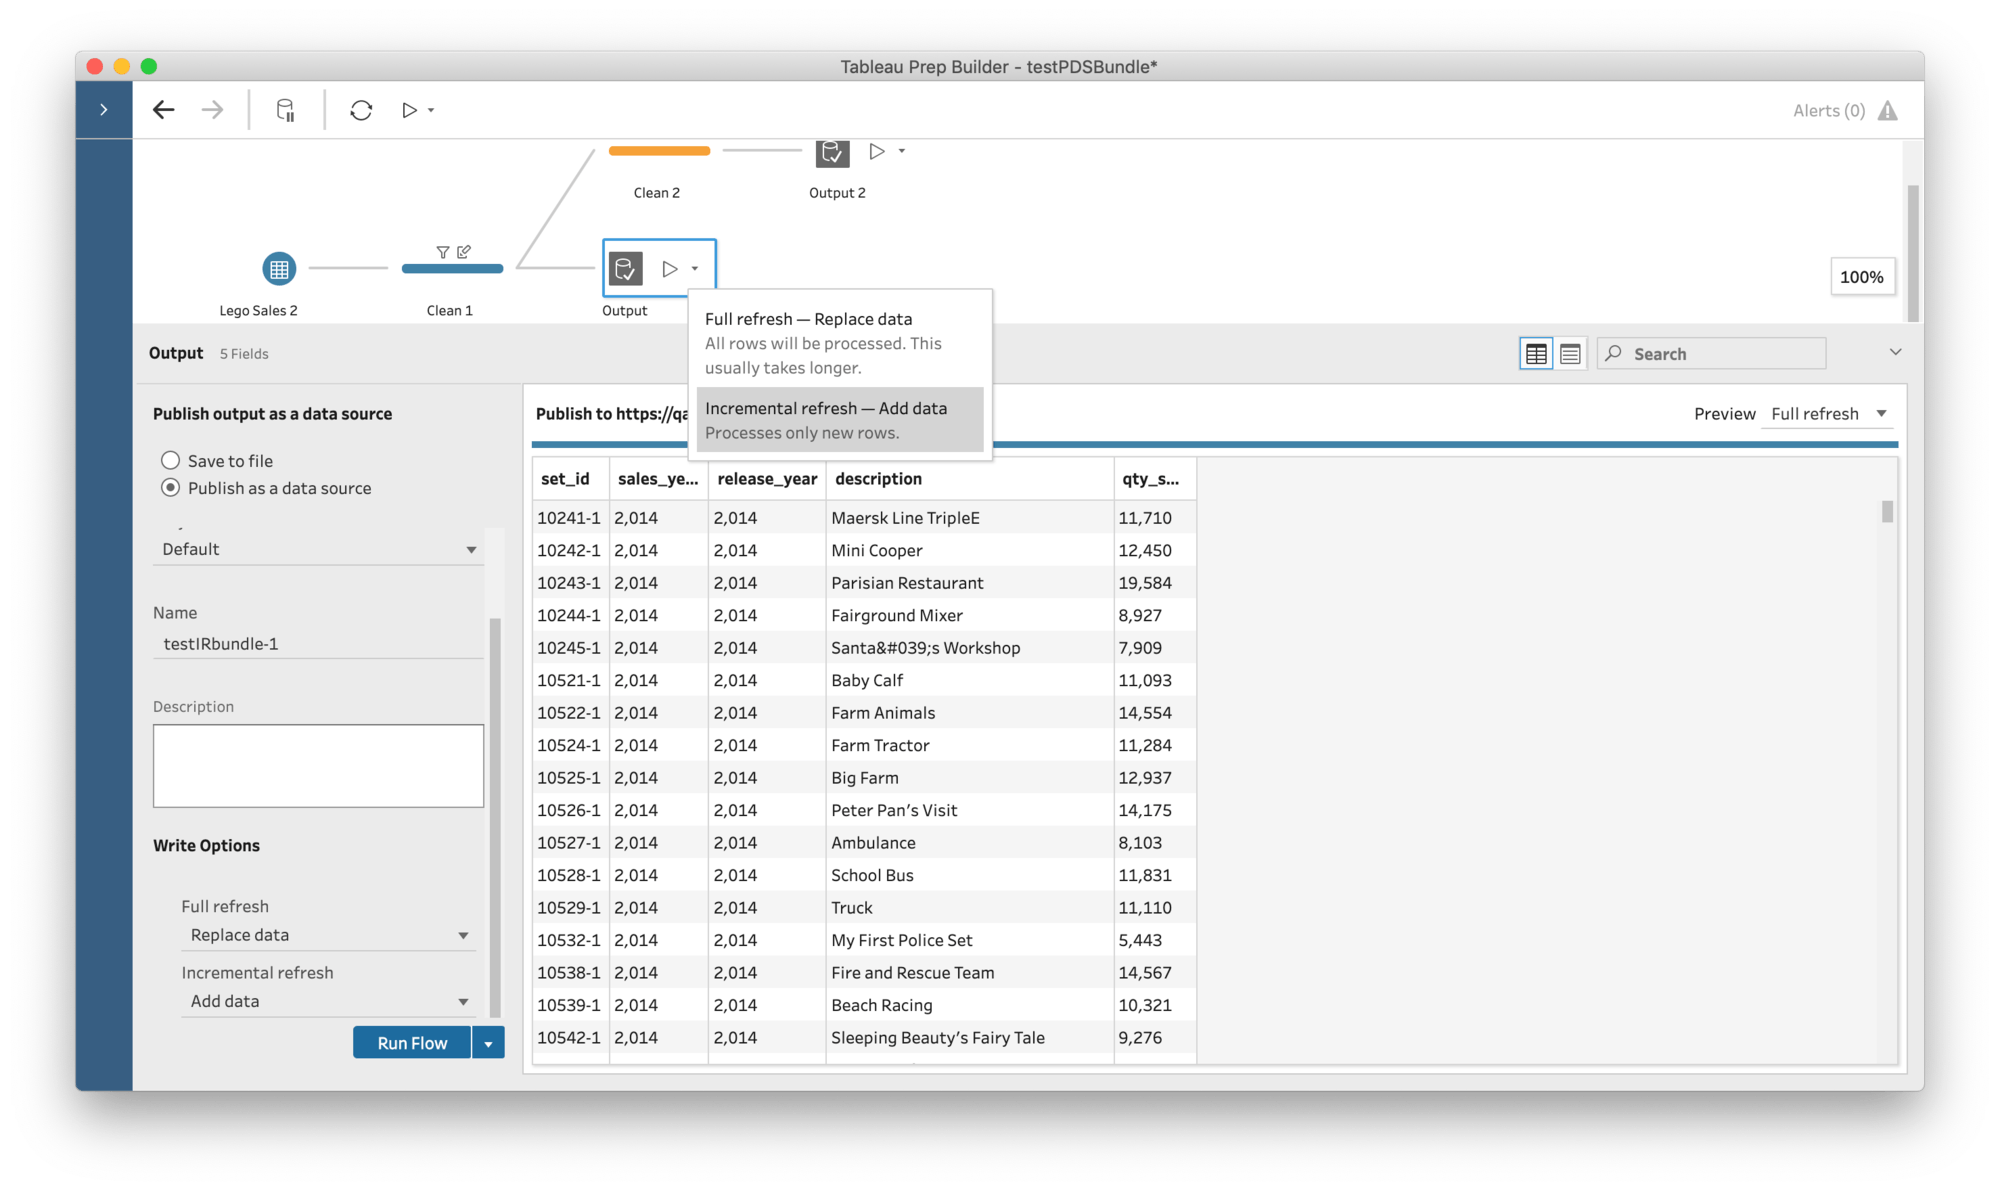
Incremental data refresh for Tableau Prep
Whether using Tableau Prep Builder or Conductor, incrementally add fresh data to the flow. This saves time and resources, preventing the need to rerun the entire data set.
Metrics
Metrics are a simple way to get a curated and consistent view of your data. Create a metric from nearly any Tableau dashboard with a single click and view your metrics across multiple dashboards in one spot - either on the web or the Tableau Mobile app.
OpenID authentication
You can now connect to and sign-in with the Tableau Mobile app when Tableau Server is configured with OpenID authentication. You can leverage the default browser on your device (Safari on iOS, Chrome on Android) when authenticating and remain logged-in to the browser. The secure exchange between the browser and the mobile app is based on the key components of the OpenID connect standard called Proof Key for Code Exchange (PKCE).
Certificate-based (Mutual SSL) authentication
You can now connect to and sign in with the Tableau Mobile app when Tableau Server is configured with Certification-based auth or Mutual SSL. You can leverage the default browser on your device (Safari on iOS, Chrome on Android) when authenticating and remain logged-in to the browser.
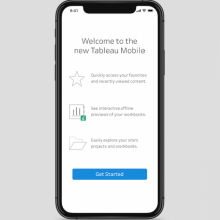
Tableau Mobile for BlackBerry
Tableau Mobile for BlackBerry is an update to the existing mobile app. The new app (compatible with iOS13) includes a newer and more intuitive design, an improved search and browsing experience that is consistent with Tableau Server and Tableau Online, as well as enhanced offline capabilities so users can enjoy the richness and interactivity of visualizations, from anywhere.

Tableau Mobile for Intune (iOS)
Tableau Mobile for Intune is a new app that provides a quick and secure way to view, analyze and leverage the data that’s in your organization on Microsoft’s Intune Enterprise management platform. The app, compatible with iOS13, includes a design that is fast and intuitive, an improved search and browsing experience that is consistent with Tableau Server and Tableau Online as well as enhanced offline capabilities that are quick to load and offer richness and interactivity for visualizations.

Mobile Deep Linking Improvements
You can now open links to your dashboards and metrics in Tableau Mobile, whether you use Tableau Server or Tableau Online. Get to your content quickly for further exploration while using your mobile device.