Aargau Cantonal Police Simplify and Improve Police Work with Tableau
Clear, geocoded overviews for any region with a click of the mouse
More efficient planning of operations through visualisation of traffic or crime hotspots
Supporting investigations in areas with serial offences and prognoses of future crime
Aargau Cantonal Police is a criminal, traffic and security police agency with a force of about 640 officers and 100 civil employees responsible for firm enforcement of the rule of law in the Swiss canton of Aargau. In the Situation and Analysis Centre of the Central Department for Command & Deployment, Crime Analyst Angelo Somaini sets out to improve the usability of relevant recorded data for all colleagues in the canton's police system and to implement comprehensive geocoded reporting for various purposes.
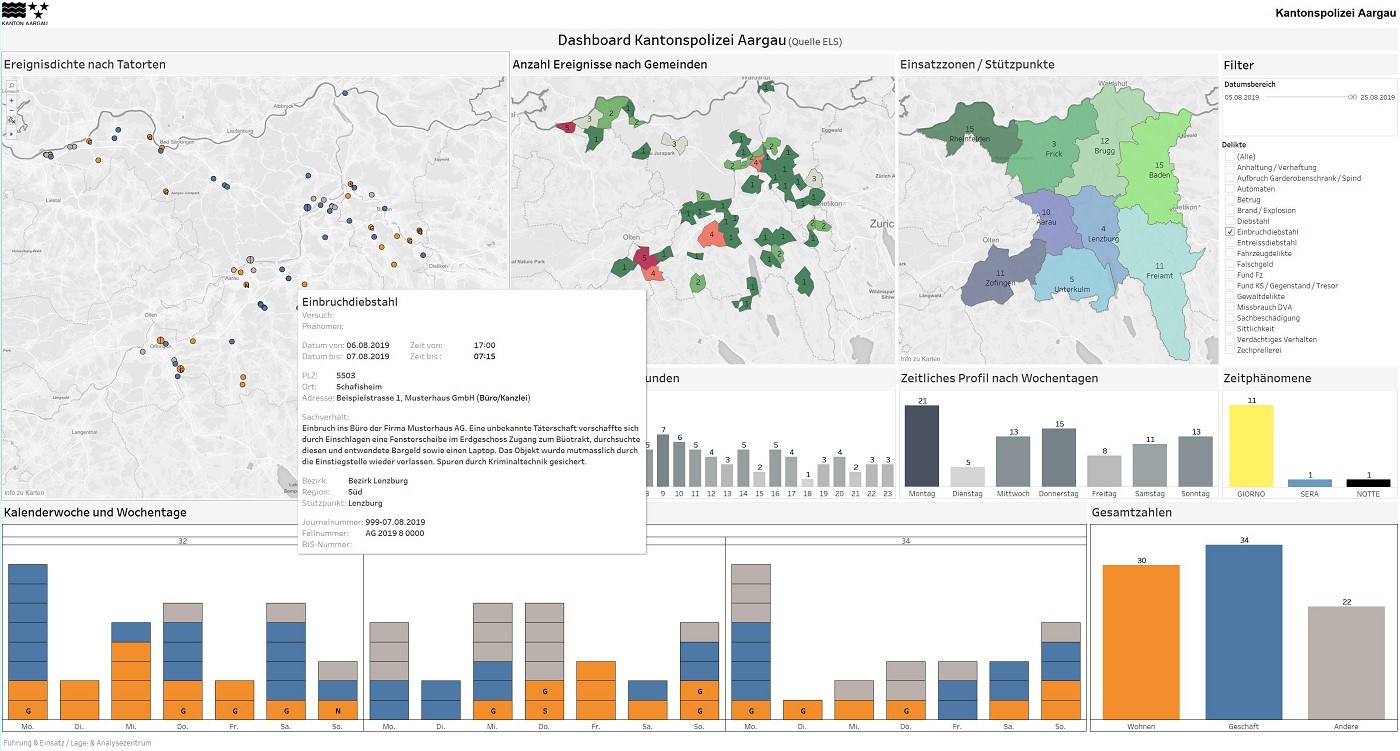
Once Tableau came to the attention of Somaini, he and his team created interactive dashboards based on maps which colleagues from the entire canton could use to get a quick picture of the situation in their region, and analyse all historical incidents from 1 January 2014 onwards to investigate serial offences and to optimise regional planning for operations of motorised patrols. These new Tableau analyses empower Aargau Cantonal Police to move into the areas of predictive policing and real-time policing.
A Rapid Overview Thanks to Geocoded Situational Pictures with a Click of the Mouse
In the Aargau Cantonal Police’s police system, all relevant incidents in the canton will be recorded with plenty of detailed data and features, such as the type of offence, the time, the address, the involved individuals, the tools and weapons used, and the amount of damage. The digital records go back to 1 January 2014, and serve both ongoing investigations and police reporting. Using this system at roll call, all police forces receive complete information about recent incidents in their operational area.
“Unfortunately, reports from the police system are rather tabular and not particularly well structured,” comments Angelo Somaini, crime analyst in Aargau Cantonal Police's Situation and Analysis Centre of the Central Department for Command & Deployment. In the past, police reporting mainly consisted of Excel tables which were exported from the police system, edited manually, embedded in PowerPoint presentations and then sent out. It took a lot of manual effort to create maps which showed the locations of reported incidents.
These insights make it a lot easier to determine the most efficient areas of operation for police units on patrol. This means that the police force is on location quicker when things happen and are often able to prevent escalation.
“I was made aware of this visualisation solution when I spoke to interns from the University of Lausanne who knew Tableau from their coursework,” says Angelo Somaini. “Our department purchased a Tableau desktop licence, and during a quiet spell of work, I was able to develop the first Tableau Dashboards with geocoded representations of incidents from the police system.”
Today, thanks to Tableau, all incidents since the beginning of 2014 can be viewed and analysed. “Twice a day we import the current data from the police system, which enables us to create mostly current situational reports at any time,” explains Angelo Somaini. “Our colleagues can use filters to choose which region, type of incident, days and times, etc. they want to view, and will immediately receive the desired status report.”
Within a short period of time, the new Tableau Dashboards turned into the central information tool for the whole Aargau Cantonal Police. “Even our police commander states that he relies on our analyses to get a quick overview on a daily basis.”
Our focus is clearly geocoding. It immediately shows connections which may not be revealed otherwise.
And even general police reporting has been considerably simplified and improved upon with Tableau. “On the one hand, the number of report requests from our regional offices has declined abruptly, because the new tool empowers them to cover their own data needs on-site,” explains Angelo Somaini. “On the other hand, we receive many requests from colleagues to create reports on particular topics, for example, developments on burglaries or traffic offences in different areas and the time scale. Even there, Tableau makes our work much easier and we were able to improve the quality of the analyses.”
Unfortunately, even though Tableau saves a lot of work, it did not lead to a reduction of the workload in the Situation and Analysis Centre. On the contrary: “The new options have led to an enormous increase in information requirements. Therefore, in the meantime, 11 members of our team have a Tableau desktop licence to cope with the whole load.”
More Efficient Planning of Operations via Visualization of Traffic and Crime Hot Spots
Marking of certain addresses, streets or areas in a Tableau Dashboard which, for example, show regular traffic offences or domestic violence at certain times of the night or day, enables the operational forces to see immediately, when and where the focus areas are. “These insights make it a lot easier to determine the most efficient areas of operation for police units on patrol,” explains Angelo Somaini. “This means that the police force is on location quicker when things happen and are often able to prevent escalation.”
With the application of Tableau, the Aargau Cantonal Police has seen an improvement in data-based decision making in particular . Angelo Somaini reports: “In the past police, officers often had to rely on intuition in investigations. For example, when they had a suspicion that the number of burglaries had risen in a certain neighbourhood and they then intended to deploy more patrols there. Today, a Dashboard analysis is enough to assess the real development of different offences in certain regions within minutes, and to focus on the most pressing sectors.”
In the past, police officers often had to rely on intuition in investigations. Today a Dashboard analysis is enough to assess the real development of different offences in certain regions within minutes.
Visual Analysis of Serial Crime Enables Prognoses of Future Crimes
Tableau proves exceedingly useful even when investigating serial crimes and prognoses of possible future crimes. “The interactive Dashboards allow us to narrow in on similar crimes through filters and to ascribe them to the same group of suspects, for example, in cases when the method or tools used by the perpetrators are similar in a region or time frame,” explains Angelo Somaini. “This enables us to identify serial offenders more easily and to make possible conclusions about typical areas of operations, or the date and time of the offence to make a probable prognosis of future offences so that we are better prepared. In this way, Tableau enables us to enter the era of predictive policing.”
The more insights Tableau analyses deliver for Aargau Cantonal Police, the bigger the demand gets. “Our focus is clearly geocoding. It immediately shows connections which may not be revealed otherwise,” reports Angelo Somaini. “For the future, I wish we had even better maps, and the option to show or hide more layers, as desired.”
In the future, Angelo Somaini’s speculates that Tableau will be integrated more in active investigations. For example, it is probable that data sources will be added to receive more clues about perpetrators more quickly. “Imagine that rapists, thieves or bank robbers pass existing surveillance cameras on their escape route. If we could layer their respective positions and recording angles on a complete map of all existing cameras, we’d have a good chance to very quickly receive usable picture data of persons and vehicles and use those for the manhunt. But there sure still is a long way to go for genuine real-time policing…”