How Tableau’s CRO Uses Tableau Pulse


In the fast-paced realm of Sales & Revenue Operations, swift, informed decision making is essential for staying competitive. Access to timely, accurate data isn't just a convenience—it's a necessity.
At Tableau, we are avid users of our own products. For years, we've been using Tableau to run our business and make informed decisions. And now, I’m even more excited by the value that's been unlocked by Tableau Pulse, which uses AI to unlock the full potential of all my data, putting tailored insights right at my fingertips to help fuel Tableau’s growth.
Tableau Pulse powers our Sales & Revenue strategy
As CRO, I oversee a wide array of teams, from Sales to Solution Engineering to our Partner business, each with their specific goals and KPIs that align with Tableau's overarching revenue targets. My focus is on ensuring we consistently meet our sales and revenue benchmarks such as Annual Contract Value (ACV), Open Pipeline, and Pipeline Generation. By just simply subscribing to these metrics in Tableau Pulse, I’m able to keep an eye on the entire organization and how they’re performing against our goals.
Setting up metrics in Tableau Pulse can be done in a matter of minutes by anyone—myself, a data strategy team member, or other team members in our group. It’s so simple. While I keep tabs on the entire organization, my sales leaders and reps just want to see and focus on their numbers. They can easily set up new Pulse metrics to follow, and within seconds, it’s reflected on their Pulse dashboard. Best of all, once a metric is set up–all the graphics, text descriptions, and visual insights–are auto-generated.
Quick tip: I like to tweak existing metrics to suit my specific data needs. For example, I recently created a new metric to monitor the Tableau Pulse conversations generated by our field teams. I did this by pointing to an existing metric from a Tableau dashboard. Our goal is to achieve 100K Pulse conversations in two months. Thanks to this customized Pulse metric, tracking conversations and acknowledging standout efforts of team members has never been easier with this exciting new innovation.
Infuse personalized data into the flow of work
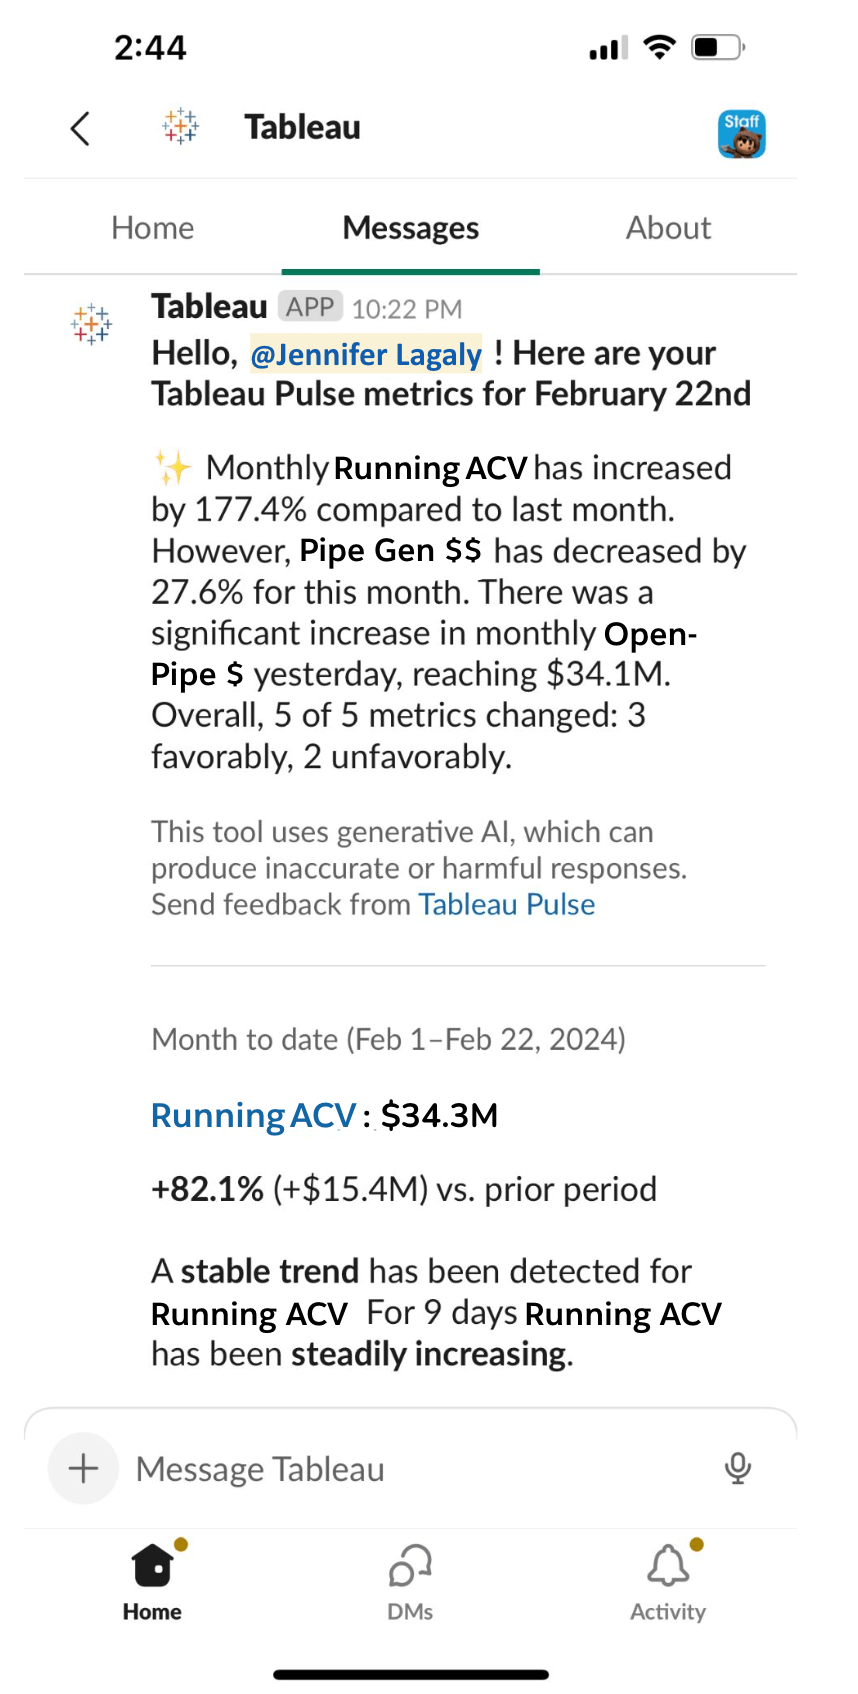
Tableau Pulse seamlessly infuses my data into the applications that are already part of my daily routine, like Slack or email. I can monitor key insights and metrics effortlessly, without having to navigate away from my current tasks or log in to another platform.
Each morning, I start my day in Slack catching up on my Pulse Digest, which has the latest information on how my metrics are performing, new trends, and top insights. If I want more context, I can click into any metric from Slack and open up the detailed view in Pulse with one click.
Decipher trends with smart revenue metrics
Monitoring key metrics is more than just watching numbers fluctuate. It's about uncovering hidden opportunities for growth, addressing potential challenges, and pinpointing positive trends to replicate across the business. This is where Tableau Pulse shines, providing clear, AI-generated summaries of my vital metrics like ACV, Open Pipeline, and Pipeline Generation. The best part is that Pulse data is live, meaning any time a metric changes, it’s automatically reflected in Pulse in real time.
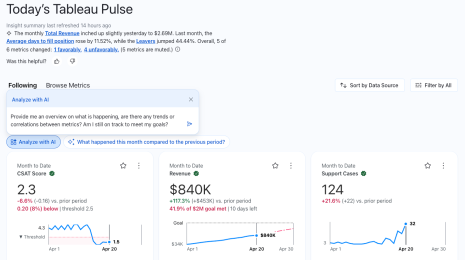
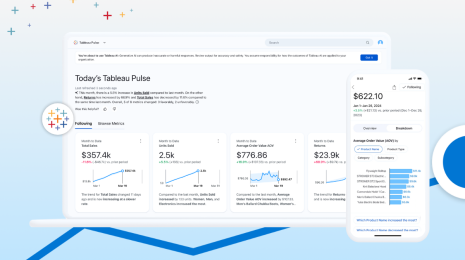
Once I follow a metric in Pulse, it immediately appears in my Pulse feed. Each metric has intuitive visualizations that compare current performance with past performance, and concise natural language summaries of trends and insights. All of this information is auto-generated for me, helping me quickly identify areas of the business that might need a closer look.
For example, in the figure above, I can see Pipe Gen for the quarter is up 10.9% year over year (YoY). Top insights tell me that this trend began to change three weeks ago and the rate of increase has since slowed. From there, I click into my Pipe Gen metric, unravel the problem and quickly craft a plan of action to ensure we continue to grow our pipe gen, despite the recent slowdown.
And because I can access Pulse on-the go from Tableau Mobile, all of these AI-powered insights are available at my fingertips wherever I am.
Delve into business segment performance
Tableau Pulse's ability to break down and analyze the performance of different business segments is invaluable. It offers insights into the health and potential of various areas within Tableau, highlighting strategic opportunities for growth. With just one click, I get deeper insights into revenue trends, including when the trend started, its trajectory, and the performance of different teams across the company.
This level of detail—viewing sales and revenue metrics by team, or seamlessly filtering my data by segment, deal band, product, and more—used to require extensive manual labor. Now, Tableau Pulse makes it so I can effortlessly assess each team's performance and how they align with Tableau's high-level goals.
Ask contextually relevant, data-driven questions
Tableau Pulse does more than filter metrics: It’s powered by AI and helps me actively understand sales and revenue trends more deeply, by suggesting relevant questions and giving me answers in plain language. And I have the ability to ask Tableau Pulse questions for myself.
Whether it's identifying which deal size, industry, or sales leader is increasing or decreasing in certain areas, Pulse equips me with the knowledge to take targeted action, adjust sales efforts, or focus on high-potential segments to boost sales and revenue growth.
Foster a data-driven culture across Tableau
Tableau is built on the principle of data democratization. Tableau Pulse brings this principle to life by being accessible to every team member regardless of their level of analytics expertise, allowing me to share key metrics and discoveries directly through tools we already use, like Slack. This ensures that up-to-the-minute critical information is always accessible, reinforcing a culture of informed decision-making.
Tableau Pulse has revolutionized how we approach strategic decision making by putting smart, personalized, and contextually relevant insights directly in our flow of work. It empowers every member of Tableau to contribute meaningfully toward achieving our sales revenue objectives. With Tableau Pulse, we're not just managing data: We're living a data-driven culture, ready to meet the dynamic challenges of global sales and revenue management head-on.
Want to learn more? Watch the demo to see how Tableau Pulse powered by Tableau AI comes to life, and start your free Tableau Pulse trial today.
Related stories
Conversational AI Anyone Can Use, Answers Everyone Can Trust with Tableau Agent in Pulse
 24 June, 2026
Top New Tableau Pulse Feature Releases to Know
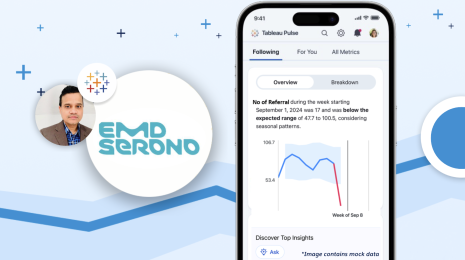
How EMD Serono is improving patient care with personalized, AI-powered insights from Tableau
 30 September, 2024