Hands on activity brings girls into the world of data


Being a pre-teen girl is hard. Between the ages of 9 and 14, girls tend to experience a drop in confidence, along with a diminished interest in pursuing challenging fields like science, technology, engineering and math (STEM). See this report from the AAUW.
Organizations are trying to plug this leak in the STEM pipeline by giving girls engaging ways to interact with STEM early, so that when they are registering for high school courses or picking a college major, they have positive associations with STEM subjects. That sounds like a ton of work, but a series of singular positive experiences can be significant in shaping the confidence of young girls.
One organization seeking to close this gap is Techbridge Girls, whose mission is to provide afterschool STEM programs to girls-of-color from low income families.
At Tableau, we were fortunate to recently partner with Techbridge Girls. Two classrooms of fifth and sixth grade girls visited our campus to get their hands on data and learn more about careers in technology.
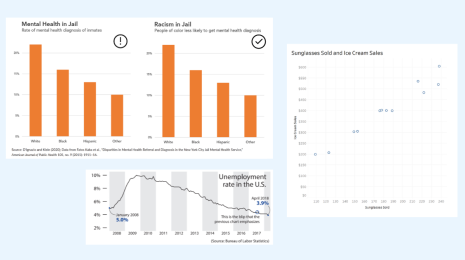
Highlights for the girls included making a living scatter plot in our courtyard to experience the intricacies of data, and indulging in our snack kitchen (hello jellybeans!).
Highlights for me were having the girls work through a hands on activity to let them try Tableau and discover firsthand the importance of visualizing data. And if we have done our work right, everyone goes home with a really positive data analysis experience.
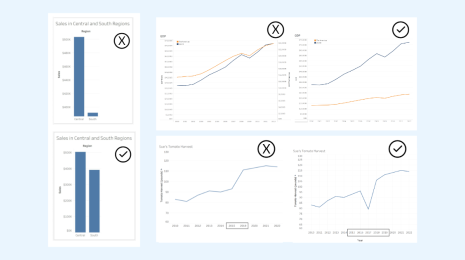
See their work for yourself! Every pair ended up with something really different. Some girls used bubble charts to show off each specific category, some girls used calculations to highlight trends, some girls got serious about labels.

While we can’t host every fifth grader onsite, any fifth grader can work with data. In classrooms across the country, fifth graders work to meet the Common Core math standard to represent and interpret data. You can help youth bolster these skills in your own homes and programs by using the same activity that Techbridge Girls completed during their visit to Tableau.
Snag the lesson plan
Activity Objective: Students will modify existing graphs using Tableau to better visualize a set of data.
Time: 1 hour
Materials:
- Tableau Desktop for students or teachers, or Tableau Public (we used Tableau Public for this)
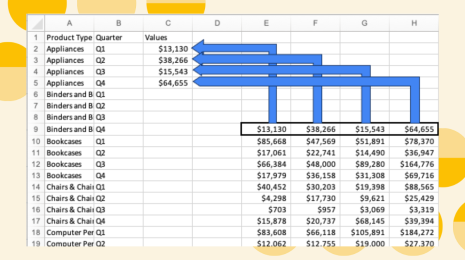
- This starter workbook
- A Tableau Public account to publish your results.
- A PDF instructional guide.
- Optional: An adult to help with the exploration, or just to lavish admiration and encouragement.
Steps:
- I introduced girls to Tableau software with a short demo. I showed the girls how to build a pie chart, a line graph, and a bar chart. This was all the experience they had before diving in.
- We had them partner up with another student and a mentor to try to improve the graphs in the starter workbook.
- They worked for about 30 minutes using the guiding questions to focus their exploration, then published their views up to Tableau Public. Each pair discussed what they enjoyed along with any challenges they encountered in the process.
A couple of notes:
- I opted to use a starter workbook so I didn’t have to walk kids through connecting to data, or data clean up. I did all that before they started so they could dive right into the data analysis.
- I built out a couple views to give the kids some sense of what was in there, but intentionally gave them room to explore how a story can change as a visualization changes.
- Finally, since we were hosting a field trip, I didn’t create a solution file because I didn’t want to drive the girls to one right answer. If you want to grade the assignment, you could alter the workbook to drive students towards a specific solution.
Of course, this is just an outline. But I happen to think that any kid (no matter their grade or gender) will get a lot out of this activity, and it is easy to swap out my starter file for another data source that would be interesting for your kids to explore. Feel free to adapt to what makes sense for your group of kids—and most importantly, have fun with it!
Related stories
Learn the Basics of Well-Structured Data
 6 December, 2024
How To Spot Misleading Charts: Review the Message
 24 October, 2024
How To Spot Misleading Charts: Check the Axes
17 October, 2024