Building a Winning Fantasy-Football Team with Tableau


Note: The following is a guest post by Tableau enthusiast Curtis Harris.
In 2015, I won my first fantasy-football title in a long-running, highly-competitive league.
Last year’s title was due in large part to a data-driven drafting model and heavy use of Tableau to explore the data. This process, although successful, involved hours of data collection and resulted in outputs that wouldn’t scale to a greater population. With those challenges in mind, I wanted to do a few things differently in 2016:
- Automate the data collection process using Python
- Simplify the drafting model without sacrificing the advanced analysis
- Publish a customizable dashboard that scales to a wide population of fantasy football leagues and players
If I could give a single suggestion for anyone wanting to work with sports data without hours of copying and pasting, it would be to learn Python.
Many of my Tableau Public dashboards started with retrieving data from the web with Python. This may sound intimidating at first, but trust me when I say there are plenty of resources available to help you get started. Do yourself a favor and download Anaconda, which is an open data-science platform powered by Python.
Now, back to fantasy football! My drafting model relies heavily on consistency metrics, which rely heavily on the data more granular than season-long totals.
Like many others, I’ve found that the key to winning in fantasy football is having a team that consistently performs at a high level. You may take a large loss here or there to high-variance teams, but making the playoffs will be a simple task if your team can consistently score above-average point totals every week.
Last year I gave myself an arduous task of manually collecting and organizing game logs for every offensive player. Suffice it to say I really didn’t want to spend hours doing this exercise again. After only a few minutes of searching, I found an NFL data API built for Python named nflgame. Quickly scanning examples and documentation led me to write this code:
import nflgame

import csv

import os

#Define a list for every week in the NFL regular season

weeks = [1,2,3,4,5,6,7,8,9,10,11,12,13,14,15,16,17]

#For every week in the weeks list, grab the player game logs and create a csv file for each week

for week in weeks:

    nflgame.combine(nflgame.games(2015, week=week)).csv(str(week)+'.csv')

#The previous function created an empty row between each row of data. The function below brings back in every csv, removes the empty rows, and creates new csv files
for week in weeks:
input = open(str(week)+'.csv', 'rb')
output = open('Week'+str(week)+'.csv', 'wb')
writer = csv.writer(output)
for row in csv.reader(input):
if row:
writer.writerow(row)
input.close()
output.close()
#Delete unused csv files
for week in weeks:
os.remove(str(week)+'.csv')
Now that we have our data sorted out, we can use Tableau’s Union feature to combine all 17 of our csv files into a single data source. First goal accomplished—data collection is now almost entirely automated and will scale from year to year.
Simplification and scalability were my top concerns with this project. In previous years, I had to bounce back and forth between five to 10 different worksheets and dashboards, all of which would only make sense to myself. In order for the draft model to scale, the application needed to be simple to use and have a minimal amount of views that covered a wide range of analyses.
To design for simplicity means to design for commonality. As data-vizzers, we need to focus our user interface and user experience in a way that the greater population already understands.
With that in mind, I decided to develop this application using a collapsible-menu system that we see in many mobile apps. This method was originally surfaced by Robert Rouse on the InterWorks blog, and was recently extended to a template style by Josh Tapley.
Using the collapsible menu gave me expanded real estate for data visualization, and produced an interface that most are used to. The menu allows fantasy players to set scoring thresholds, avoid specific teams, and keep on top of the draft by crossing off players that have been drafted.

So how did I use these methods to claim fantasy glory? As stated earlier, I believe the key to winning fantasy football is having a team that consistently performs at a high level. The visualizations in this dashboard focus on that theory.

Looking at the core of my offense, one can see that I focused on players with a low coefficient of variation. This is a measure of a player's season-long consistency. It’s also the reason why we don’t need to see trend charts in this dashboard.
By focusing on players with low variation and high points per game, I was able to glide into the playoffs and beat out my higher-ranked opponents who had high-variance players on their rosters.
This dashboard will also assist in recognizing value early in the draft where others focus on high-cost, high-variance players. By default, the bar chart is configured to rank players based on the consistency metrics discussed in the previous paragraph. Let’s take a look at wide receivers, for example:
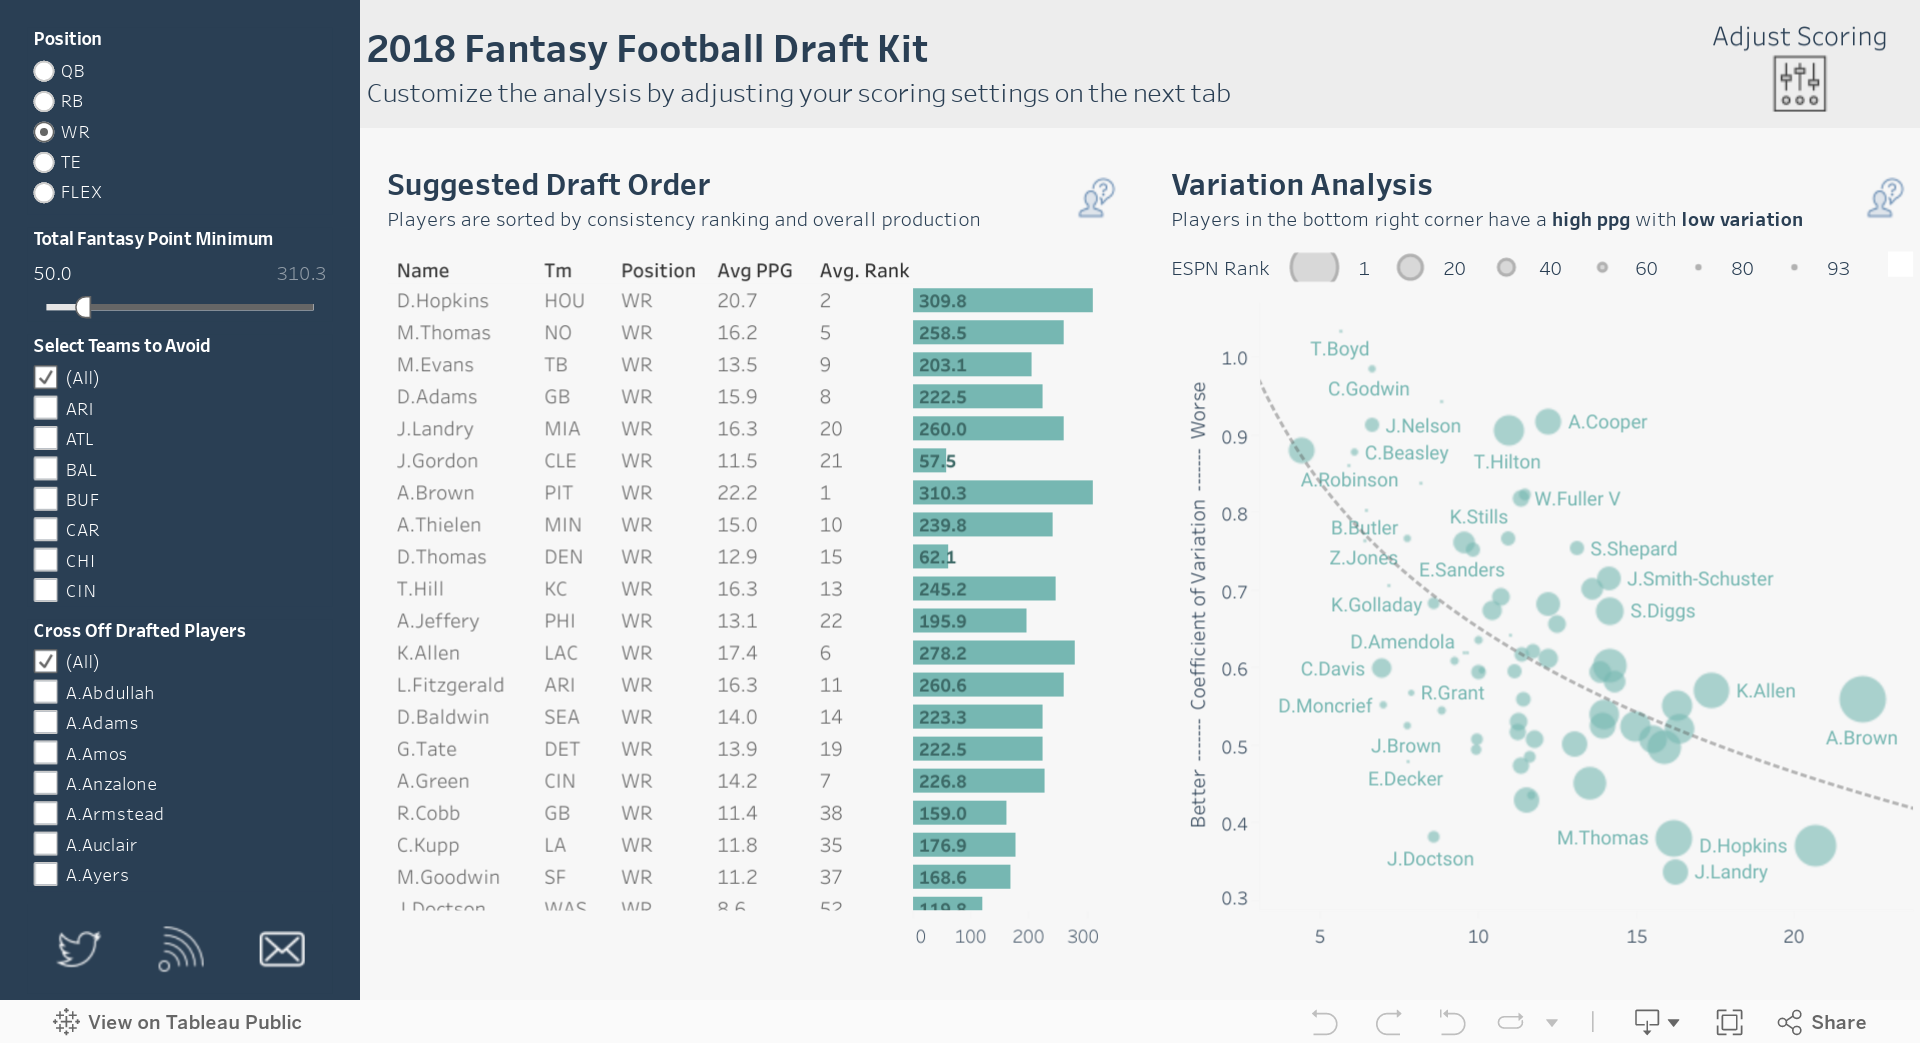
Antonio Brown was the top receiver in most scoring formats, and he will likely be a top three draft pick in most leagues. I wouldn’t fault anyone for taking Brown with the top pick, but if you end up near the end of your draft order, consider Brandon Marshall.
Marshall was one of the most consistent wide receivers last year and also carried a high point-per-game average. He is also currently ranked #19 by industry experts, but one could argue that he is the top option at wide receiver.
Let’s take a look at the same chart if we take touchdown receptions out of the equation. Navigate to the Scoring Settings tab and move the Touchdown Receptions slider to 1. The analysis will now refactor and provide us with a different ranking. The ranking is now based on volume and yardage, instead of favoring touchdown-heavy receivers.

Marshall is now our second-ranked receiver, and we see that Julio Jones has moved to the top. If Jones converted only a handful more touchdowns in 2015, he would have easily been the top ranked receiver, and definitely deserves a top three draft pick with Brown.
Hopefully this dashboard proves to be a valuable tool in your upcoming draft. Remember, slow and steady wins the race. Drafting for consistency will help you have a successful and fun fantasy-football season!
Got a sports viz of your own? Share it in the comments below or tweet it to us using the hashtag #OlympicsViz.
Related stories

Iron Viz 2026: Read Between the Data
 28 May, 2026

Tableau's Iron Viz Winners

Explore the 2026 Iron Viz Entries
 15 December, 2025