All stories
 Data
DataAllergan Sees Healthy ROI with Tableau
 6 January, 2014
Allergan, a multi-specialty healthcare company with operations around the globe, employs more than 11,000 people worldwide. Joe Madigan is the Director of Customer Services in the EMEA region—Europe, the Middle East, and Asia. With so much ground to cover, he’s got a lot of data. In 2009, each of the 12 customer service sites in the EMEA region was using its own contact center technology—which caused data inefficiencies. In this interview, Madigan explains how his team went from 1 Tableau Desktop license to 20—and how that fostered a healthy environment for data and finances.
6 January, 2014
Allergan, a multi-specialty healthcare company with operations around the globe, employs more than 11,000 people worldwide. Joe Madigan is the Director of Customer Services in the EMEA region—Europe, the Middle East, and Asia. With so much ground to cover, he’s got a lot of data. In 2009, each of the 12 customer service sites in the EMEA region was using its own contact center technology—which caused data inefficiencies. In this interview, Madigan explains how his team went from 1 Tableau Desktop license to 20—and how that fostered a healthy environment for data and finances. Best of Tableau Web
Best of the Tableau Web: October 2013
 5 November, 2013
A highlight of tips, tricks, and inspiration for Tableau and data visualization.
 Product
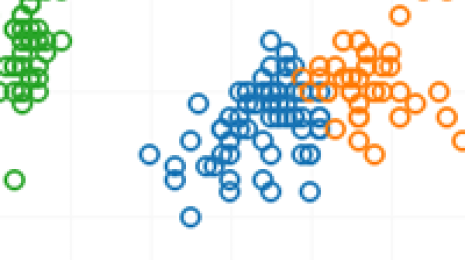
Tableau 8.1 and R
In this 2nd in a series of posts about the upcoming 8.1 release, I get to introduce one of the most exciting new features in Tableau 8.1: R integration. R has been a very popular language among statisticians but in the past few years, it has become the language of choice for a much broader group of data enthusiasts.-
Best of Tableau Web
Best of the Tableau Web: September 2013
7 October, 2013
A highlight of tips, tricks, and inspiration for Tableau and data visualization.
 Data
DataTableau 8.1: Sophisticated Analytics for Sophisticated People
 26 September, 2013
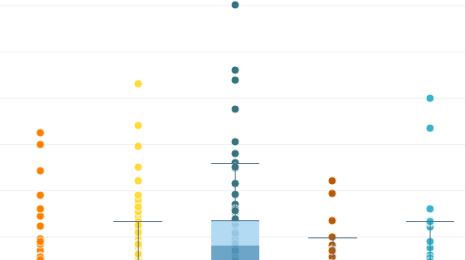
This is the first in a series of blog posts on the Tableau 8.1 release. With every release we try to provide features that help people answer more questions. Tableau 8.1 is now in beta with a host of new analytical capabilities, from boxplots to one-click percentiles and ranking.
26 September, 2013
This is the first in a series of blog posts on the Tableau 8.1 release. With every release we try to provide features that help people answer more questions. Tableau 8.1 is now in beta with a host of new analytical capabilities, from boxplots to one-click percentiles and ranking. Product
Easy empty local extracts
25 September, 2013'Easy Empty Extracts' Sounds like a kids' tongue-twister. But it's actually a hot Tableau tip, courtesy of our very own Ryan Stryker, Sr Business Consultant, Tableau Professional Services. Thanks, Ryan! Extracts are not a hard sell; the performance gains we see through the local materialisation of data views are usually staggering. And Tableau Server gives us a handy platform for auto-magically refreshing it all. For large extracts, though, it can be quite time-consuming to create a desktop version before publishing to the server. Understandably, customers often ask if there’s a way to “just have Server do it”. Of course there is.
-
Best of Tableau Web
Best of the Tableau Web: July 2013
31 July, 2013
A highlight of tips, tricks, and inspiration for Tableau and data visualization.
 Tableau Cloud
The power of Tableau, in the cloud
17 July, 2013
Ever wished you could easily share analytics with your colleagues? Ever wanted to collaborate on a dashboard with a customer or partner? Or wish you could access and work securely with data on your tablet, without having to VPN into your corporate network? But you couldn’t. Or you could, but didn’t want to download software or spin up an IT project. If so, then today is a big day. Today we’re announcing Tableau Online, a hosted version of Tableau Server in the cloud. It’s the fastest way to get up and running with a complete business intelligence platform. We take care of the infrastructure, you share analytics. It’s that easy.
-
Best of Tableau Web
Best of the Tableau Web: May-June 2013
18 June, 2013
A highlight of tips, tricks, and inspiration for Tableau and data visualization.
 Tableau Community
Meet Our Customer Speakers for TCC13! (Early bird discount expires Friday)
 30 May, 2013
If you don't have your ticket yet for the Tableau Customer Conference in Washington D.C., you're gonna want to pick it up before Friday, when the early bird discount expires. In addition to keynotes by Nate Silver, Charles Wheelan and Tableau's co-founders, we can finally announce some of the Tableau customers who will be speaking at TCC about how they use Tableau in their own companies. Alongside household names like LinkedIn and Wells Fargo, you'll have the chance to hear from small- and medium-sized companies and agencies, including AudienceAudit, Manpower Group and the Broad Institute. Read more for a full list of confirmed customer speakers.
30 May, 2013
If you don't have your ticket yet for the Tableau Customer Conference in Washington D.C., you're gonna want to pick it up before Friday, when the early bird discount expires. In addition to keynotes by Nate Silver, Charles Wheelan and Tableau's co-founders, we can finally announce some of the Tableau customers who will be speaking at TCC about how they use Tableau in their own companies. Alongside household names like LinkedIn and Wells Fargo, you'll have the chance to hear from small- and medium-sized companies and agencies, including AudienceAudit, Manpower Group and the Broad Institute. Read more for a full list of confirmed customer speakers. Visualizations
Tips & tricks: Alternatives to count distinct
 24 May, 2013
Distinct counts are critical to analytics, whether it's counting individual patients in a hospital, the number of unique retail transactions or the number of aeroplanes in a fleet. Taking distinct counts in Tableau is incredibly easy with a one-click way to change aggregations to count distinct. It is also, however, one of the more intensive calculations to perform and can be very slow, especially if your data's huge. I'd like to share a few alternative ways to get the same answer as a count distinct.
-
Best of Tableau Web
Best of the Tableau Web: April 2013
7 May, 2013
A highlight of tips, tricks, and inspiration for Tableau and data visualization.