Interactive, notebook-style analysis in Tableau for data science extensibility


Tableau's intuitive drag and drop interface is one of the key reasons it has become the de facto standard for data visualization. With its easy-to-use interface, not only analysts, but everyone can see and understand their data. But let's look at who mean when we say "everyone." Does this include sophisticated users like data scientists or statisticians? In short, yes, but their workflow is slightly different; they rely heavily on statistical and machine learning algorithms, usually only accessible from R, Python, or Matlab. To interact with these libraries, statisticians and data scientists have to write code, experiment with their model parameters, and visualize the results. The usual tool of choice for data scientists is some notebook environment—such as RStudio or Jupyter—where they can mix their code and the visualizations.
In the past, the number one reason for the lower adoption of Tableau for data scientists was the lack of support of this code-driven, iterative development methodology. However, with the Dashboard Extensions API and the Analytics Extensions API things have changed. The platform for everyone offers the best from code-driven data science and easy-to-use, drag-and-drop visualization worlds.
Tableau Python and R Integration
Analytical Extension presents the standard way to use Python, R, Matlab and other platforms' libraries and functions in Tableau workbooks. With standard SCRIPT Tableau functions, users can add their Python or R codes as Tableau calculated fields, opening up a whole new world in data enrichment and analysis.
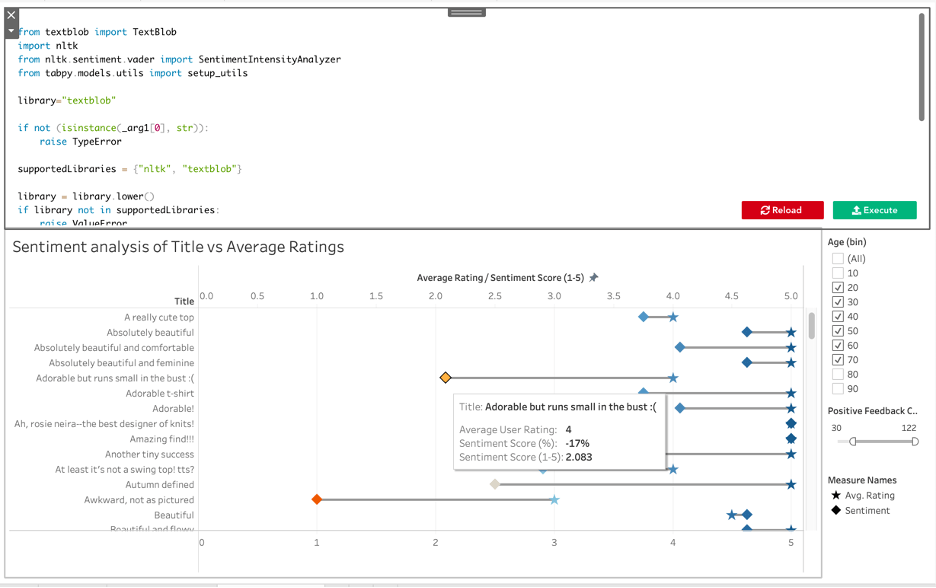
While it's a convenient way to use existing calculations, this is not the same iterative experience as a notebook. Here comes the Dashboard Extensions API to the rescue, providing the user experience to work with the code in a code editor—while seeing the results immediately as Tableau charts.
CodePad editor for Tableau
The Tableau Exchange was recently updated with a new extension that allows interaction with your code—just like you would have in a notebook. As you change the code in the code editor, Tableau executes it and recalculates the marks and updates the visualization before your very eyes.
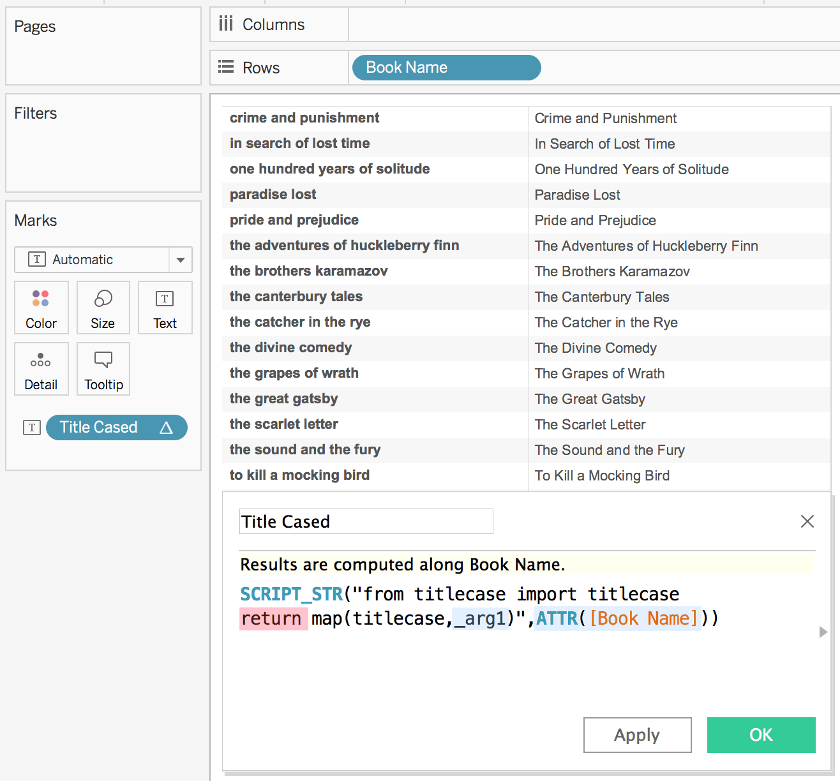
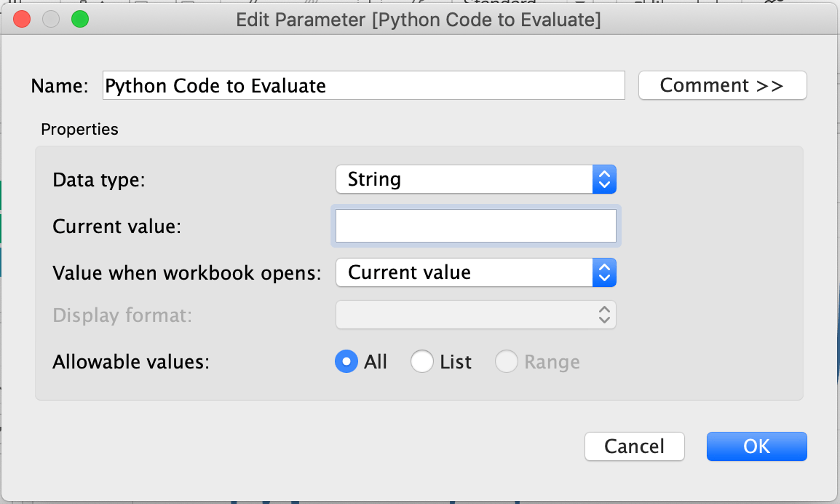
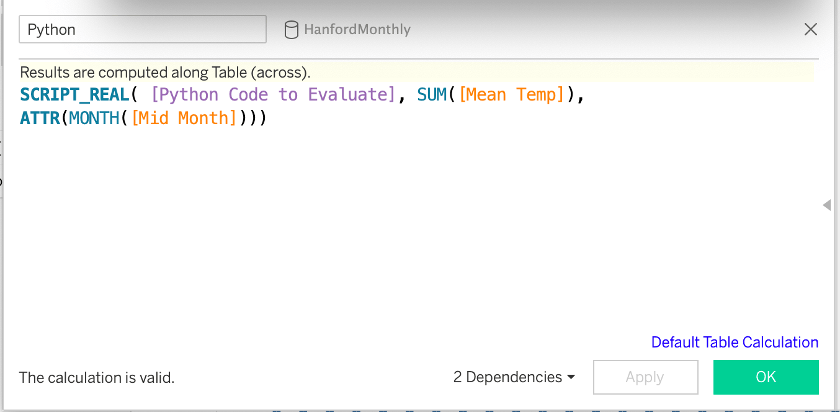
To use the extension, you need to create a string parameter and create a SCRIPT based calculated field with the relevant fields mapped as script parameters.
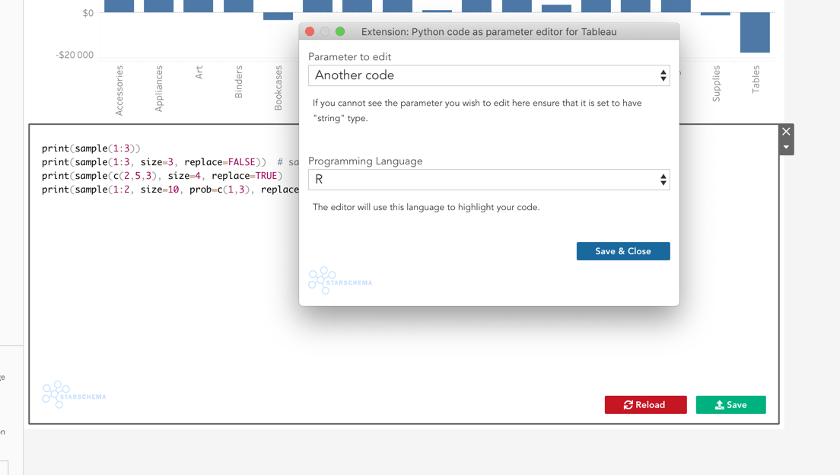
Then add the extension to your dashboard, select the previously created parameter, and choose the same programming language configured to what you have in the Analytics Extension API:
Now you can start building your views, adding to your machine learning models and use external APIs to enrich the data—all from the same platform. The best part is that you can reuse the same workbook to share the analysis with end users, which could potentially be placed on a different worksheet.
Sample workbook analysis in Tableau
To show some of real-life use cases, we put together an example workbook with three Python-based algorithms:
- Clustering - The clustering dashboard uses scikit learn’s DBSCAN algorithm to apply clustering to a set of points.
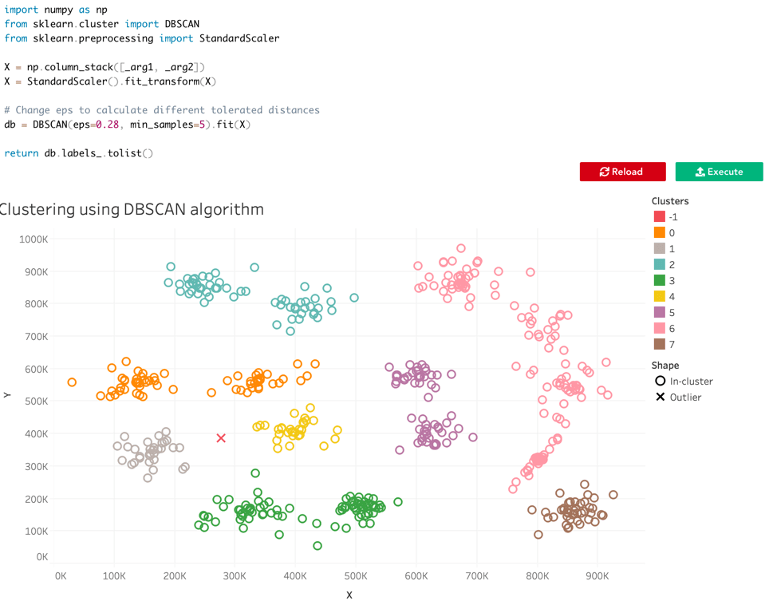
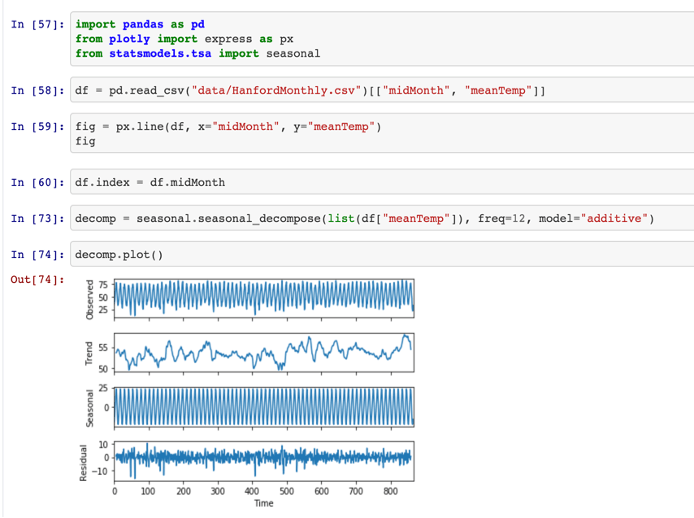
Figure 7: Clustering using DBSCAN algorithm - Seasonality Analysis – Use statsmodel’s seasonal_decompose to remove seasonality from time series data and show the pure trends.
- Sentiment Analysis – Compare the titles and ratings of product reviews with their sentiment scores.
Excited to try out this interactive, notebook-style analysis in Tableau? Download the demo workbook and add the extension to the dashboard.
If you want to learn more about the Dashboard Extensions and Analytics Extensions API, you can join the Tableau Developer program for additional resources and community interaction.
Related stories

Extend Access to Embedded Tableau Content with On-Demand Access
 22 July, 2026

The Tableau+ Bundle with Premium AI, Enterprise Capabilities, and Premier Success
 24 June, 2026

What is Tableau Prep?
 30 April, 2026