What is Iron Viz: Student Edition?


Iron Viz: Student Edition is a data visualization competition exclusively for students that follows a different theme every year.
How Iron Viz: Student Edition began
Tableau’s largest data visualization competition, Iron Viz, began based on the world-renowned Iron Chef cooking show during a Tableau Conference (TC) 2011 breakout session with a mere 300 people in attendance. Eleven years later, it has become a highly-anticipated, world-class keynote event. With the excitement around Iron Viz at TC, we wanted to create a space for students interested in developing their data skills through a fun and inclusive environment. And who doesn’t love some friendly competition? Iron Viz: Student Edition allows students to practice their Tableau skills and meet members of the Tableau Community before jumping into the larger Iron Viz competition.
Who can participate in Iron Viz: Student Edition?
Students of all skill levels can participate in Iron Viz: Student Edition as long as they’re currently enrolled at an accredited university. Whether you’re a new Tableau user or a data rockstar, you’re bound to gain new skills and inspiration in the process.
Iron Viz: Student Edition data set and themes
Our data sets have covered a range of topics, from weather to education to food-focused themes. This year’s data set is centered around TV shows, featuring a data set from IMDb in partnership with Data+TV. It is composed of TV data including information on actors, IMDb ratings, fan ratings, airing performance, and more.
Check out last year’s winning vizzes and all other past winners from previous Iron Viz: Student edition contests.
Iron Viz: Student Edition contest details
Students have 2 months starting from December 2nd to download and prep the data, then create a mind-blowing visualization published to Tableau Public.
Tableau Public launched in 2010 with the purpose of making data social and to ignite a new movement on the web. With an effort to offer a free online platform that anyone could use to explore, create, and publicly share data visualizations. By driving compelling conversations around data, Tableau Public making data online fun, useful, and beautiful.
Once a student’s viz is published on Tableau Public and submitted through the contest form, Tableau experts judge the entries based on four criteria and announce the top three winners.
Get started on this year’s competition and explore the Data+TV dataset by heading to the Iron Viz: Student Edition homepage.
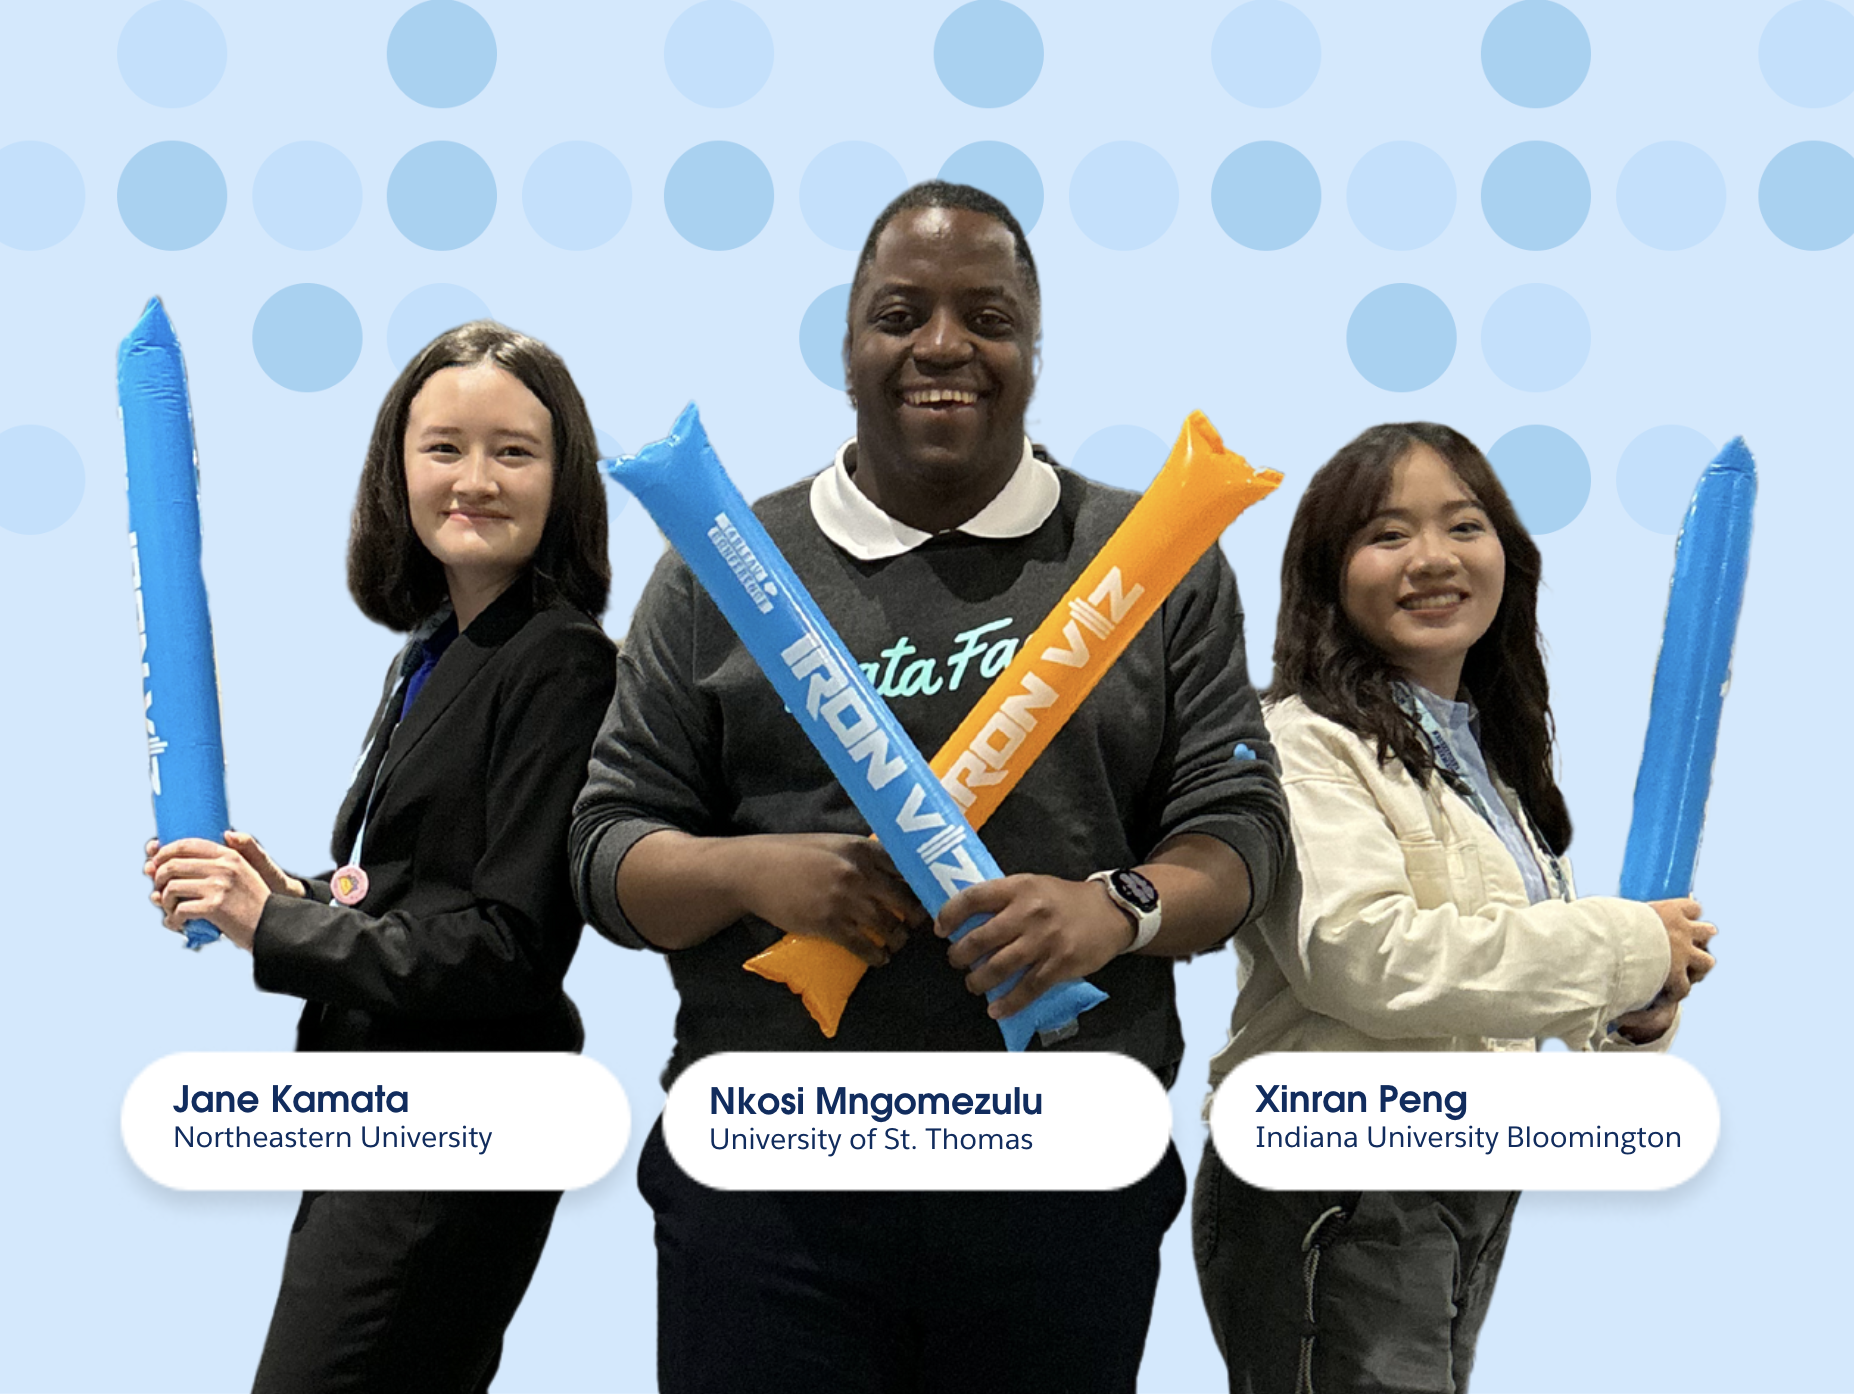
Iron Viz: Student Edition 2024 winners Jane Kamata, Nkosi Mngomezulu, and Xinran Peng
Judges and scoring
Our judges consist of Tableau experts from the Tableau Community and Tableau Partners. Judges will score vizzes based on the following criteria:
- Analytical Depth of the Data Set: Is the data used in a way to explore?
- Beauty and Design: Is the visualization beautiful, relevant, and effective?
- Storytelling: Is there a clear story being told or a question being explored, and is there appropriate context?
- Visualization Best Practices: Does the visualization utilize overall best practices, keeping in mind accessibility and ease of use?
Iron Viz: Student Edition 2024 winning visualizations, left to right: Data+Movies: Into the Spider-Verse by Xinran Peng, Studio Ghibli: Global Force in Animation by Jane Kamata, Data+Movies: Black Panther by Nkosi Mngomezulu
What is the prize for winning Iron Viz: Student Edition?
Now, the fun part! Any student who enters Iron Viz: Student Edition gets the chance to build their Tableau Public portfolio to increase their employability, learn something new, get inspired, and take their data skills to the next level with the support of the Tableau Community.
The top three scoring visualizations win a compensated trip to Tableau Conference, a $250 Tableau Store gift card, a Tableau certification voucher, and the opportunity to be recognized on a global stage at Iron Viz.
We also highlight the winning Iron Viz: Student Edition vizzes on Tableau Public.
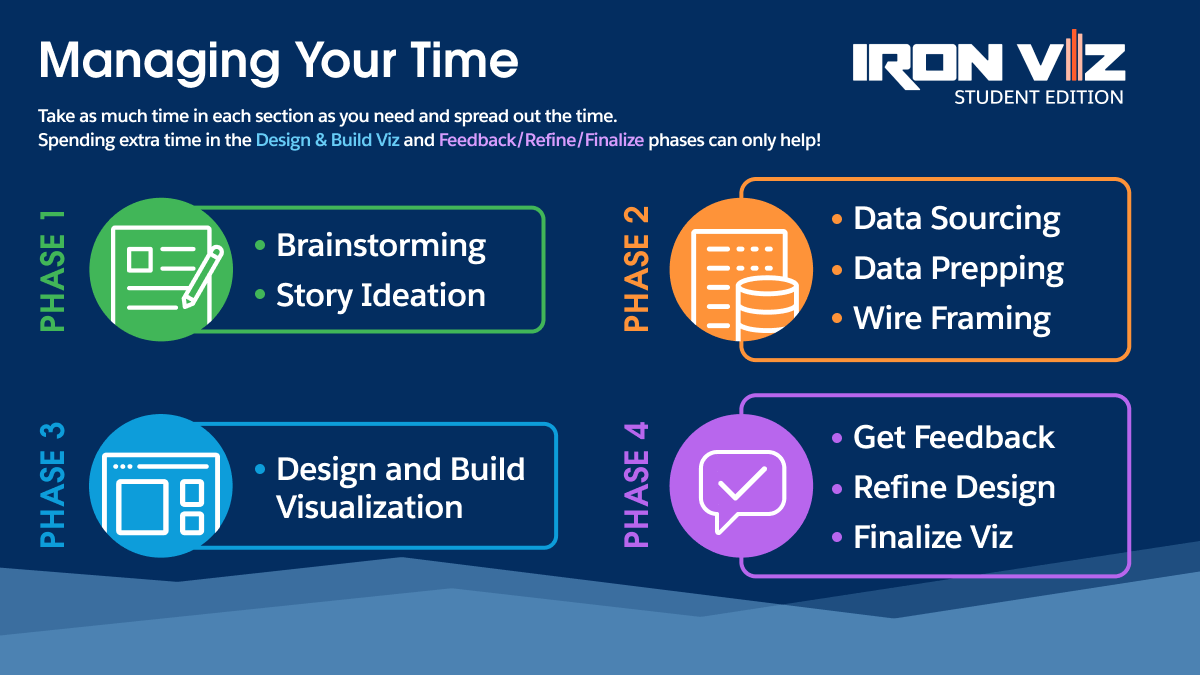
Tips for managing your time
With a full 2 months at your disposal, it might be difficult to plan out how to spend your time creating your viz entry. We’ve divided the viz-making process into four phases. We recommend you spend at least one week in each phase and dedicate a little extra time to the Design & Build and Refinement phases of the process. These phases will ensure you have given ample consideration to all parts of viz-creation to make your viz the best it can be!
Learn more
- Stay up to date on Iron Viz: Student Edition.
- Learn more about Tableau’s Academic Programs and resources for students and educators.
- Explore all of the past winning vizzes of Iron Viz: Student Edition.
- 3 data best practices to take your skills to the next level.
- Follow these hashtags to get support from the Tableau Community: #TableauTip #TableauFF #DataFam #GenData
Zugehörige Storys

Iron Viz 2026: Read Between the Data
 28 Mai, 2026
Top 10 Qualifiers for Iron Viz 2026
