DataFam Roundup: June 26 - 30, 2023


Welcome! Dig into this week's DataFam Roundup—a weekly blog that brings together community content all in one post. As always, we invite you to send us your content—and the DataFam content from your peers that have inspired you! Find the content submission form here.
Data Pride
#DataPride today, and every day. We’re almost halfway through Pride Month, and there are still plenty of ways to celebrate our diverse community. Join us!
Explore the Tableau Public Pride Viz Gallery which highlights visualizations that honor, recognize, and tell the stories and experiences of the LGBTQ+ community through data.
Watch the recording of our Data + Diversity event. We examined the intersection of data and human rights and celebrate our LGBTQ+ community.
Participate in a Tableau Community challenge:
- Back 2 Viz Basics has 2 recent data viz challenges in collaboration with the Data Pride Tableau User Group.
- Analyze the locations of the “YOU ARE LOVED” billboards through a map challenge. These billboards were first created by Rae Senarighi for FairWisconsin and GSafe, two Wisconsin organizations working for LGBTQ+ rights throughout the state. Today, they are spread across 300 locations.
- Build a table using Lambda Literary Awards Finalists & Winners. The Lambda Literary Awards, also known as the “Lammys,” are prestigious literary awards that recognize and celebrate outstanding works of literature that explore LGBTQ+ themes, experiences, and identities across various genres, including fiction, non-fiction, poetry, and more.
- Diversity in Data is visualizing LGBTQ+ representation in film this month using a number of smaller data sets which includes a breakdown of sex and ethnicity.
Add your pronouns to your Tableau Public profile: Make your Tableau Public profile shine by adding your pronouns.
Community Highlight
To recognize new and consistent Tableau contributors—we’re excited to have a section within the weekly DataFam Roundup called the Tableau Community Highlight. Find out how to get involved.

Mehras Abdoli, Data Scientist at Houston ISD
Texas, USA
Mehras Abdoli is a Data Scientist at the Houston Independent School District. He is a co-lead of #EduVizzers, a community project, and is active in the Austin, K-12, and Analytics Tableau User Groups.
Apart from his involvement in Tableau User Groups, Mehras also stays active in the community by participating in community projects such as #PreppinData and #Back2VizBasics, of which he has completed almost every challenge this year. He recently stepped into a role as co-lead of #EduVizzers, a monthly project that links real education data with real people. He enjoys the close knit community and sense of fulfillment he gets from being involved in a project where he can make a meaningful impact. Mehras also feels that working with education datasets significantly enhances his data skills through exposure to various types of analysis.
Mehras joined Twitter to follow along with the DataFam and had no intention of creating his own content but found that people around him were interested in what he had to say. He now generates content based on things he learned while studying for the Tableau Certification Exams and interesting findings from projects he works on.
As a Tableau user for only a year, Mehras has already published 140 vizzes on Tableau Public. He draws inspiration from the DataFam on Twitter and other content on Tableau Public.
Connect with Mehras on Linkedin, Twitter, and Tableau Public.
DataFam content
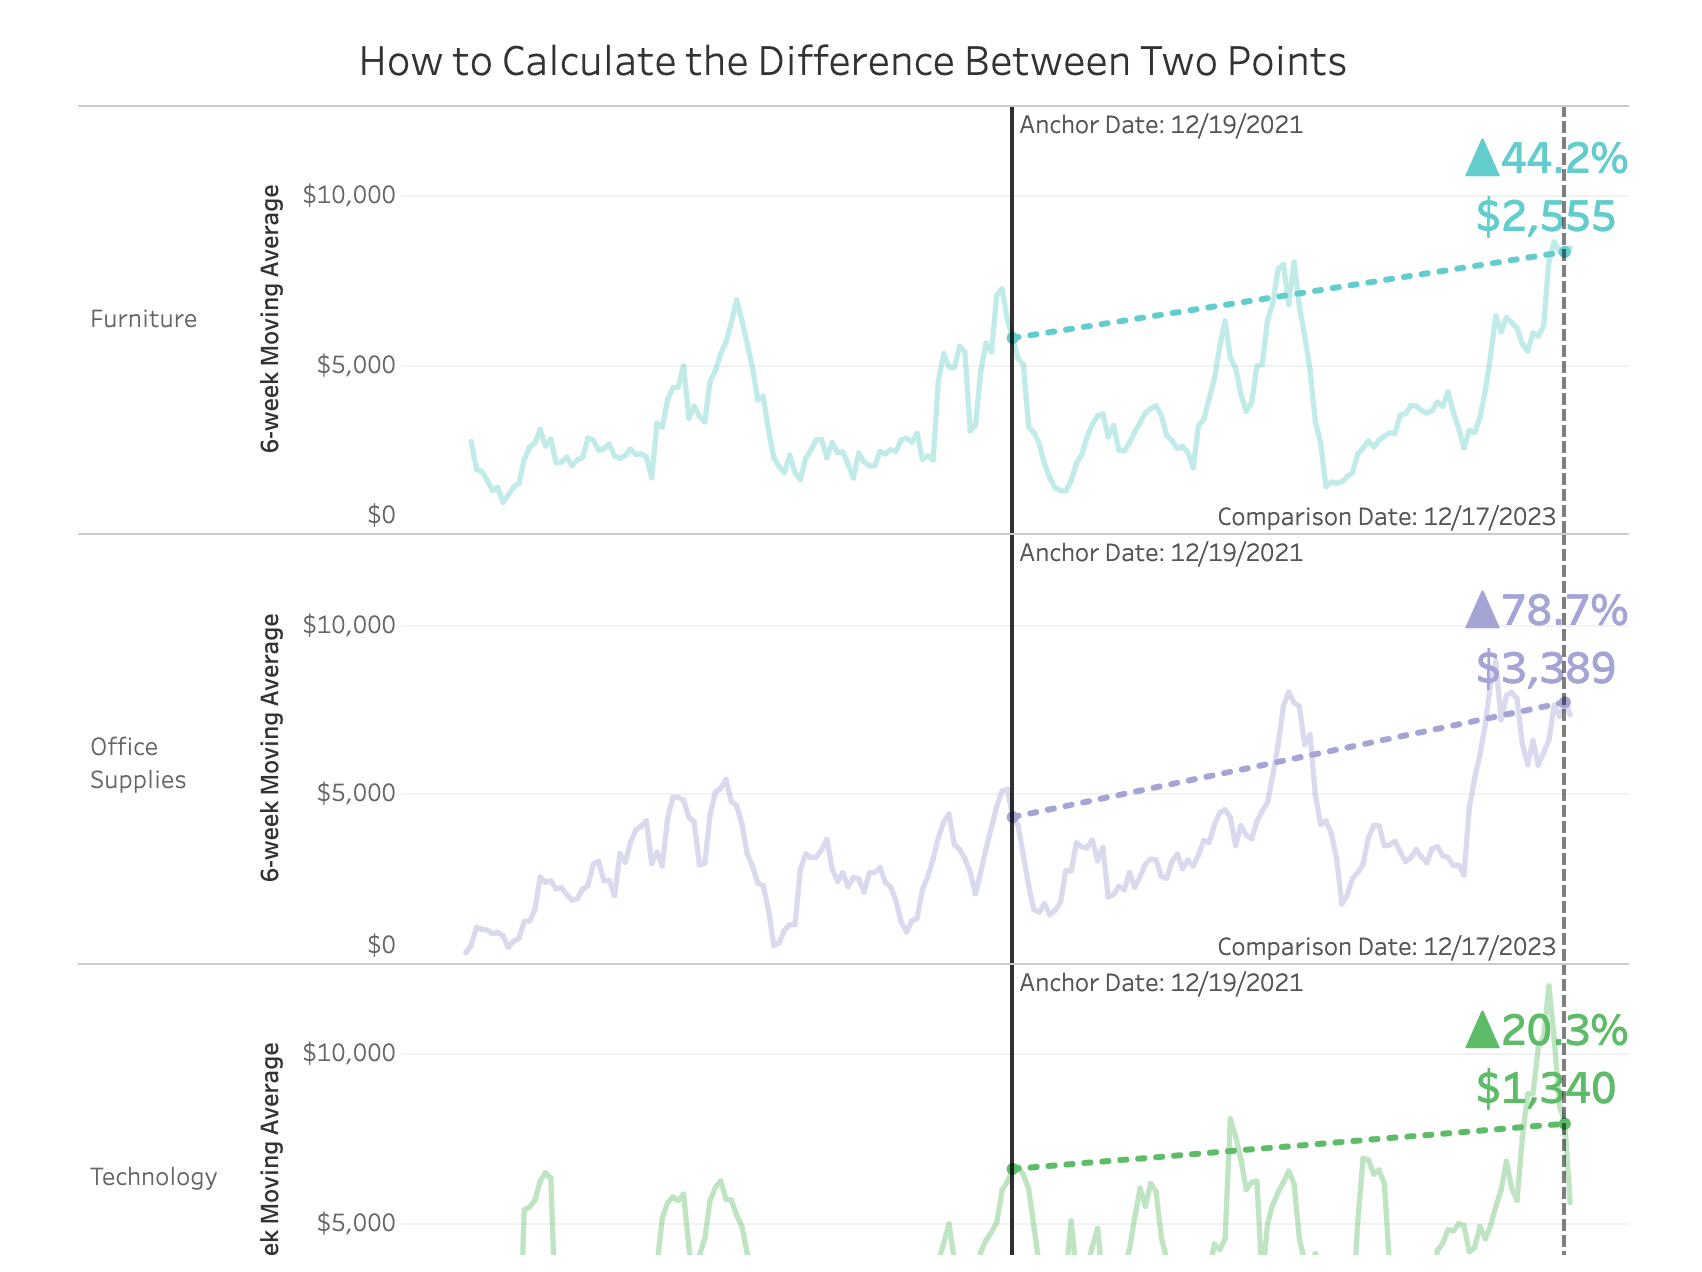
Sean Miller: How to Use Parameter Actions to Compare Two Points for Analysis
Dive into content created by the Tableau Community:
-
Steve Rawling, Pip Decks: How to present data with stories
-
Matt Chambers, Sirvizalot: Switch Between Small Multiples and Tile Maps in Tableau
-
Sean Miller: How to Use Parameter Actions to Compare Two Points for Analysis
-
Pratik Gupta: Tableau TSM Command Cheat Sheet: Essential Commands for Server Administration
-
Rafael Guevara Jr: Examining the Run Differential in Baseball
-
Deekshith Suryadevara: Mastering Tableau: 10 Essential Tips and Tricks for Effective Data Visualization
-
Zach Bowders, Data + Love: Schrödinger's Bear, Data Deving, and Career War Stories with Kyle Massey
-
The Data Leadership Collaborative: AI + the Data Renaissance
-
Sean Miller: Tableau #WOW2023 Livestream | Week 26 | Arctic Ice Extent
-
Jacqui Moore: #TinyTableauTip
Team Tableau
-
2023 Tableau Ambassador nominations and applications are open
-
Celebrate diversity by adding pronouns to your Tableau Public profile
Upcoming events and community participation
-
Michelle Frayman, Zak Geis and Nicole Klassen: Viz Feedback Office Hours
-
Data Book Club: This spring we'll be reading Avoiding Data Pitfalls: How to Steer Clear of Common Blunders When Working with Data and Presenting Analysis and Visualizations by Ben Jones.
-
TrailblazerDX ’23 Tableau Quest: Leverage the power of data with the world’s leading analytics platform to drive better business decisions.
-
Community Calendar and Upcoming Events: stay up-to-date on the latest Women in Dataviz events and other data visualization-related events. If you'd like to submit an event to the calendar, please fill out this form.
Vizzes
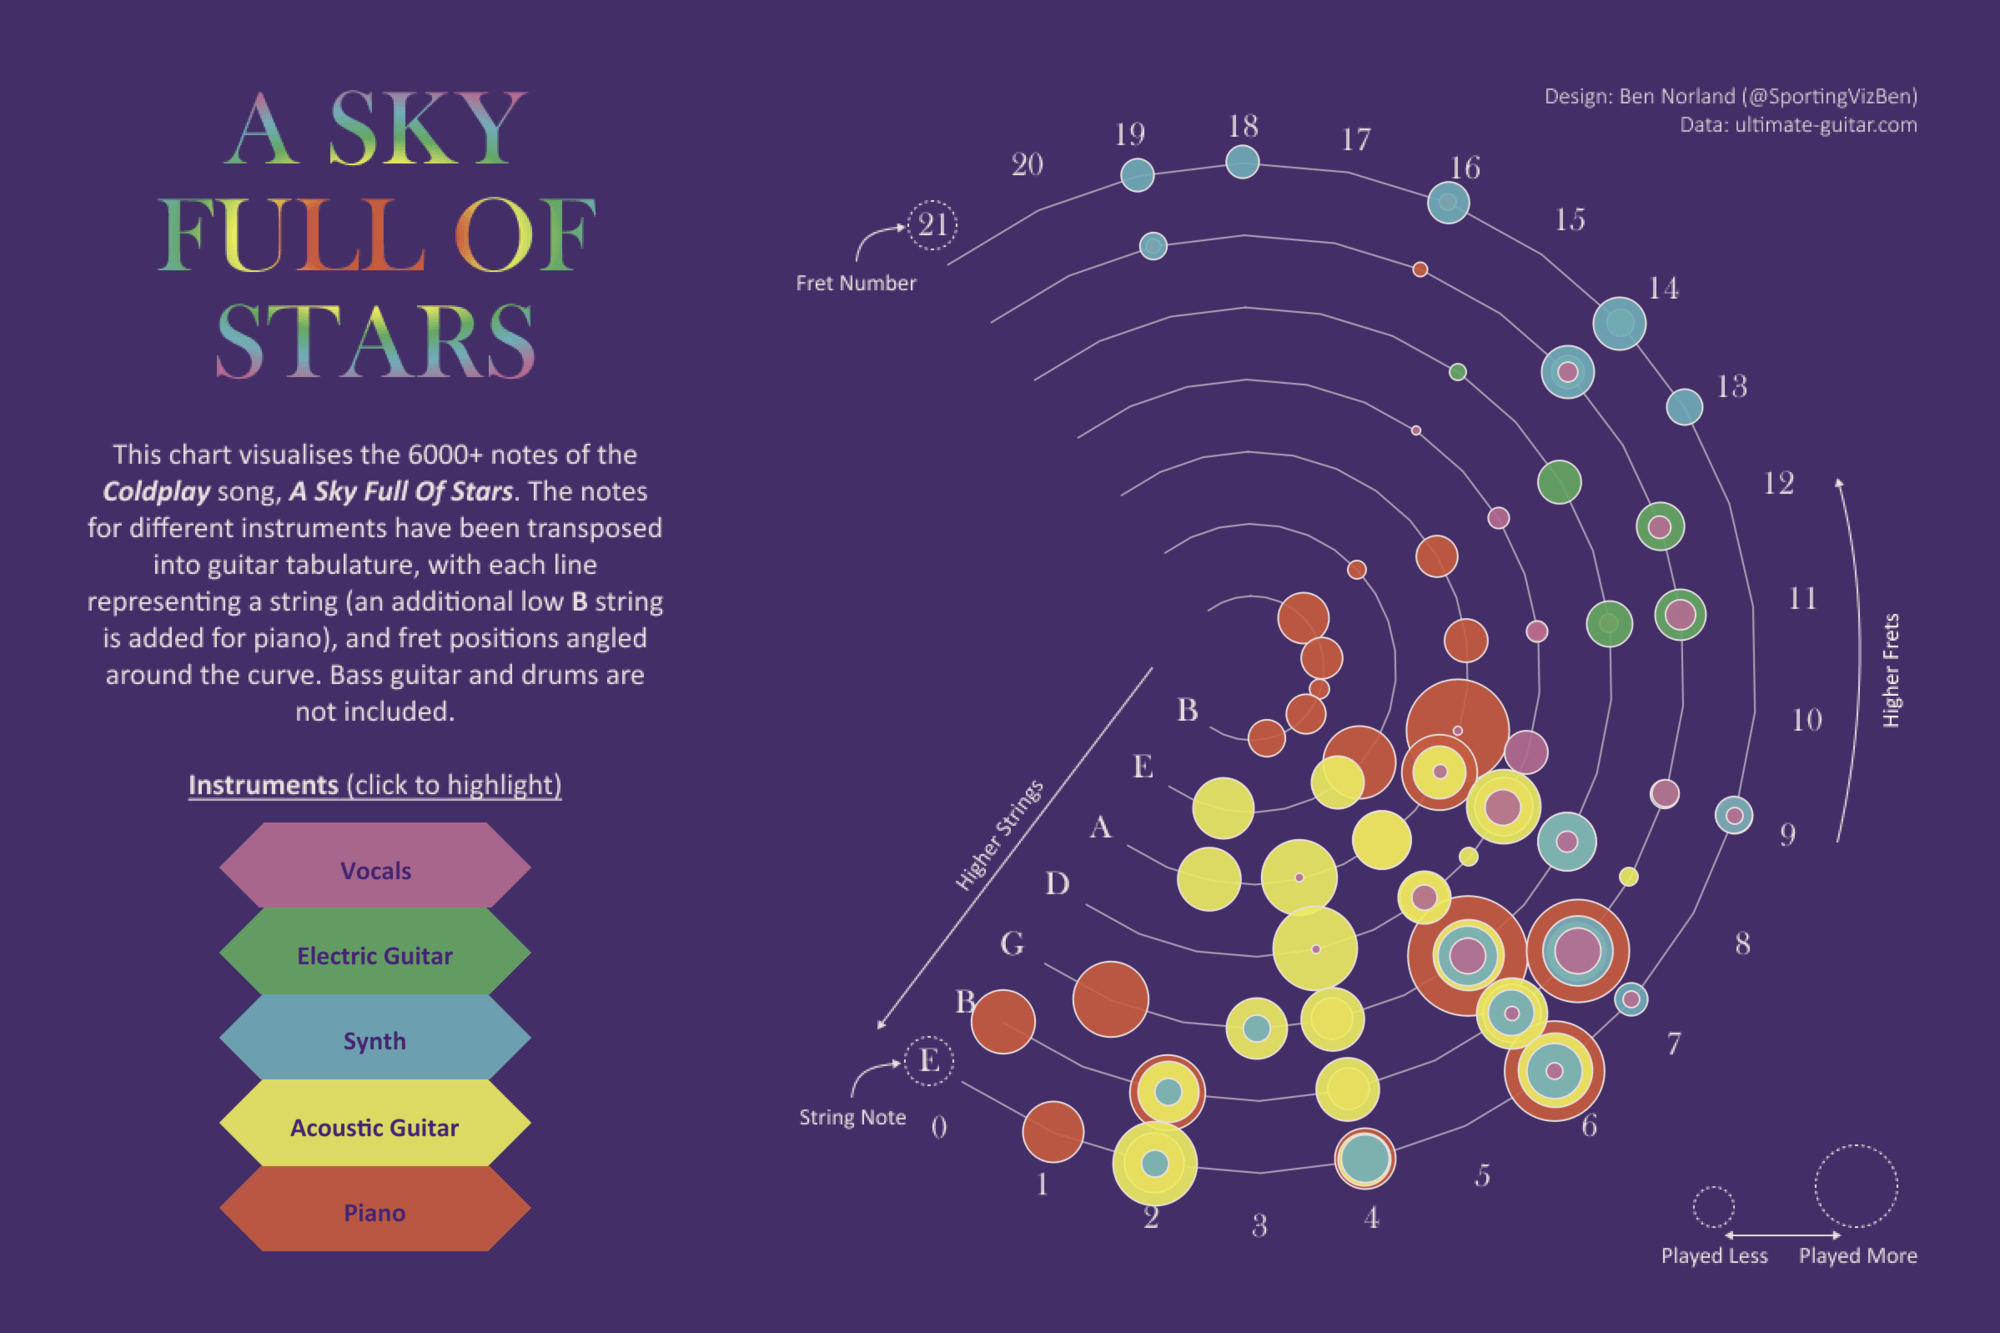
Ben Norland: A Sky Full Of Stars
See the latest Viz of the Day, trending vizzes, featured authors, and more on Tableau Public.
Check out some inspirational vizzes created by the community:
-
Chris Westlake: Conversations between A and B
-
Ben Norland: A Sky Full Of Stars
-
Tanya Lomskaya: Global Art Trade Paths #IronQuest
-
Sam Epley: Tableau Public Featured Authors: June 2023 Cohort
Community Projects
Back 2 Viz Basics
A bi-weekly project helping those who are newer in the community and just starting out with Tableau. Not limited just to newbies!
Web: Back 2 Viz Basics
Twitter: #B2VB
Week 12: Design KPIs
Workout Wednesday
Build your skills with a weekly challenge to re-create an interactive data visualization.
Web: Workout Wednesday
Twitter: #WOW2022
Week 26: Antarctic Ice Extent
Makeover Monday
A weekly social data project.
Web: Makeover Monday
Twitter: #MakeoverMonday
Week 26: Pressure to Drink in the UK
Preppin' Data
A weekly challenge to help you learn to prepare data and use Tableau Prep.
Web: Preppin’ Data
Twitter: #PreppinData
Week 26: Prep School 2023 Admissions - Part 2
DataFam Con
A monthly challenge covering pop culture and fandoms.
Web: DataFam Con
Twitter: #DataFamCon
April 2023: Kids Month!
EduVizzers
A monthly project connecting real education data with real people.
Web: Eduvizzers
June 2023: OECD Programme for International Student Assessment
Games Night Viz
A monthly project focusing on using data from your favorite games.
Web: Games Nights Viz
Twitter: #GamesNightViz
Level 6: The Final Boss
Iron Quest
Practice data sourcing, preparation, and visualization skills in a themed monthly challenge.
Web: Iron Quest
Twitter: #IronQuest
Advanced Chart Types
Storytelling with Data
Practice data visualization and storytelling skills by participating in monthly challenges and exercises.
Web: Storytelling with Data
Twitter: #SWDChallenge
June 2023: fun with fonts
Project Health Viz
Uncover new stories by visualizing healthcare data sets provided each month.
Web: Project Health Viz
Twitter: #ProjectHealthViz
June 2023: Funding for Research for Various Conditions and Diseases
Diversity in Data
An initiative centered around diversity, equity & awareness by visualizing provided datasets each month.
Web: Diversity in Data
Twitter: #DiversityinData
May 2023: Mental Health Awareness Month and LGBTQ+ Representation in film
Sports Viz Sunday
Create and share data visualizations using rich, sports-themed data sets in a monthly challenge.
Web: Sports Viz Sunday
Twitter: #SportsVizSunday
January 2023: Is it a Sport or a Game?
Viz for Social Good
Volunteer to design data visualizations that help nonprofits harness the power of data for social change.
Web: Viz for Social Good
Twitter: #VizforSocialGood
June 9 - July 18, 2023: Gord Downie & Chanie Wenjack Fund
Real World Fake Data
Create business dashboards using provided data sets for various industries and departments.
Web: Real World Fake Data
Twitter: #RWFD
Session 5: Diversity Score Card
Data Plus Music
A monthly project visualizing the data behind the music we love!
Web: Data Plus Music
Twitter: #DataPlusMusic
Zugehörige Storys

DataFam Roundup June 2026

DataFam Roundup May 2026

Iron Viz 2026: Read Between the Data
 28 Mai, 2026