Good Enough to Great: A Quick Guide for Better Data Visualizations
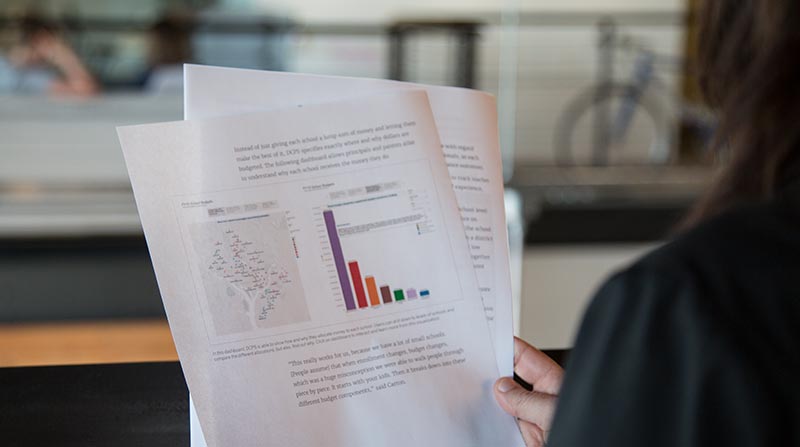
Learn how to improve the effectiveness of your data visualizations with these five tips.
Download this free whitepaper
In today’s marketplace, successful decision-making has everything to do with turning data insights into action. And because the goal of data visualization is impact, not numbers, here are five ways to take your visualizations from good enough to great.
In this whitepaper, you’ll learn about:
- Different chart types and when to use them
- How to use shapes and custom shapes
- Best practices for colors, logos and text
- Mark sizes and data maps
- Labels and dashboard composition
They show up for the beautiful visualization, but they stay for the insight. So what you want is to get people ‘addicted’ to the data by making it interactive, making it fun, and allowing them to find things on their own.
