Reimagining the Tableau Public Viz Gallery


If you’ve been to Tableau Conference in the past, you may be familiar with the Tableau Public Viz Gallery. Each year, the Tableau Public Team handpicks a collection of data visualizations to print and put on display. The Viz Gallery made its debut at Tableau Conference Europe in 2016 and since then it’s become a conference fan-favorite.
This past April, Tableau made the decision to reimagine in-person events in new and virtual ways through the end of 2020. We worked tirelessly to transform the physical Tableau Conference into a virtual experience for thousands of people in their homes. How would we be able to create an immersive and engaging virtual Viz Gallery? We had to reimagine the in-person Viz Gallery... and the result was a virtual reality experience, unlike any museum gallery you’ve visited before.
After launching the virtual Tableau Public Viz Gallery earlier this week, we were absolutely blown away by the community’s response. Every little detail--from the music selection to the Iron Viz wall--was noticed and appreciated. We couldn’t be more thrilled with the feedback we received. The Tableau Public Viz Gallery will remain “open” for visitors until October 16th, 2020—be sure to stop by and admire the stunning work of the Tableau Community. Read on to learn about the process of bringing this year’s gallery to life.
Why a Viz Gallery?
The Viz Gallery was created to showcase the incredible work of Tableau Public authors and to allow their fellow authors to learn and be inspired. Every year we’re more impressed by the talent of the Tableau Community. Whether you’re just getting started with Tableau, or you’re a seasoned veteran, you can appreciate the stories these authors are able to tell with data. The possibilities of what you can do with data are endless.
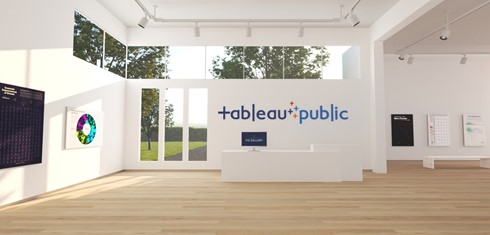
The Tableau Public Viz Gallery at first-glance.
Creating the virtual space
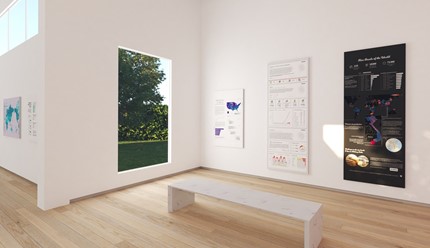
Before selecting which vizzes to feature, we had to think about what the gallery should look like and feel like. We explored mock-ups of different spaces before landing on a linear layout that was easy for visitors to navigate. The white walls were the least distracting, allowing the viewers to focus on the vizzes themselves. To help visitors orient themselves, we chose different accent colors for each room.
Next, we started to think about the ambiance we wanted to create. After considering various options for background music—including techno beats and movie trailer soundtracks—we chose a soft piano melody so visitors would feel calm and relaxed upon entering. We’ve received feedback that the in-person Viz Gallery is a place of respite from the hustle of the conference, so we tried to emulate that sense of 'oasis' with the music we selected.
Curating the vizzes
With over three million vizzes published to Tableau Public, choosing which vizzes to feature in the gallery was an incredibly difficult task. We started by using Tableau Public data to identify some of the most engaging vizzes published to Tableau Public in the last year (e.g. vizzes with the highest number of views or favorites). From there, we started looking at the following factors:
- Viz topic: we chose vizzes on a variety of topics--from important social issues like gender equality to culturally relevant topics like rap music or Netflix.
- Viz author: we wanted to be sure that the authors we featured were representative of our actual Tableau Public users who are located all over the world. This year, we featured authors from fourteen different countries.
- Author type: It was also important to us that we highlighted both individuals and organizations like Deloitte. Our users range from data analysts to Fortune 500 companies and non-profits.
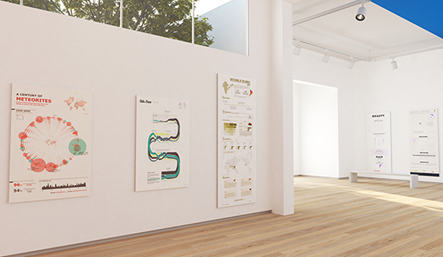
- Chart type: there are tons of chart types that can be used to visualize data. For the gallery, we sought out vizzes with charts that were “out of the box” (a chart we felt could be replicated by the average user) or “completely bananas” (charts that demonstrate what’s possible in Tableau but don’t necessarily follow best practices). Throughout the gallery, you’ll see radial charts, Sankey diagrams, bubble charts, and more.
We agreed on a total of 31 vizzes by a diverse group of authors--highlighting some of the most creative, informative, and well-designed data visualizations on Tableau Public.
Meet the Tableau Public of each viz featured in the gallery below. Be sure to follow each of them on Tableau Public:


The Tableau Public Viz Gallery will remain “open” for anyone to visit until October 16th, 2020. Take a moment to explore the gallery, “heart” your favorite vizzes, and leave comments for the talented authors.
相關文章

Iron Viz 2026: Read Between the Data
 2026/05/28

Tableau's Iron Viz Winners

Explore the 2026 Iron Viz Entries
 2025/12/15