Product Innovation from Devs on Stage at Tableau Conference 2025


Year after year, Devs on Stage is one of the most highly anticipated moments at Tableau Conference. The DataFam always loves seeing exciting upcoming innovations presented by the developers who are creating them!
Let’s review what the developers shared at Tableau Conference.
Tableau Prep in-database processing
In-memory processing during data preparation can be costly, especially with large data sets. Now, when you run a data prep flow, you can process it in the database to optimize your data transfers.
Custom Python scripts in Tableau Prep on Cloud
Leverage the scale of the cloud to run custom Python scripts in Tableau Prep, now supported in Tableau Cloud.
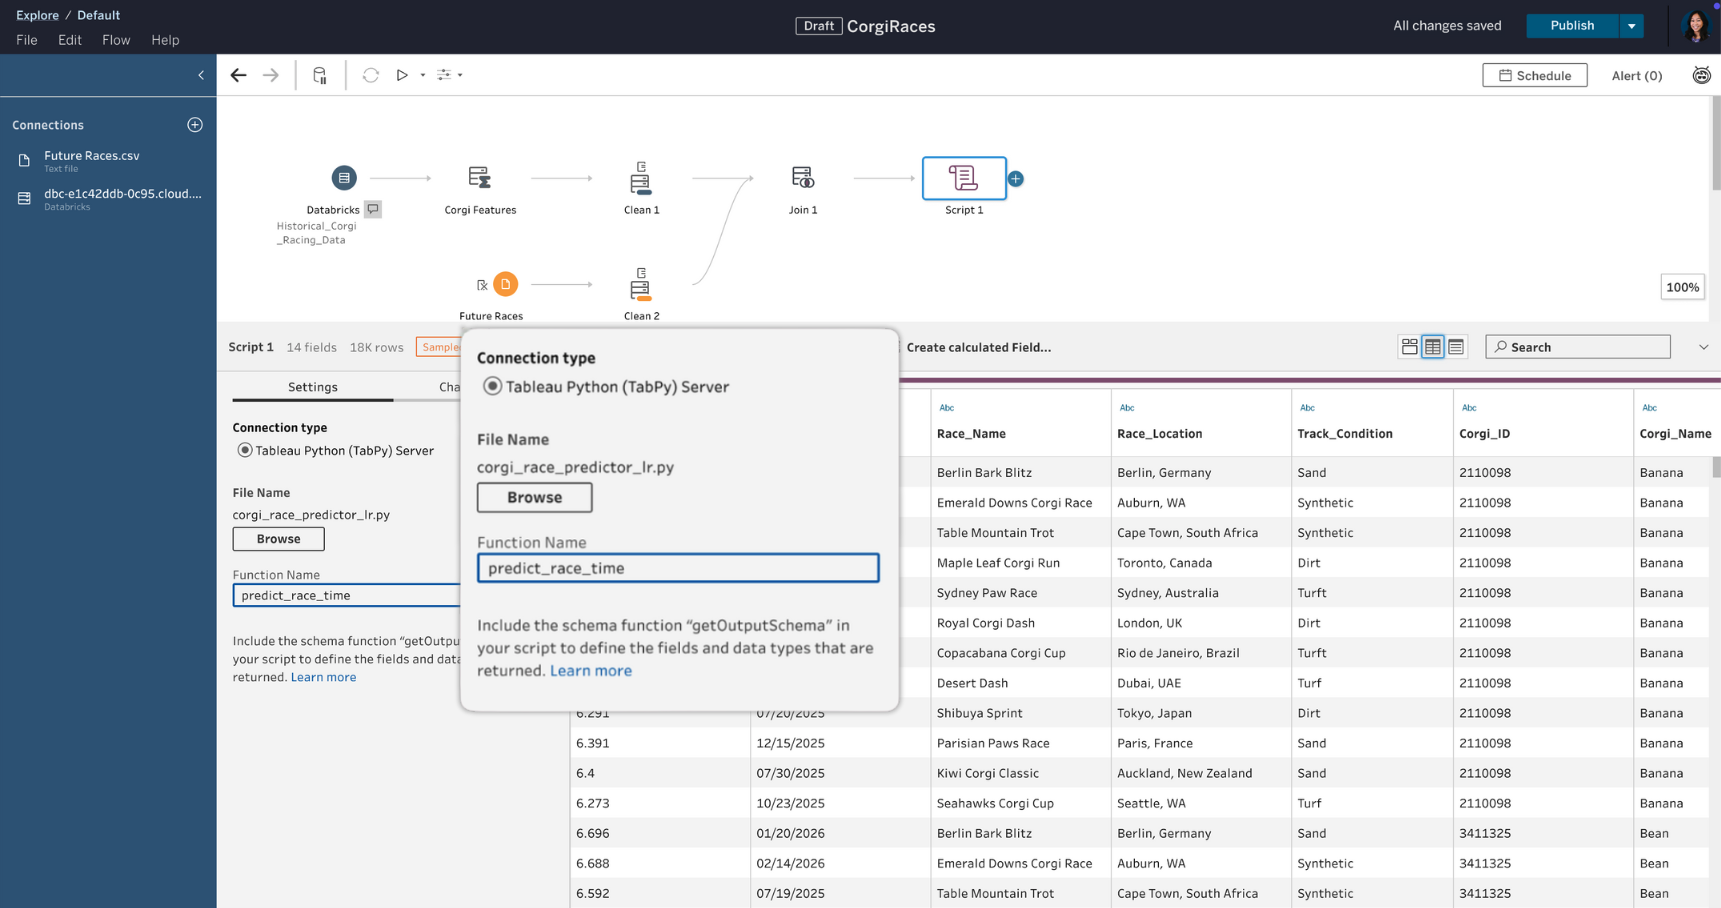
Tableau Prep output to Google Drive
Save Tableau Prep outputs to a Google Drive, making your prepped data accessible beyond the database.
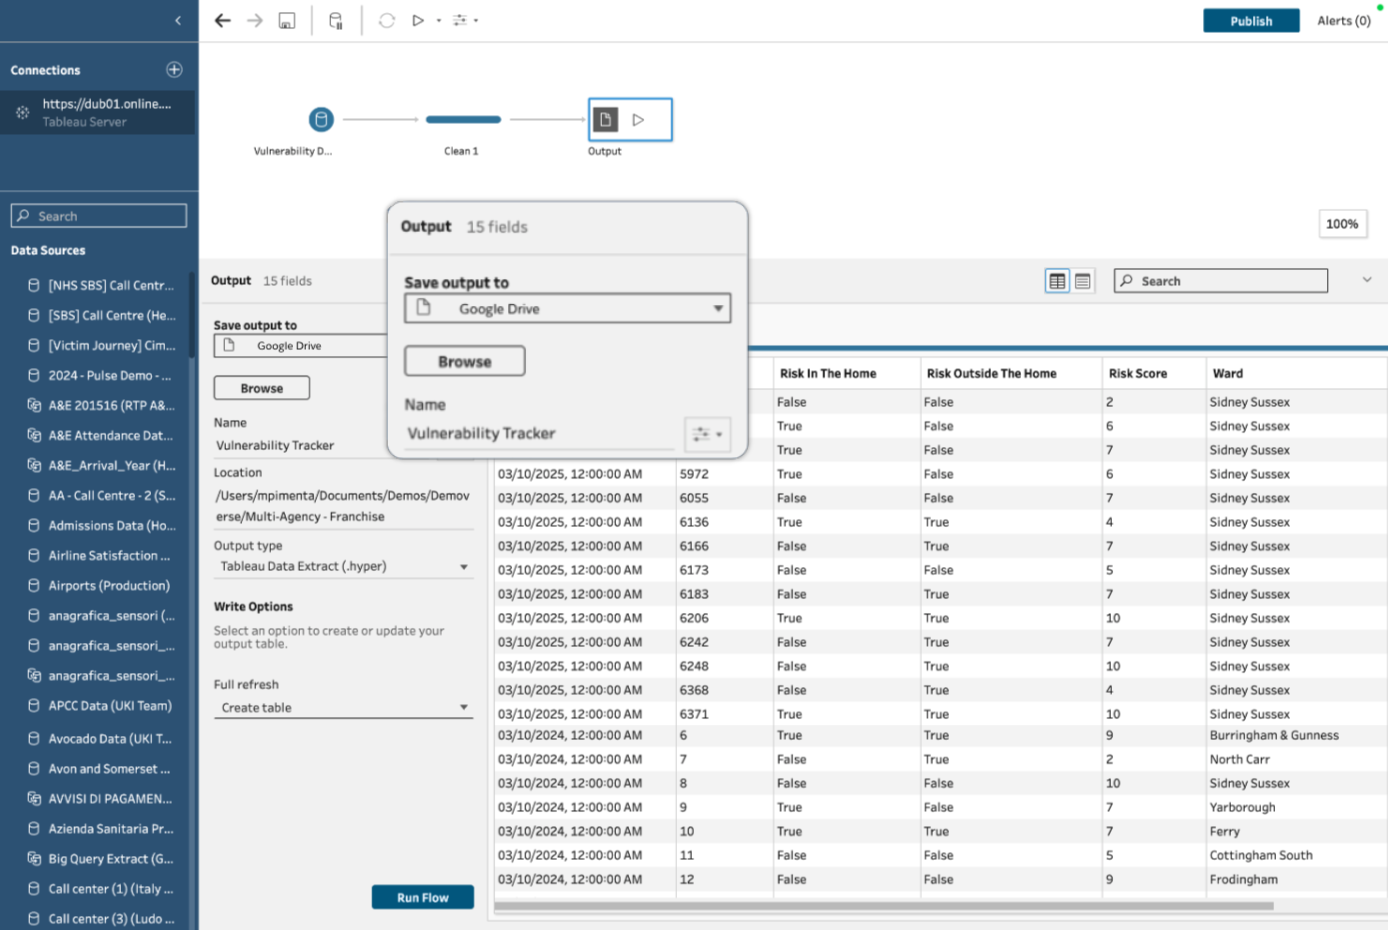
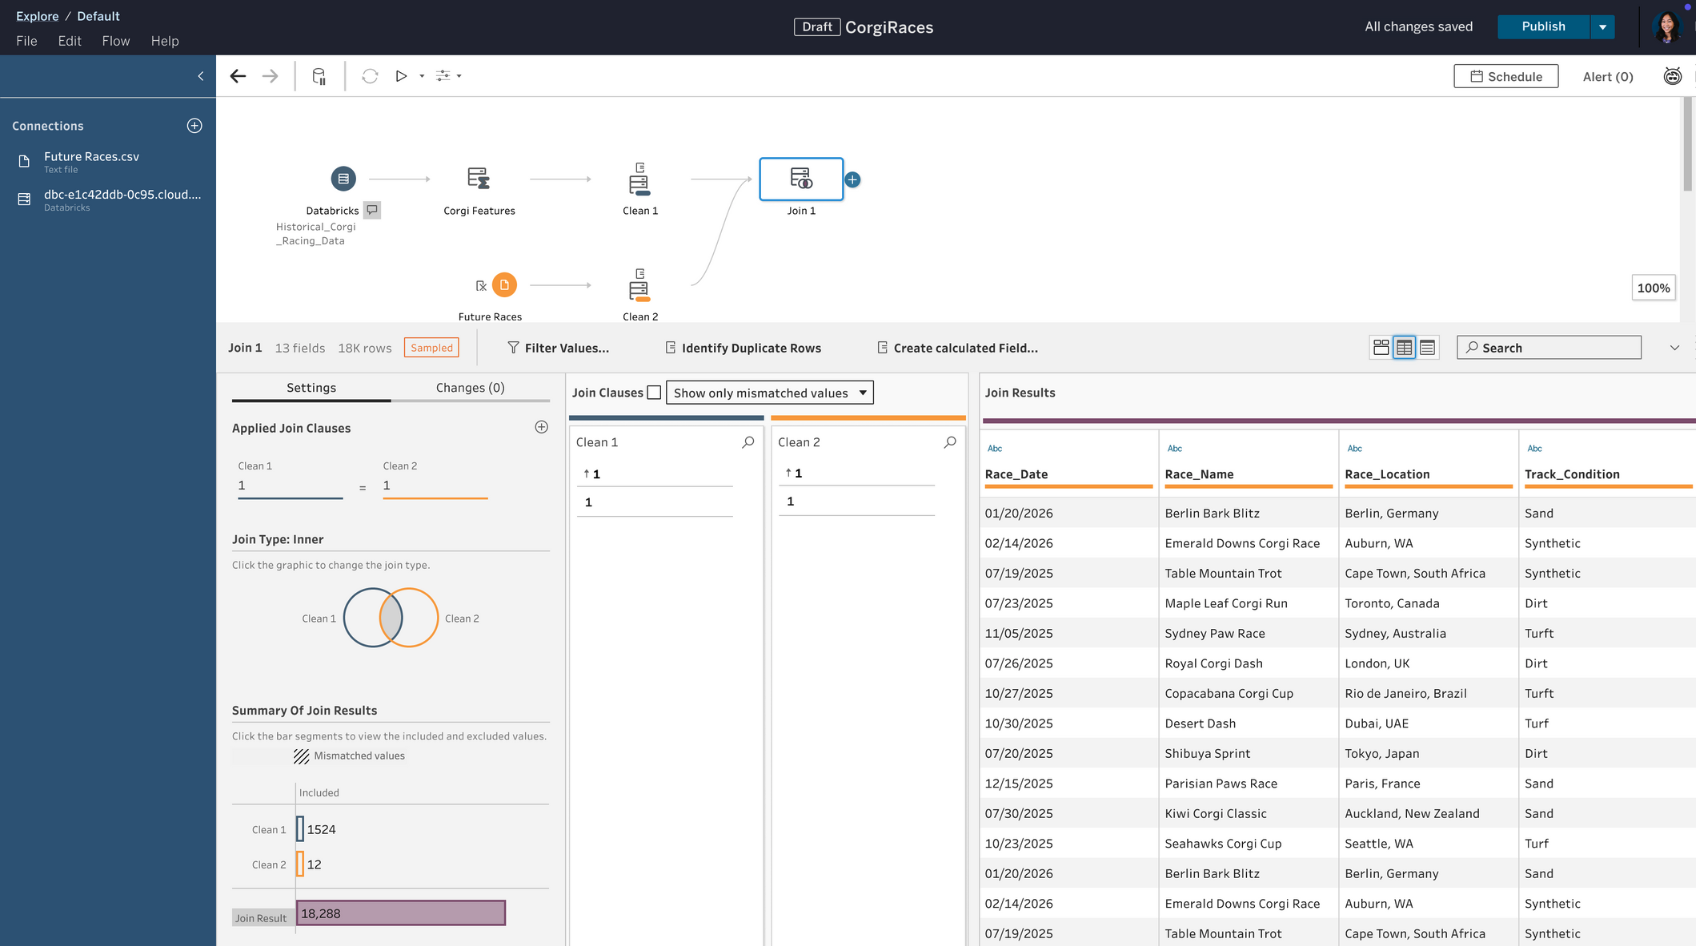
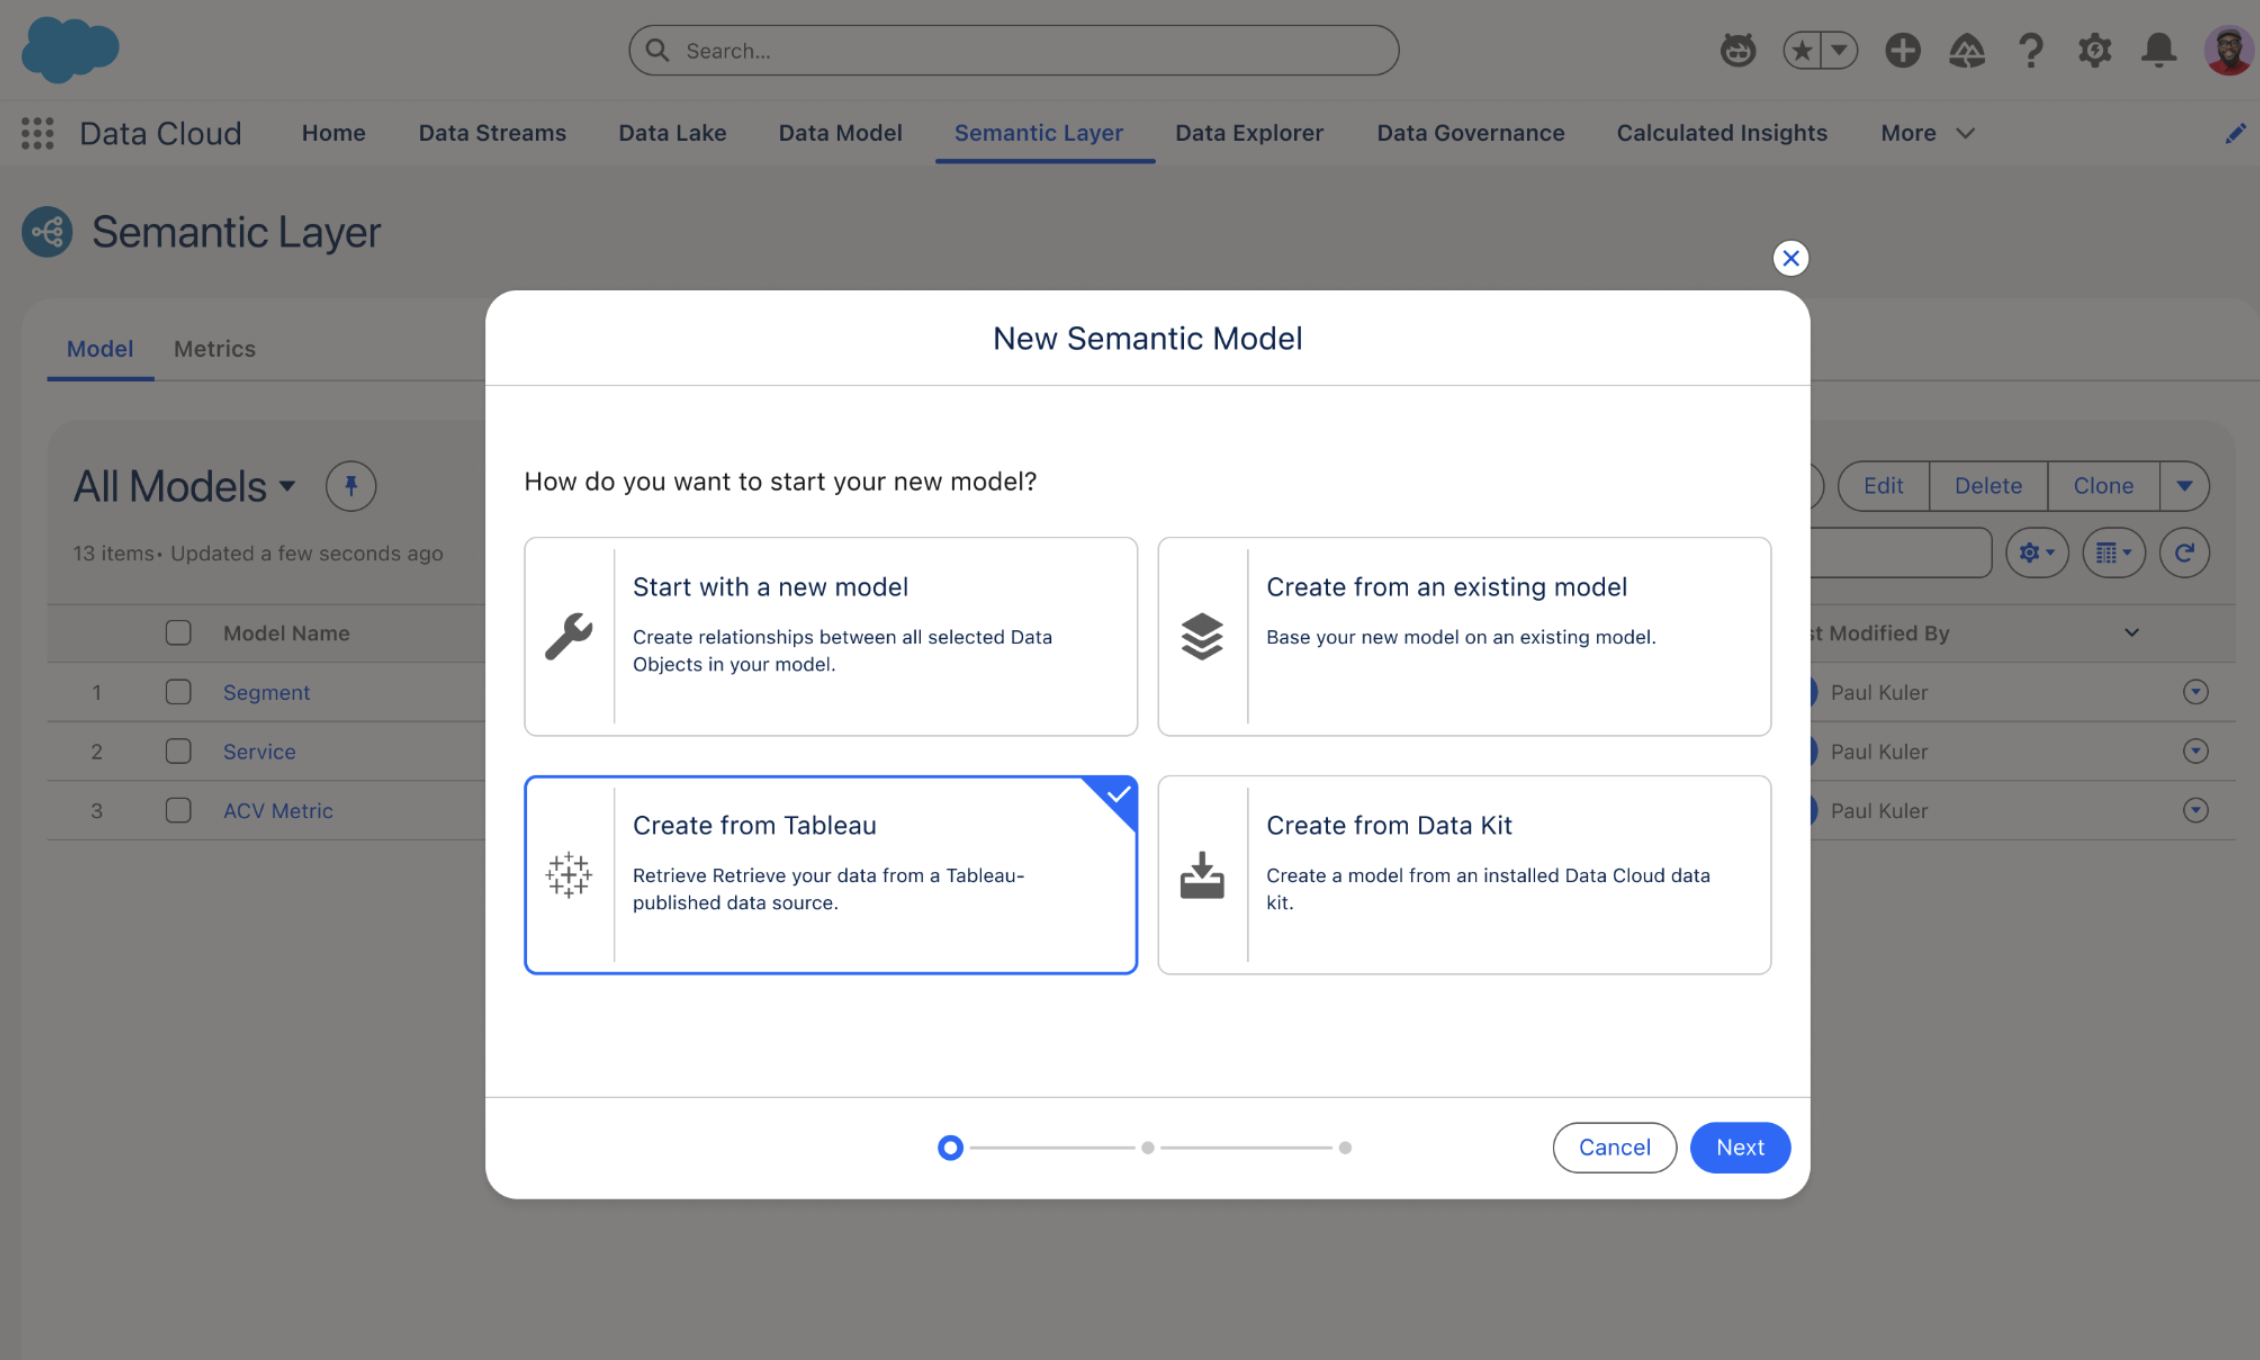
Tableau Semantics connector & Published Data Sources in Tableau Semantics
Bring semantic models from Tableau Semantics in Data Cloud into Tableau, maintaining all semantics, relationships, and calculated fields. Also, connect to and leverage your existing Tableau Published Data Sources within Tableau Semantics—without migrating any data. Utilize Tableau Published Data sources for agentic experiences in Tableau Next.
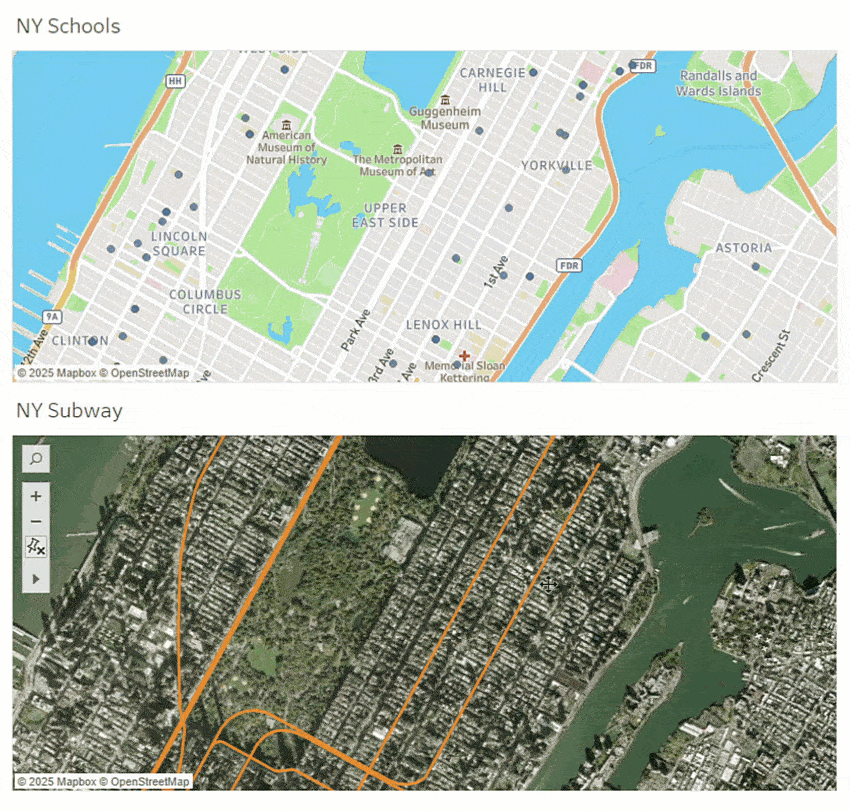
Viewport Parameters
Building on Spatial Parameters released in 2024.3, we're adding new capabilities to enable more powerful geospatial visualizations and interactivity. Anchor your spatial parameter value to what's visible on your map view (viewport). The parameter updates with every zoom and pan on the map, driving logic in calculations and across disparate data sources with geographic data.
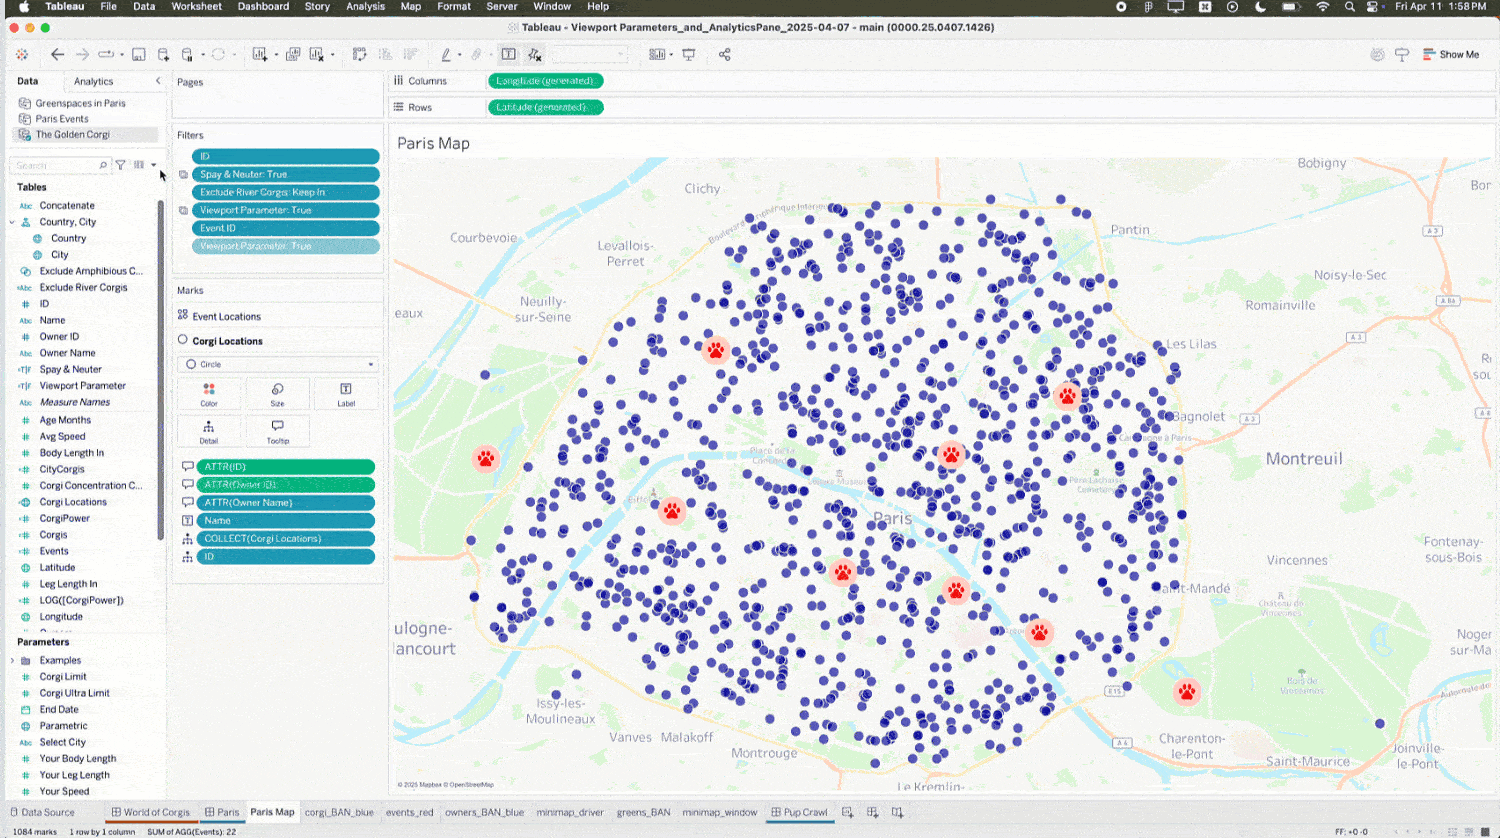
Analytics Pane Extensions
Drag and drop custom analytic objects directly from the Analytics pane to discover additional insights from your data.
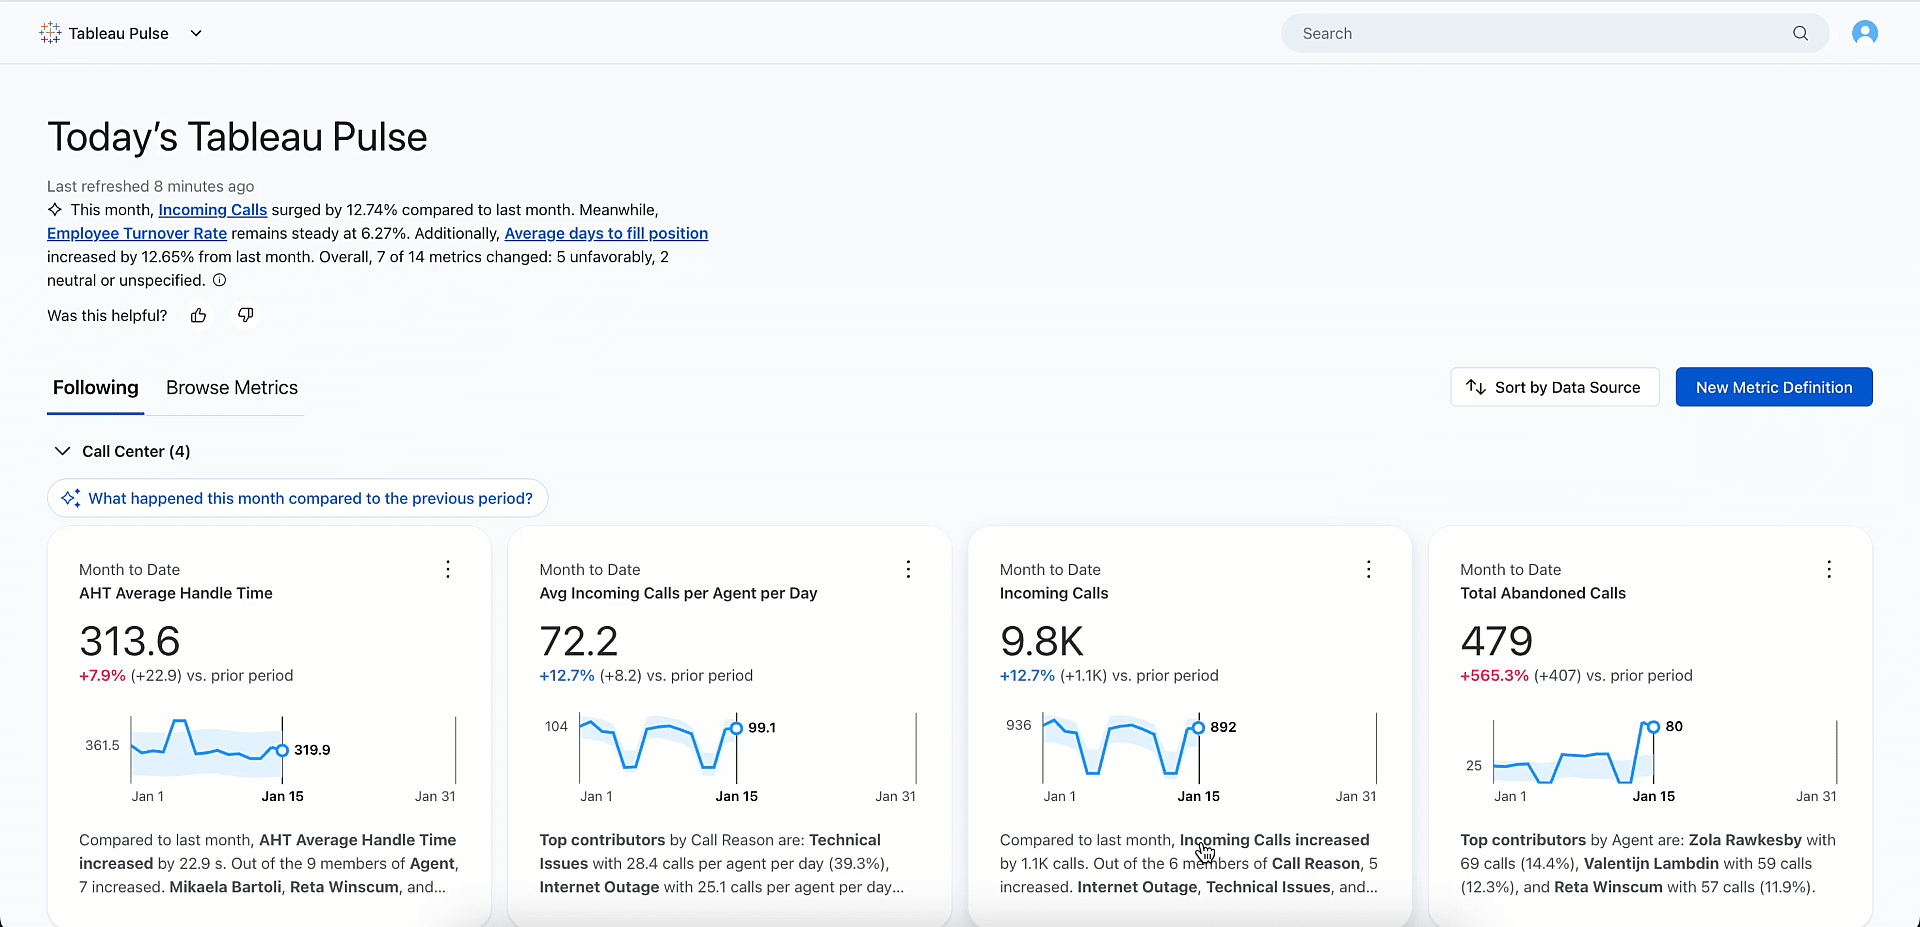
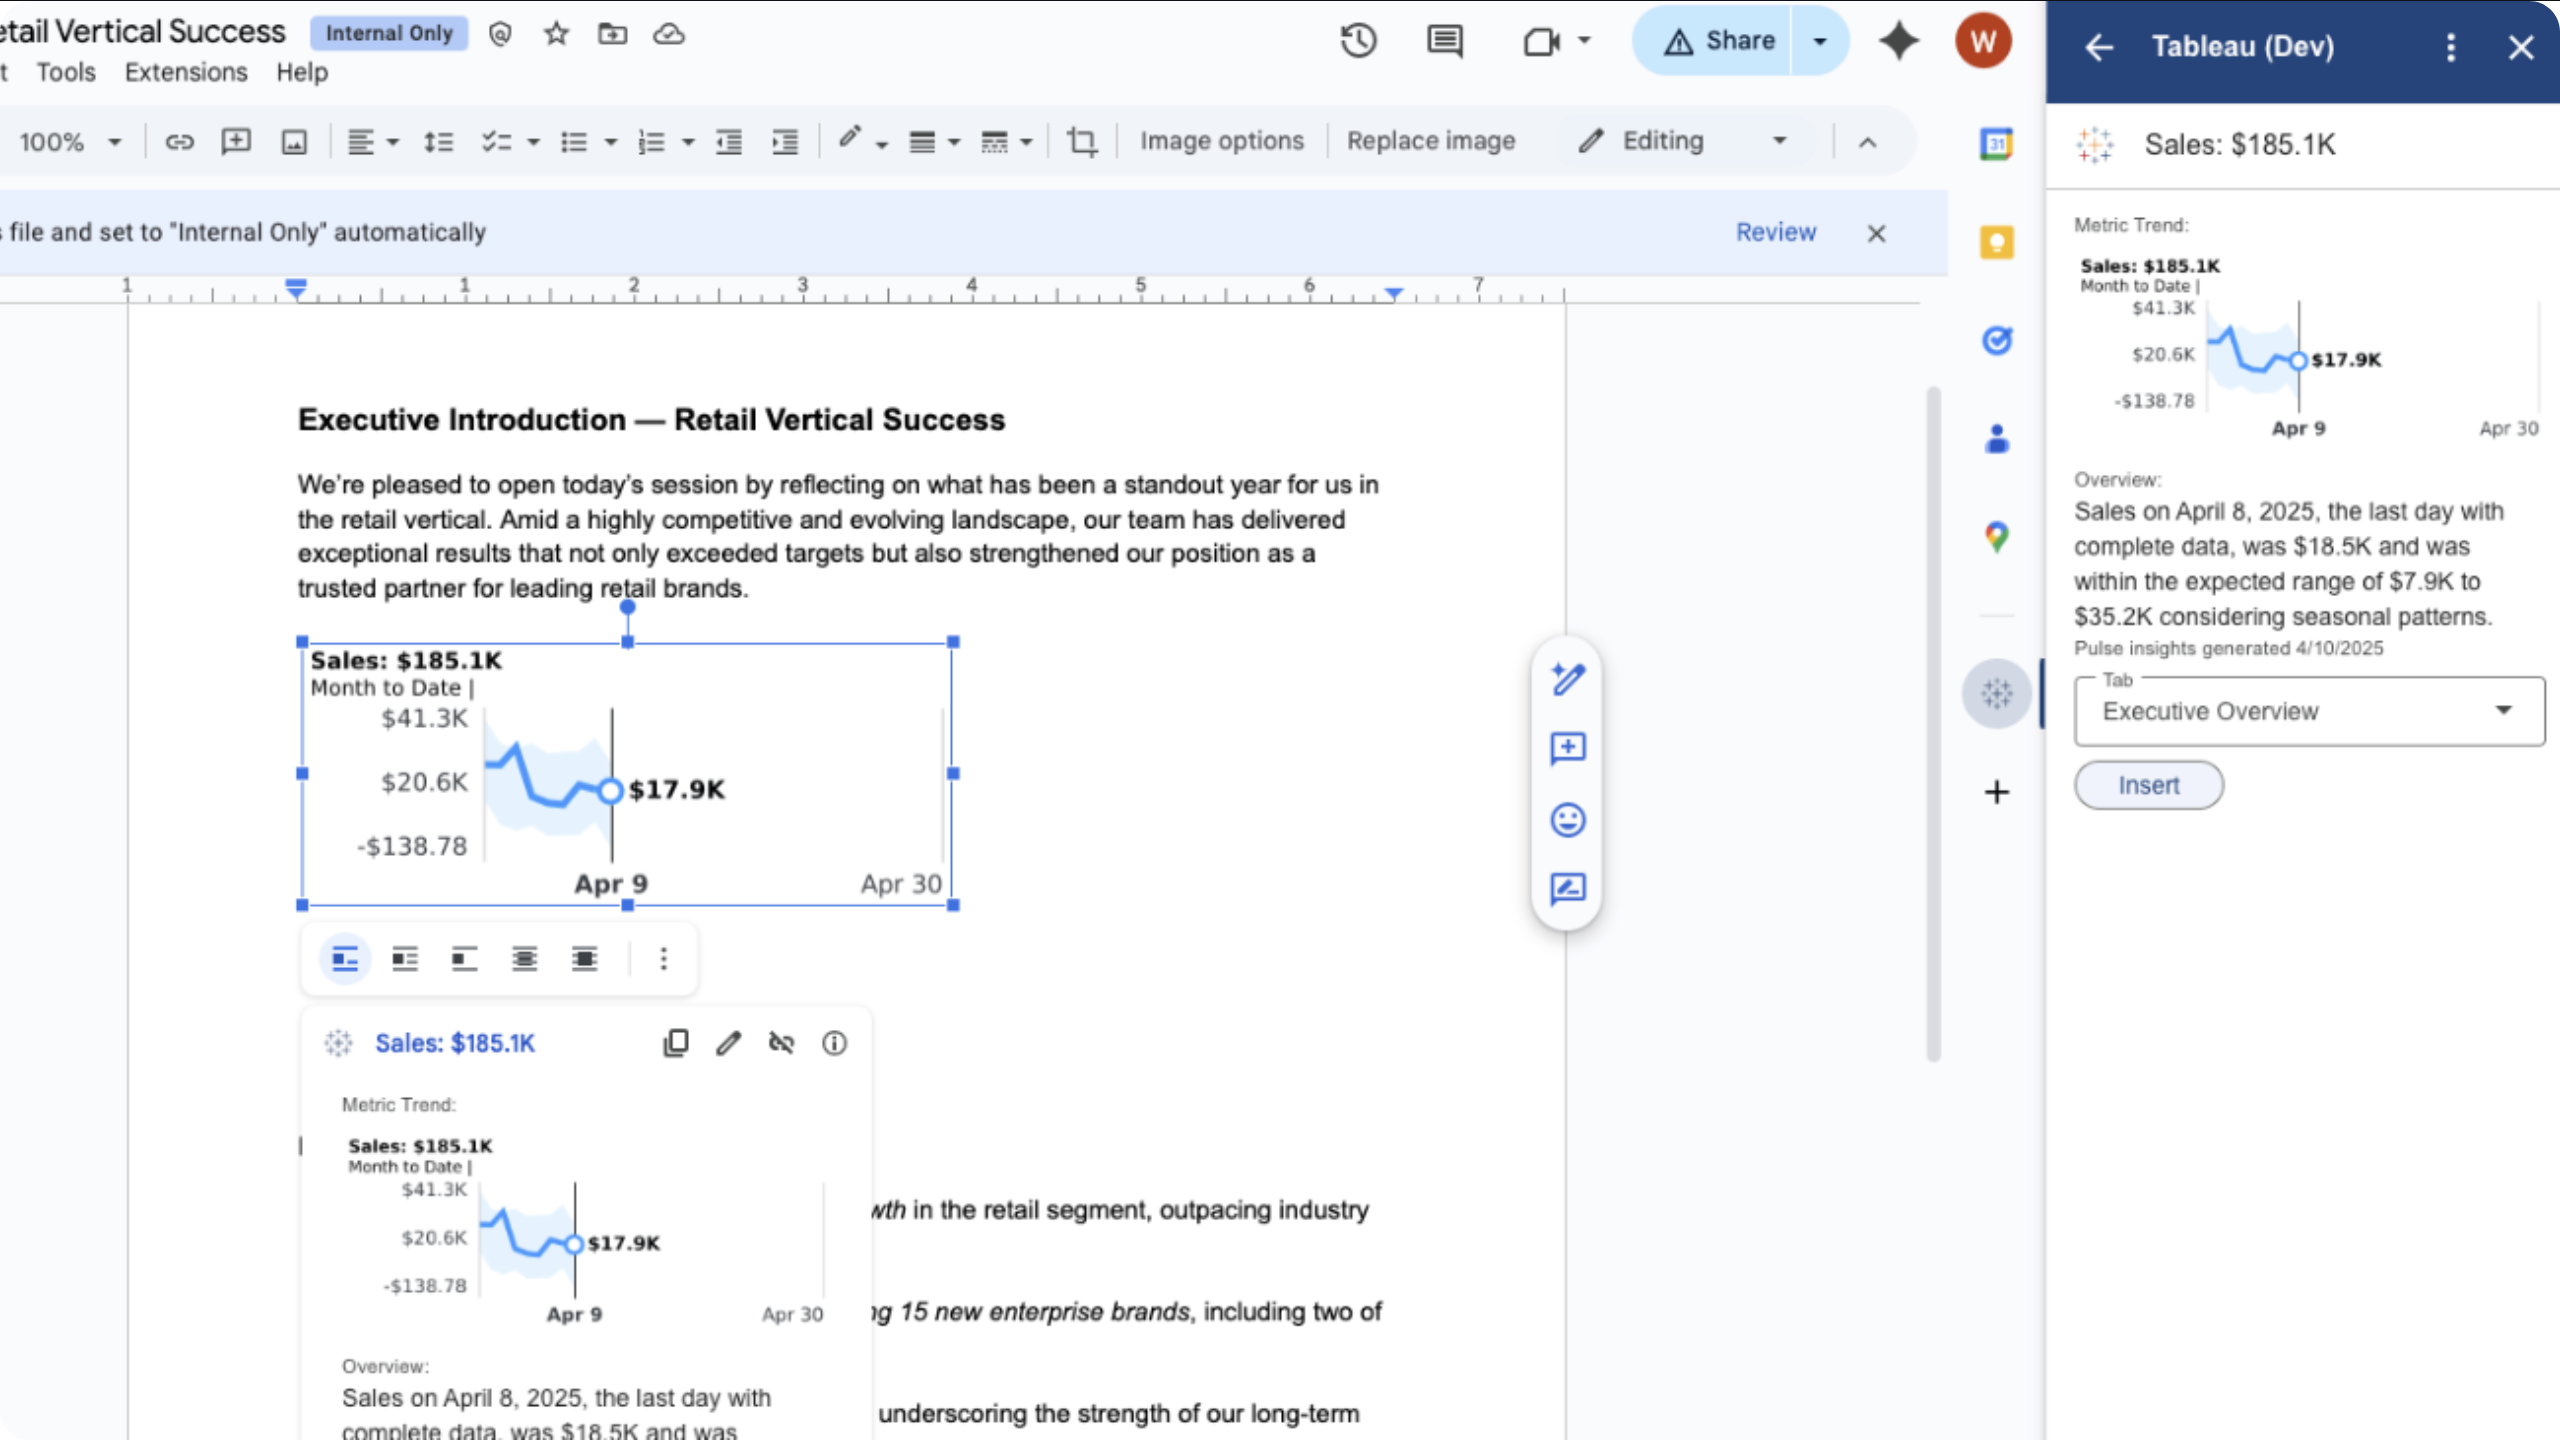
Enhanced Q&A in Tableau Pulse
Get intuitive insights, relevant visualizations, source references, and suggested follow-up questions through a conversational analytics experience. It’s available today through Tableau+.
Instant viz in Show Me
Show Me already recommends a viz type based on the data you select. Now, you can select a visualization type and Show Me will recommend data and automatically create visualizations for you to uncover insights.
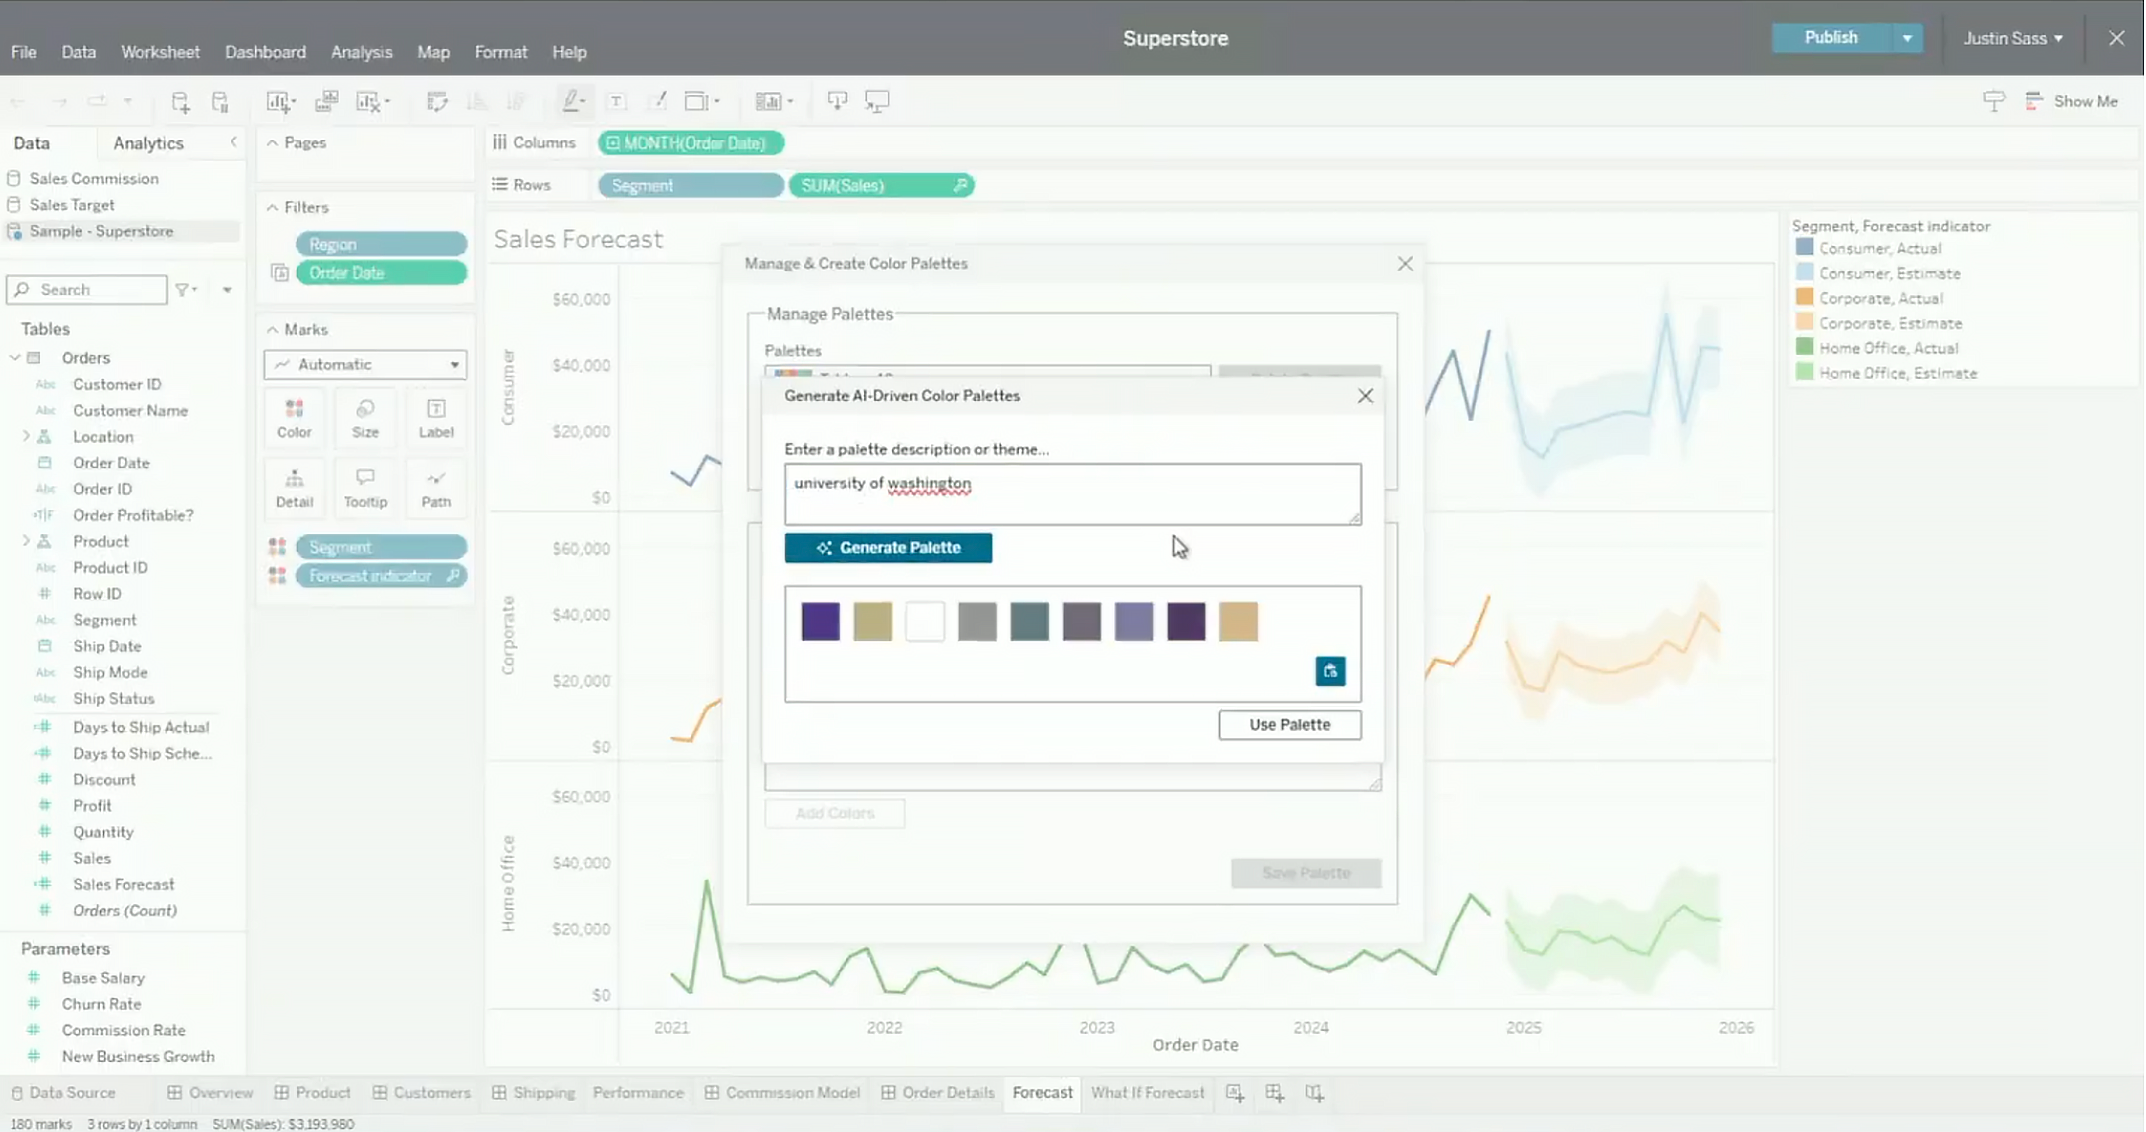
Custom color palettes
Use generative AI to help you create new custom palettes from natural language prompts.
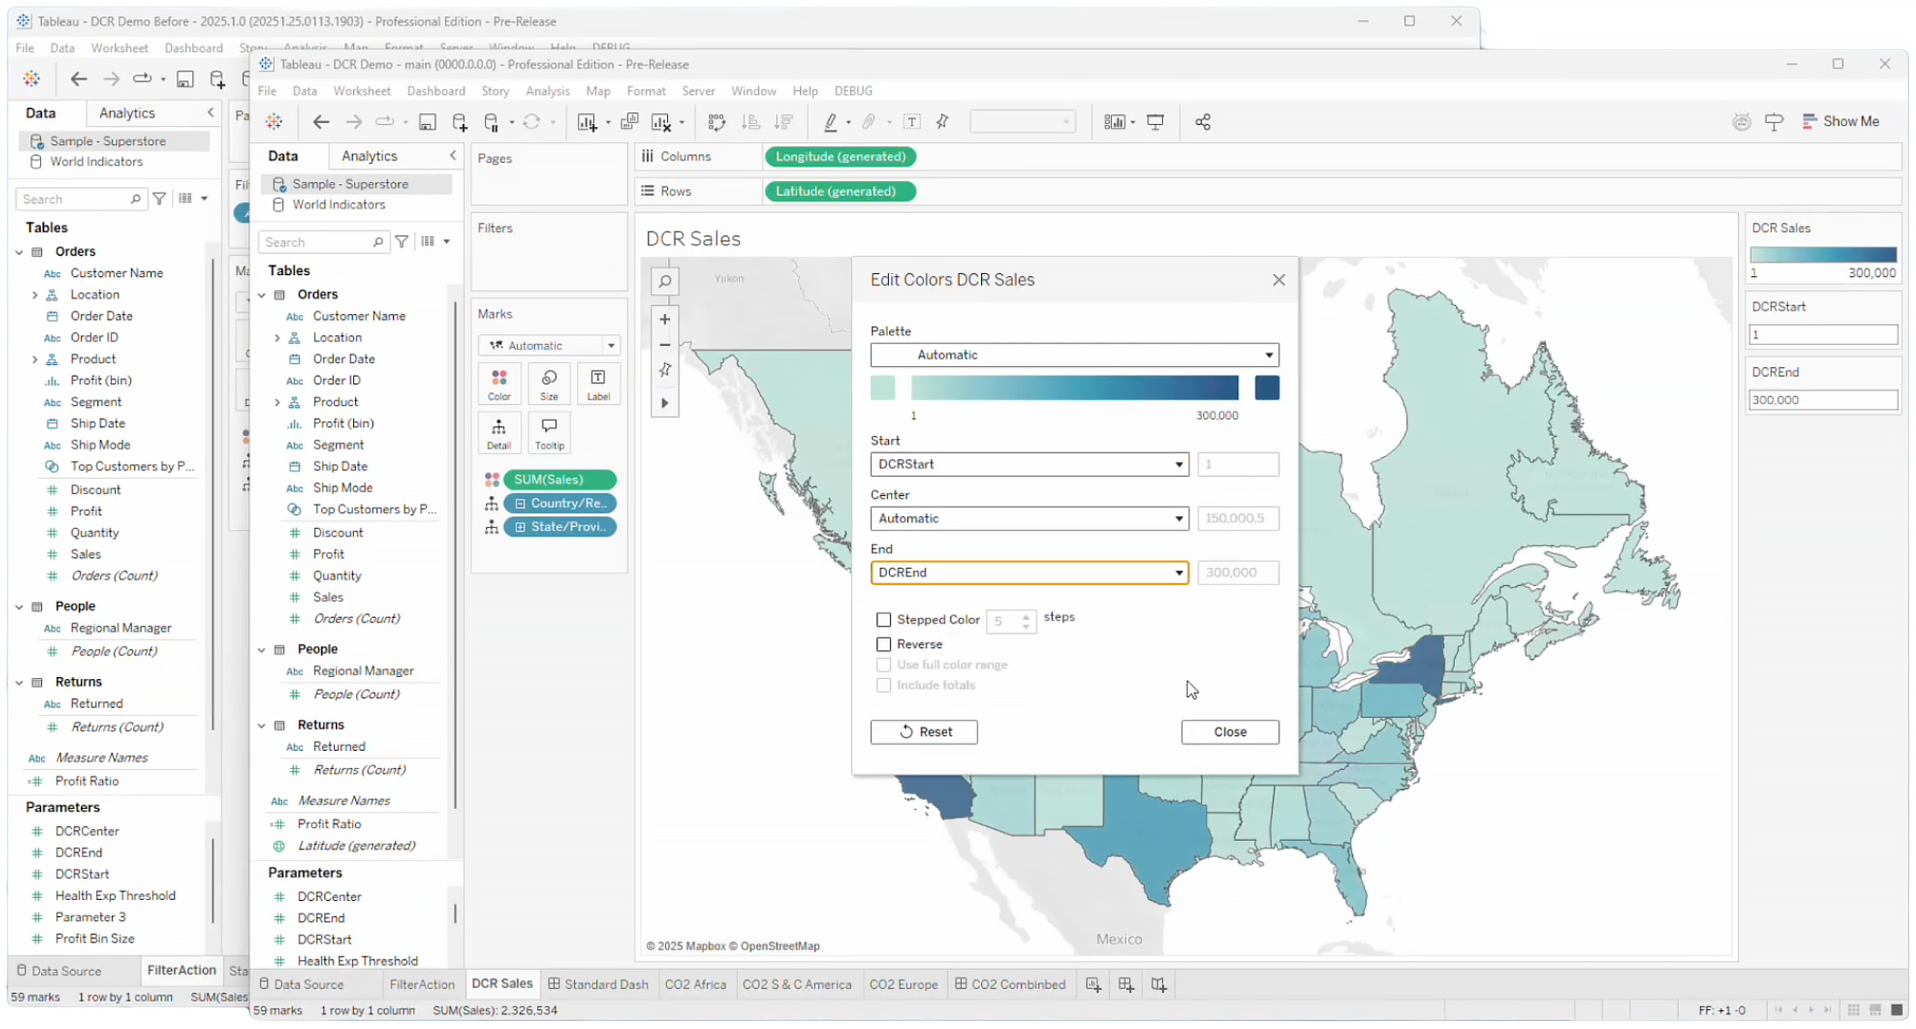
Dynamic color ranges
Color ranges in your viz are dynamically updated based on users’ selections, reflecting the scope of what’s in the view. This helps to detect more detailed trends in subsets of your data.
Accessible navigation and actions
Accessible insights in Tableau Cloud and Server are just a few keystrokes away. Select a mark and trigger actions all from your keyboard.
Rounded corners
You can now round corners on dashboard objects, giving you more flexibility for styling your vizzes.
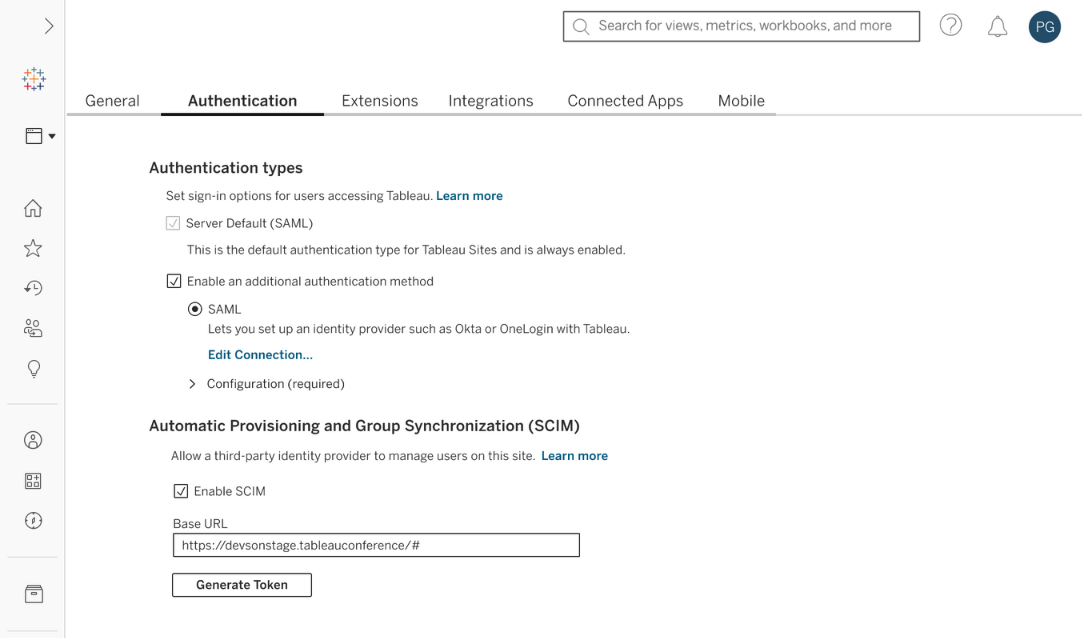
SCIM on Tableau Server
Simplify user and group management—no more running scripts or adding users manually. Provision users instantly, including with automatic group updates across your Tableau landscape.
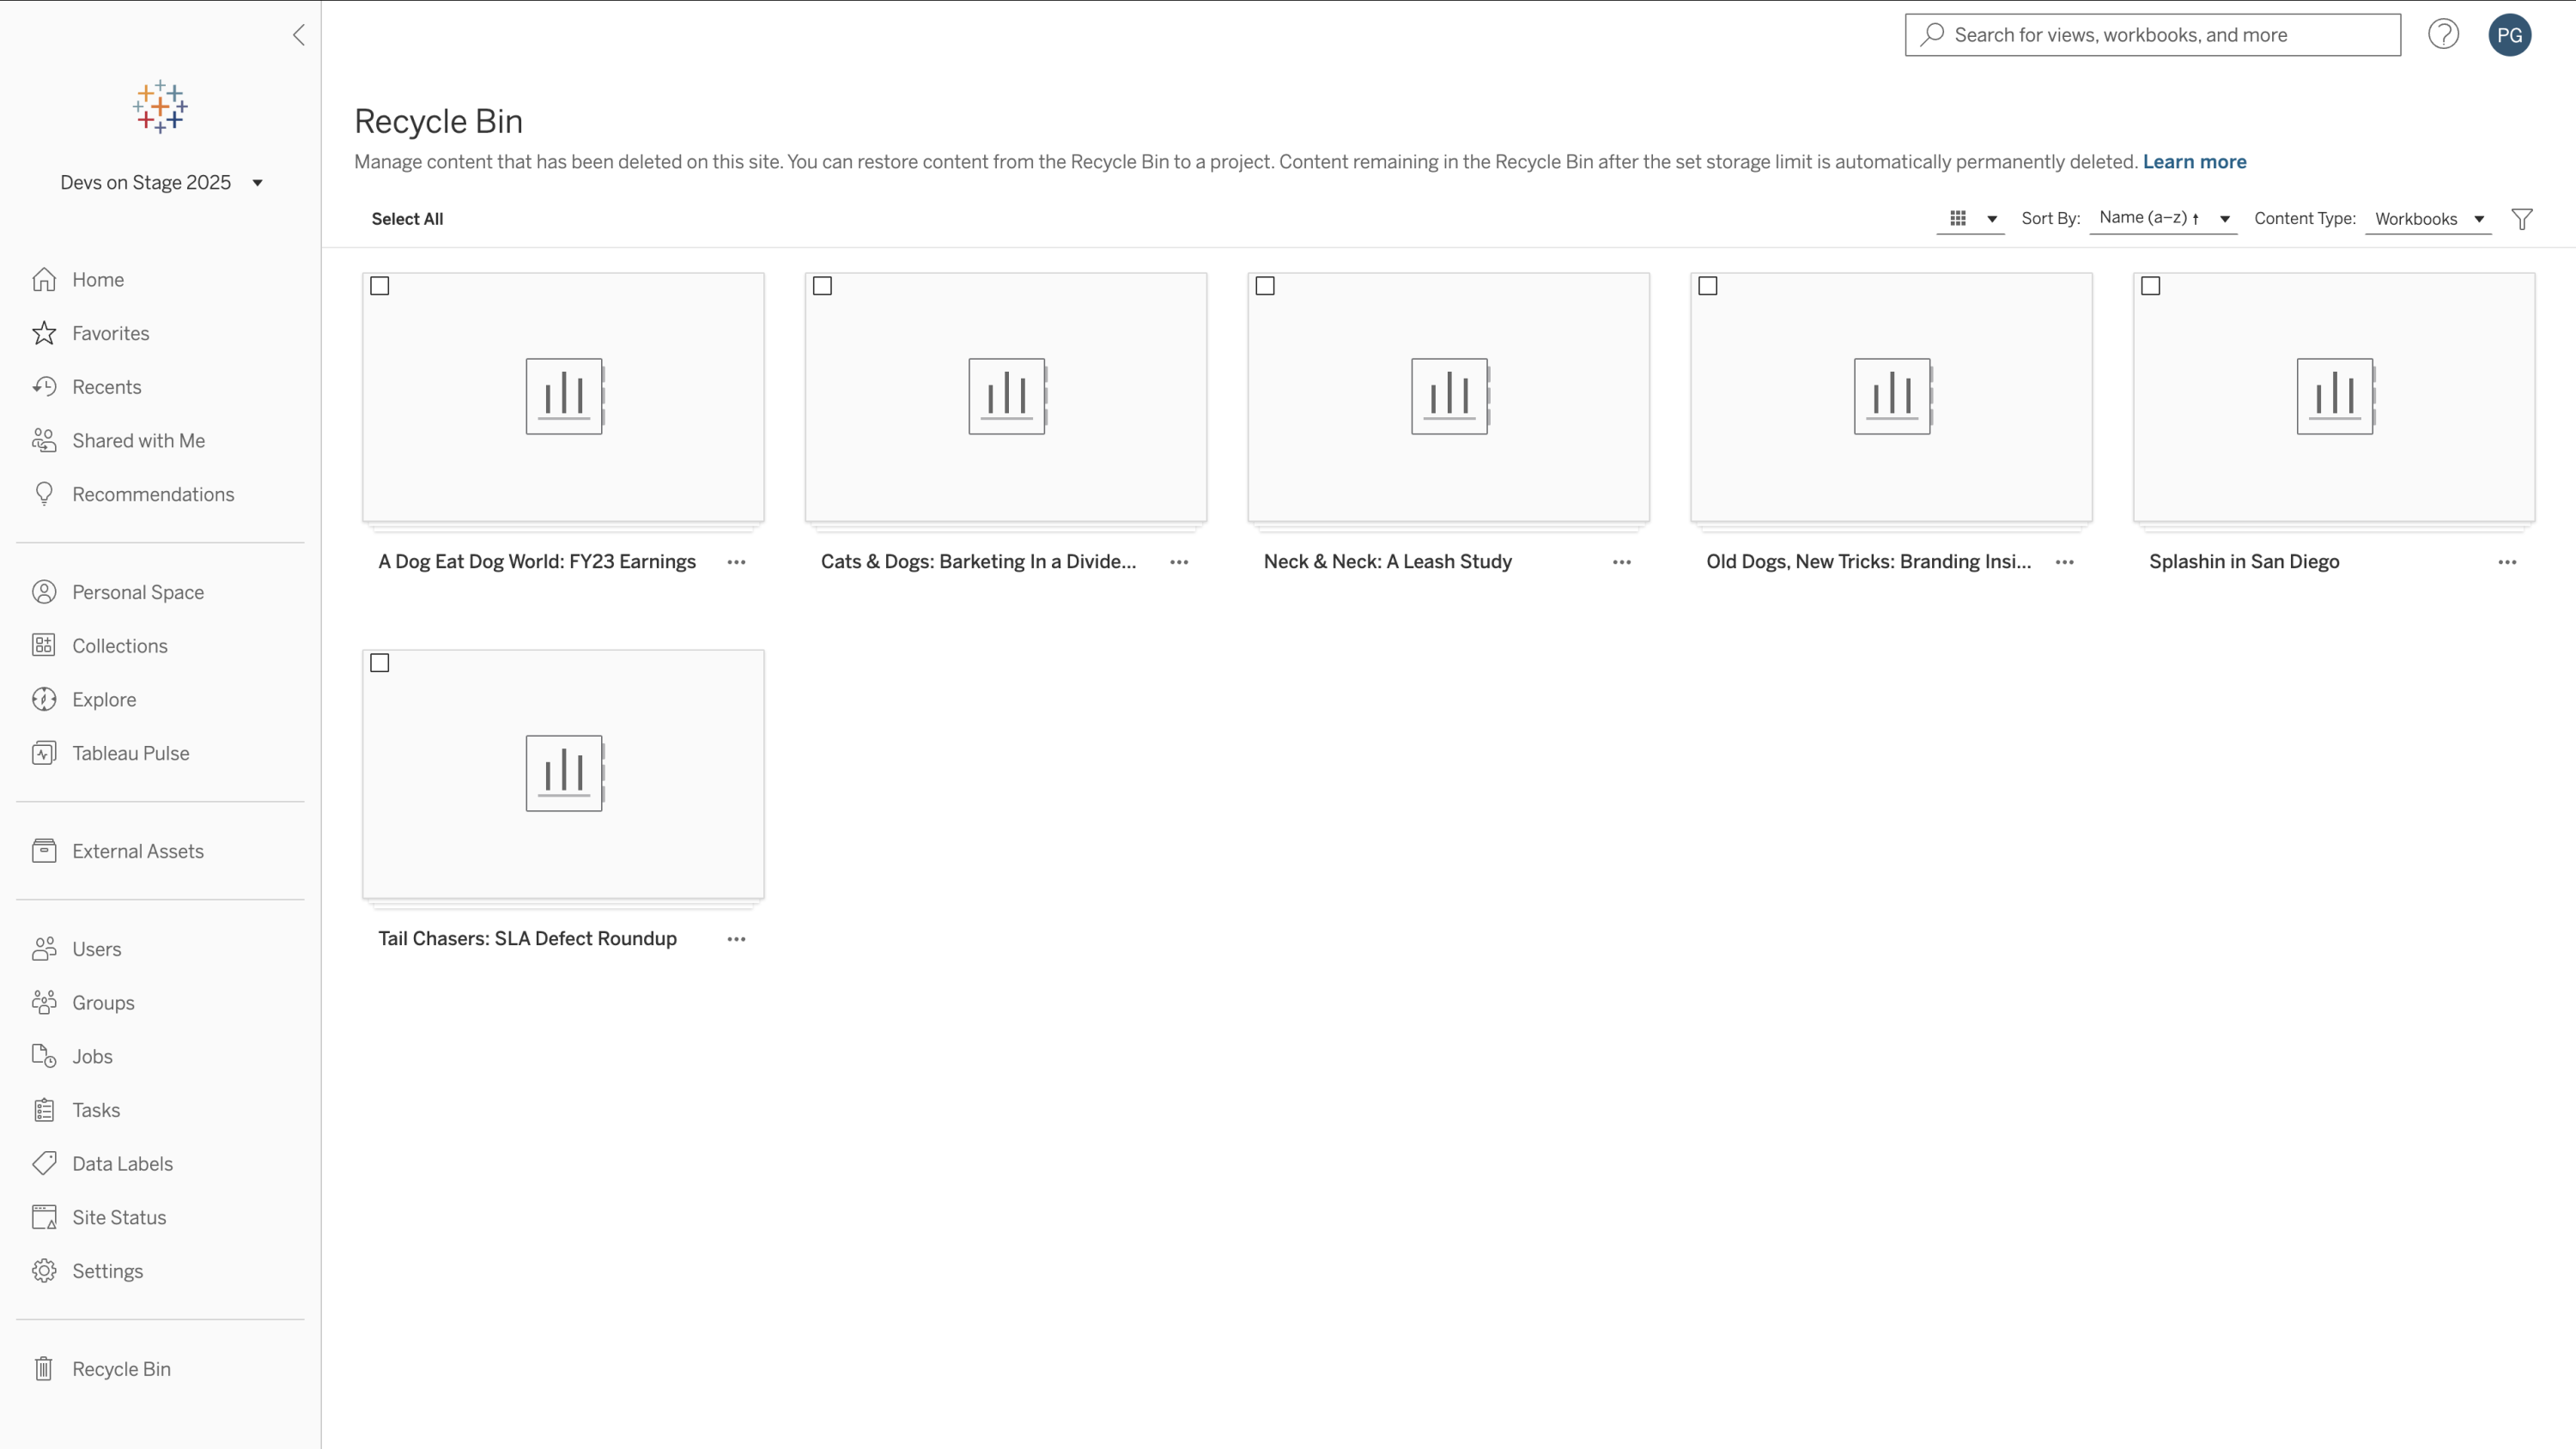
Recycle Bin
You asked, and we’re excited to deliver the Recycle Bin for Tableau Server and Tableau Cloud. Restore deleted projects, data sources, and workbooks for up to 30 days—as easy as “oops, undo!”
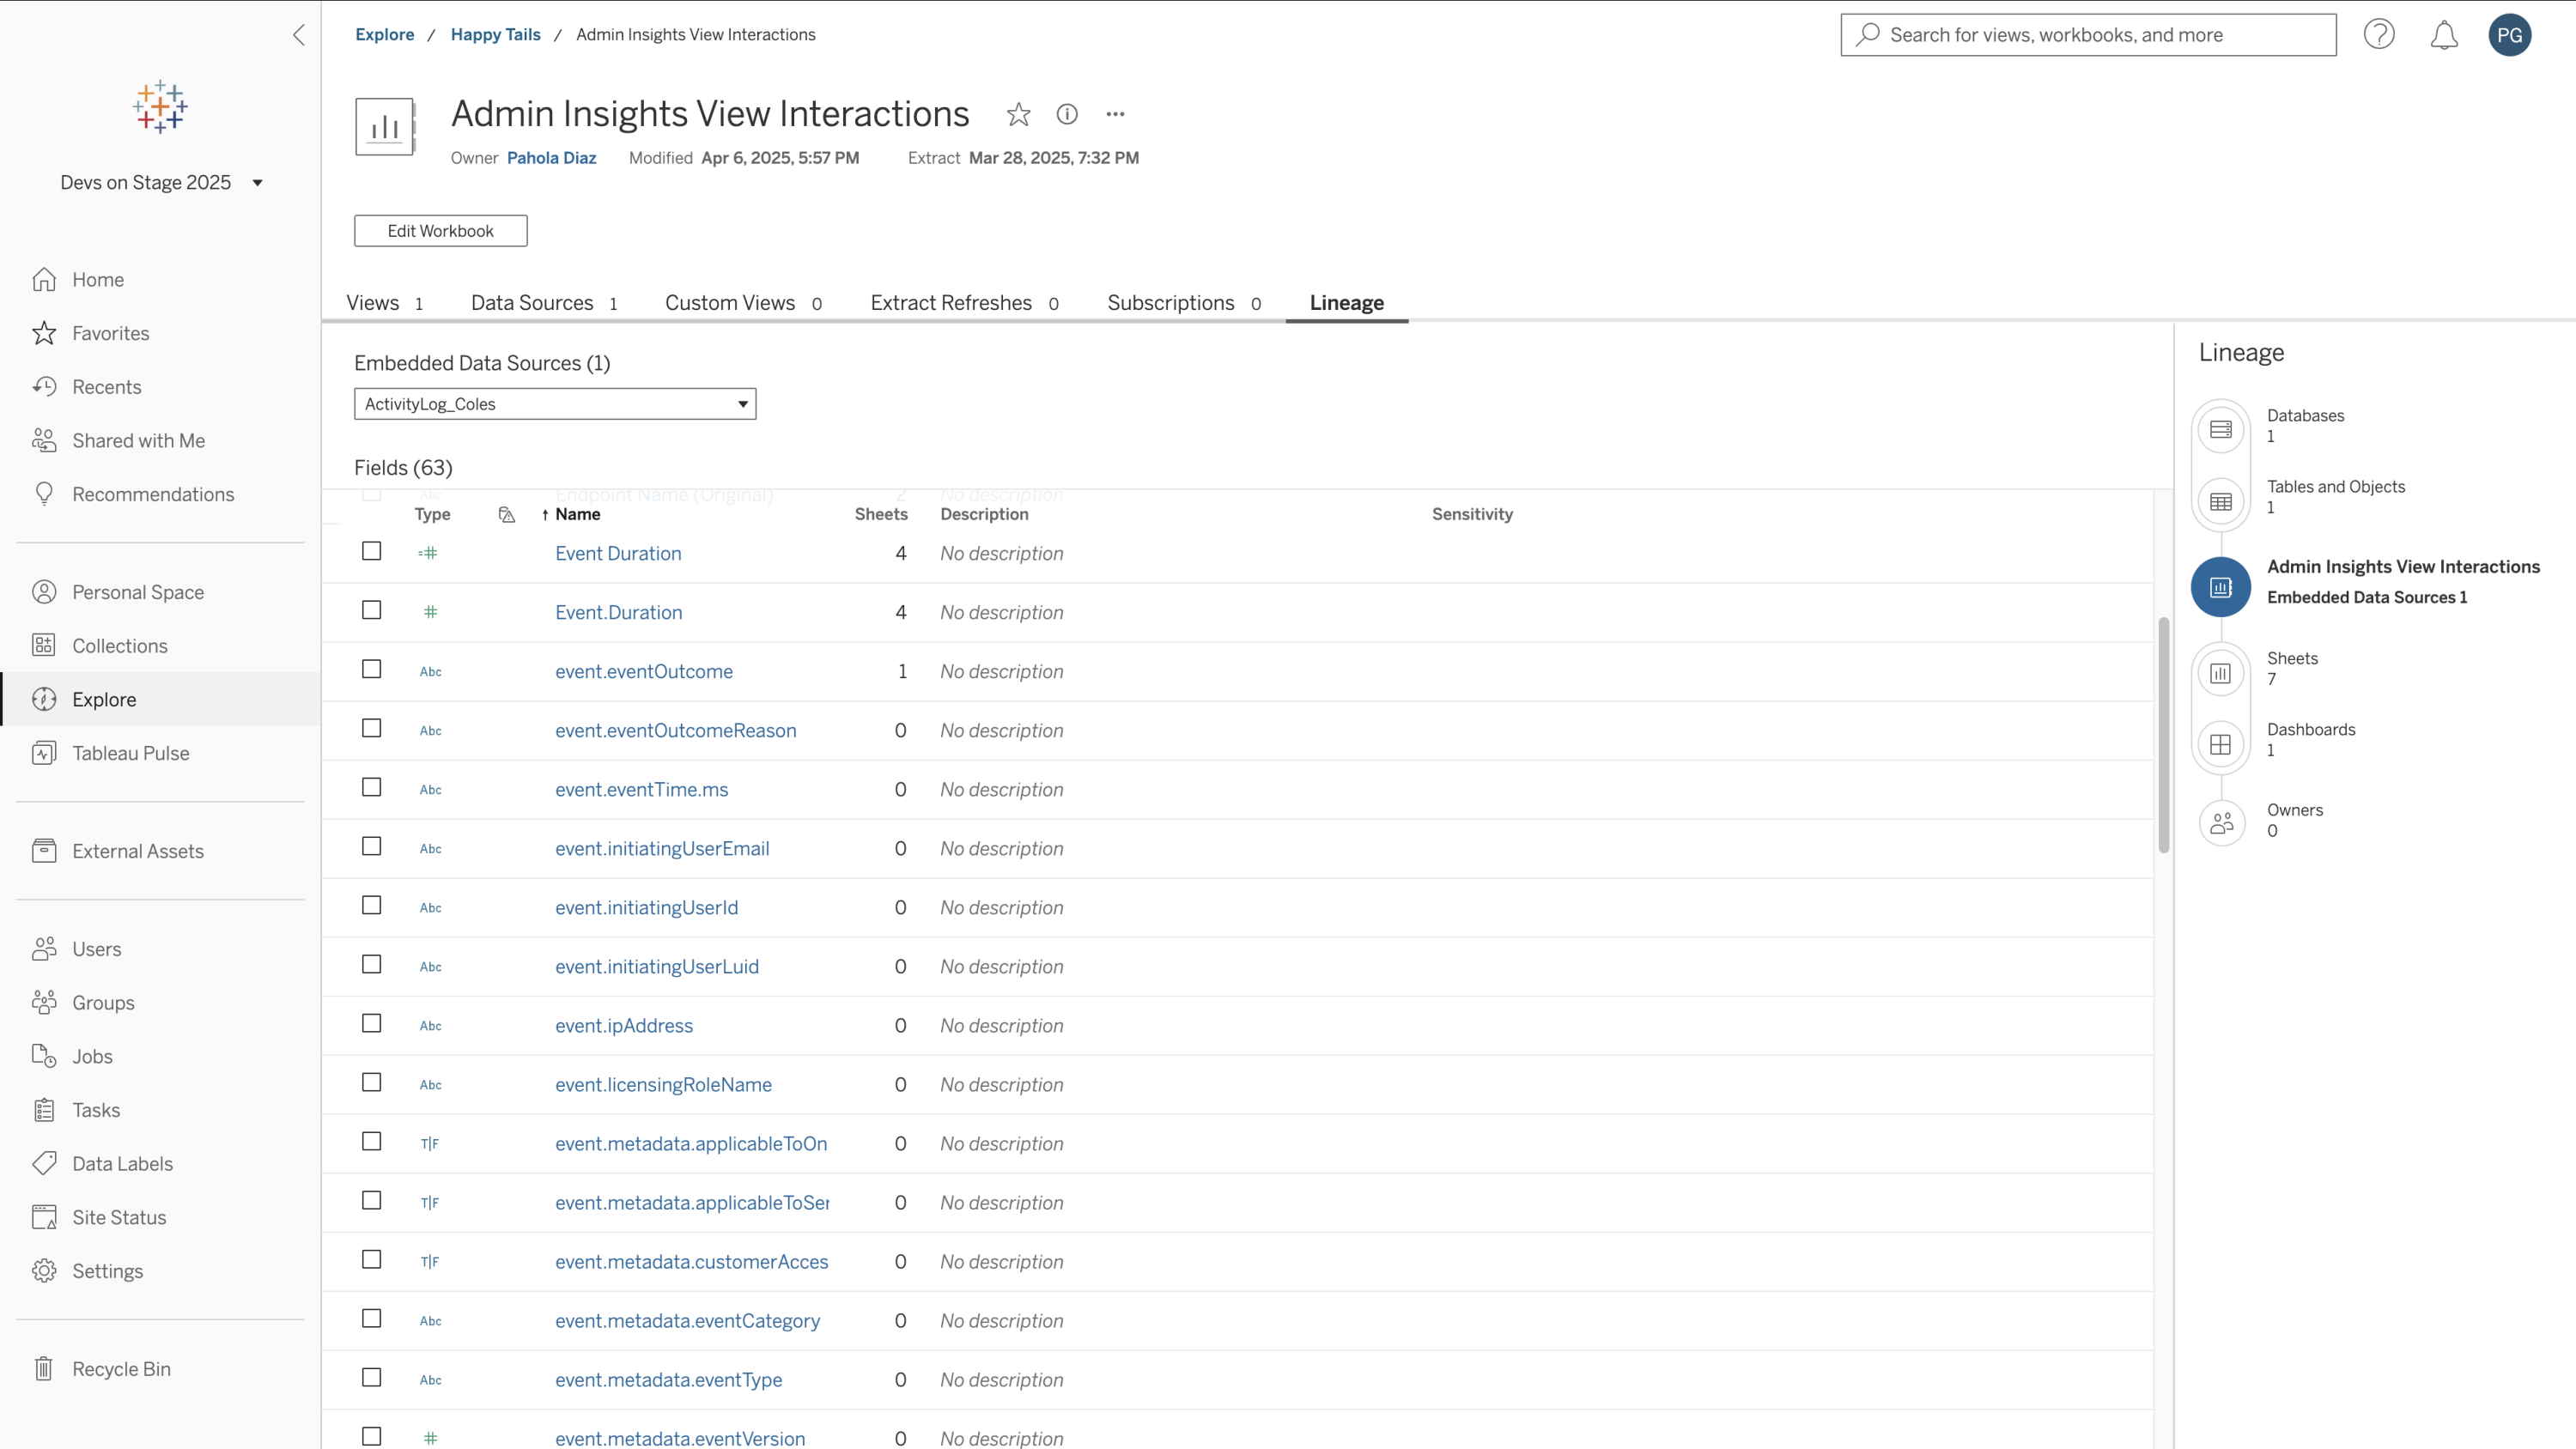
View interaction events in the Activity Log
The Activity Log now captures detailed user journeys and behaviors. See and understand every step from interactions like filtering to processing, exporting, and more.
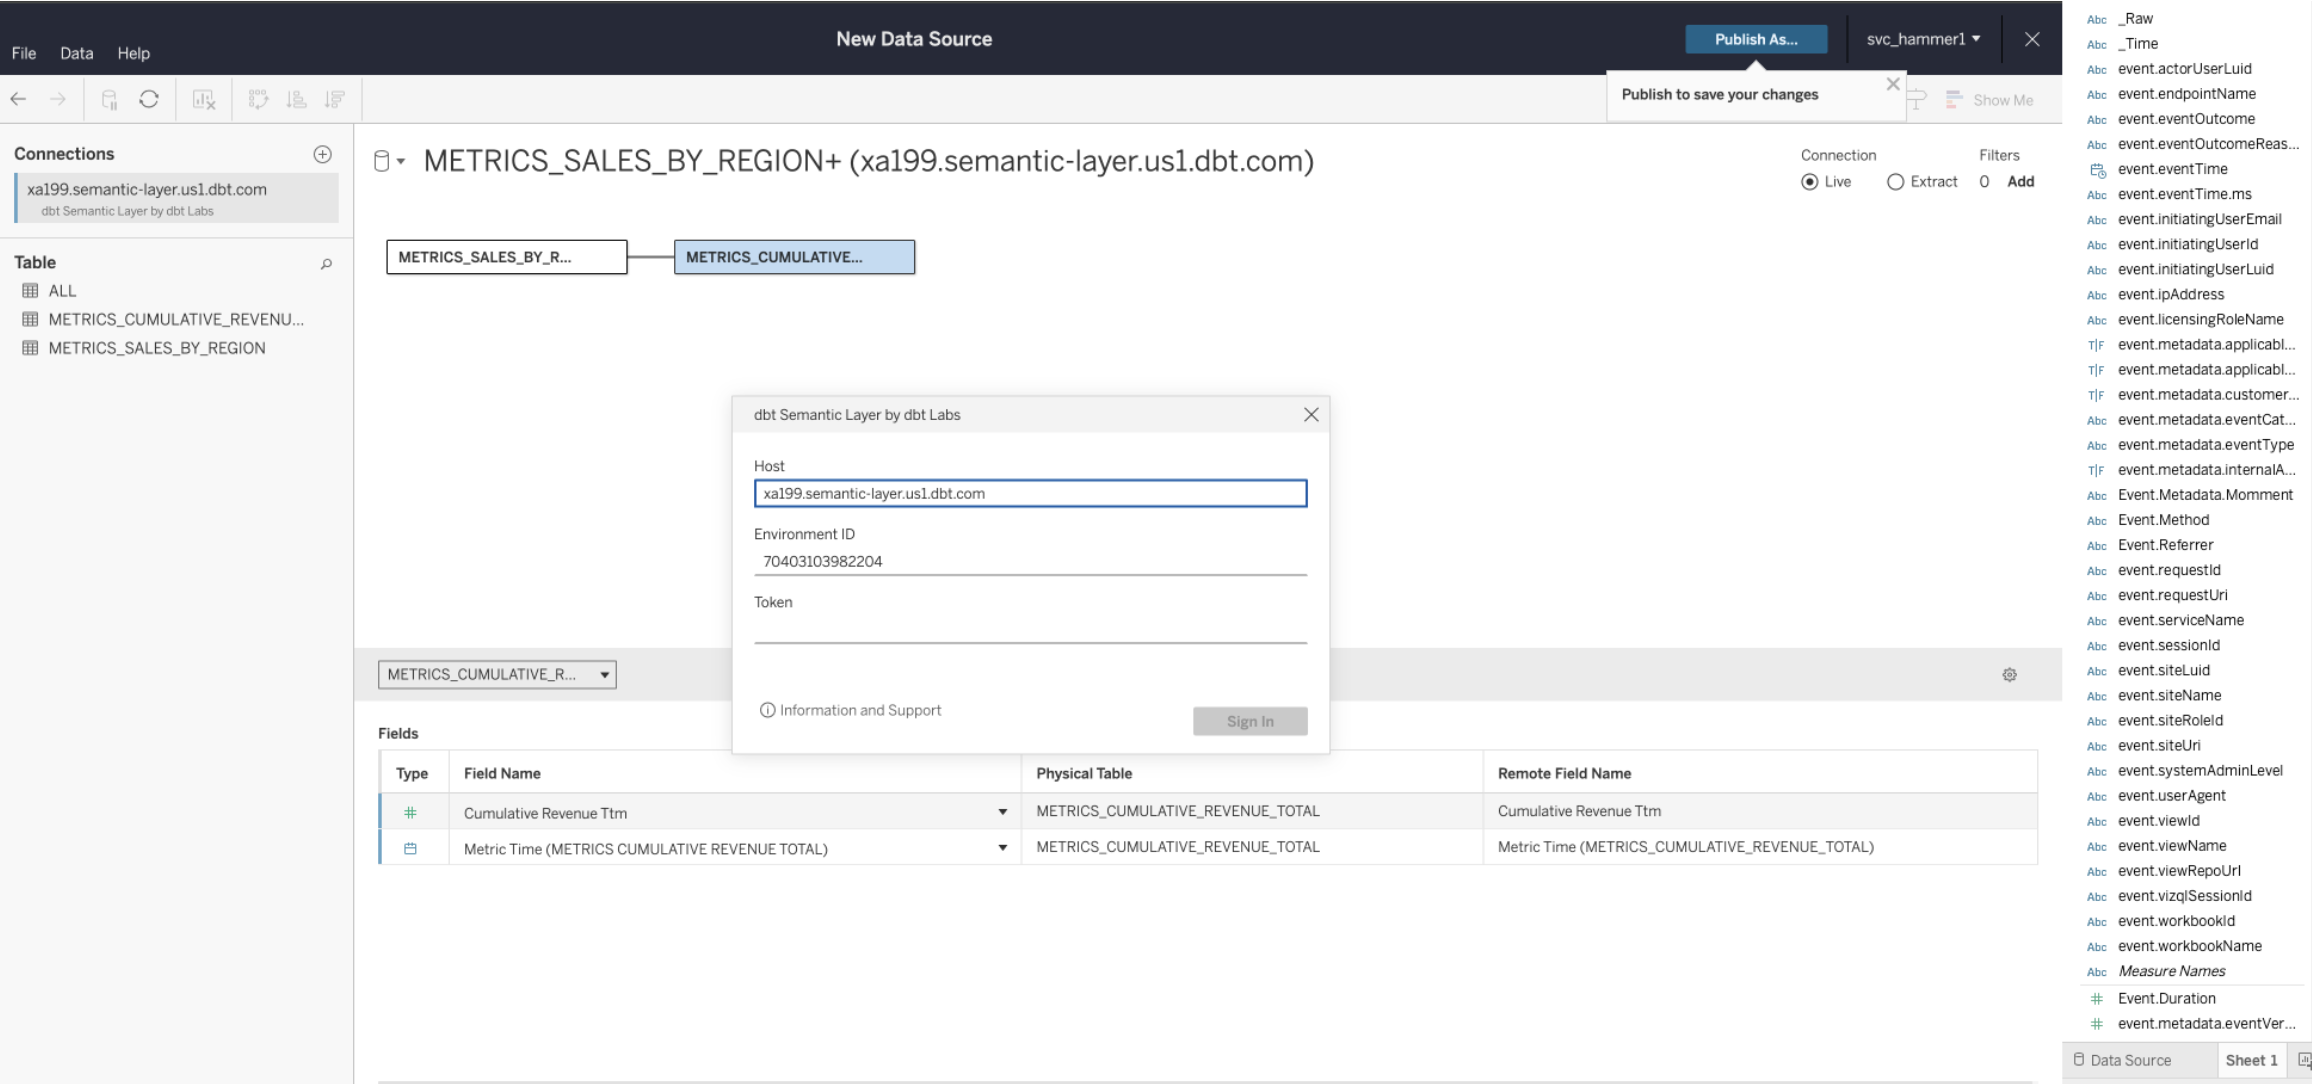
dbt connector to Tableau Cloud
Take advantage of the modeling you’ve already done in dbt. Access your dbt models and metrics in Tableau Cloud.
Google Workspace Add-on
Embed Tableau dashboards and metrics directly where people are working and keep content fresh with a single click. Google Docs and Google Slides are enabled today, with Google Sheets support on our near term roadmap.
Devs on Stage Labs
In a special addition to the programming, viewers also got a preview of some early-stage innovations. These capabilities may or may not make the official Tableau roadmap, but were so cool, we couldn’t resist sharing!
Authoring Extensions API
Empower Creators with the ability to automate anything within Tableau Desktop. For example, create custom solutions to build visualizations, accelerate layouts and formatting, generate interactive walkthroughs, and even automate translating analytics content into other languages.
Tableau Pulse Research Agent
With a click of the “Tell Me Why” button in Tableau Pulse, an AI agent searches internal and external data—from dashboards to news, weather, and even social media—to synthesize a nuanced explanation behind a metric, including citations and actionable next steps.
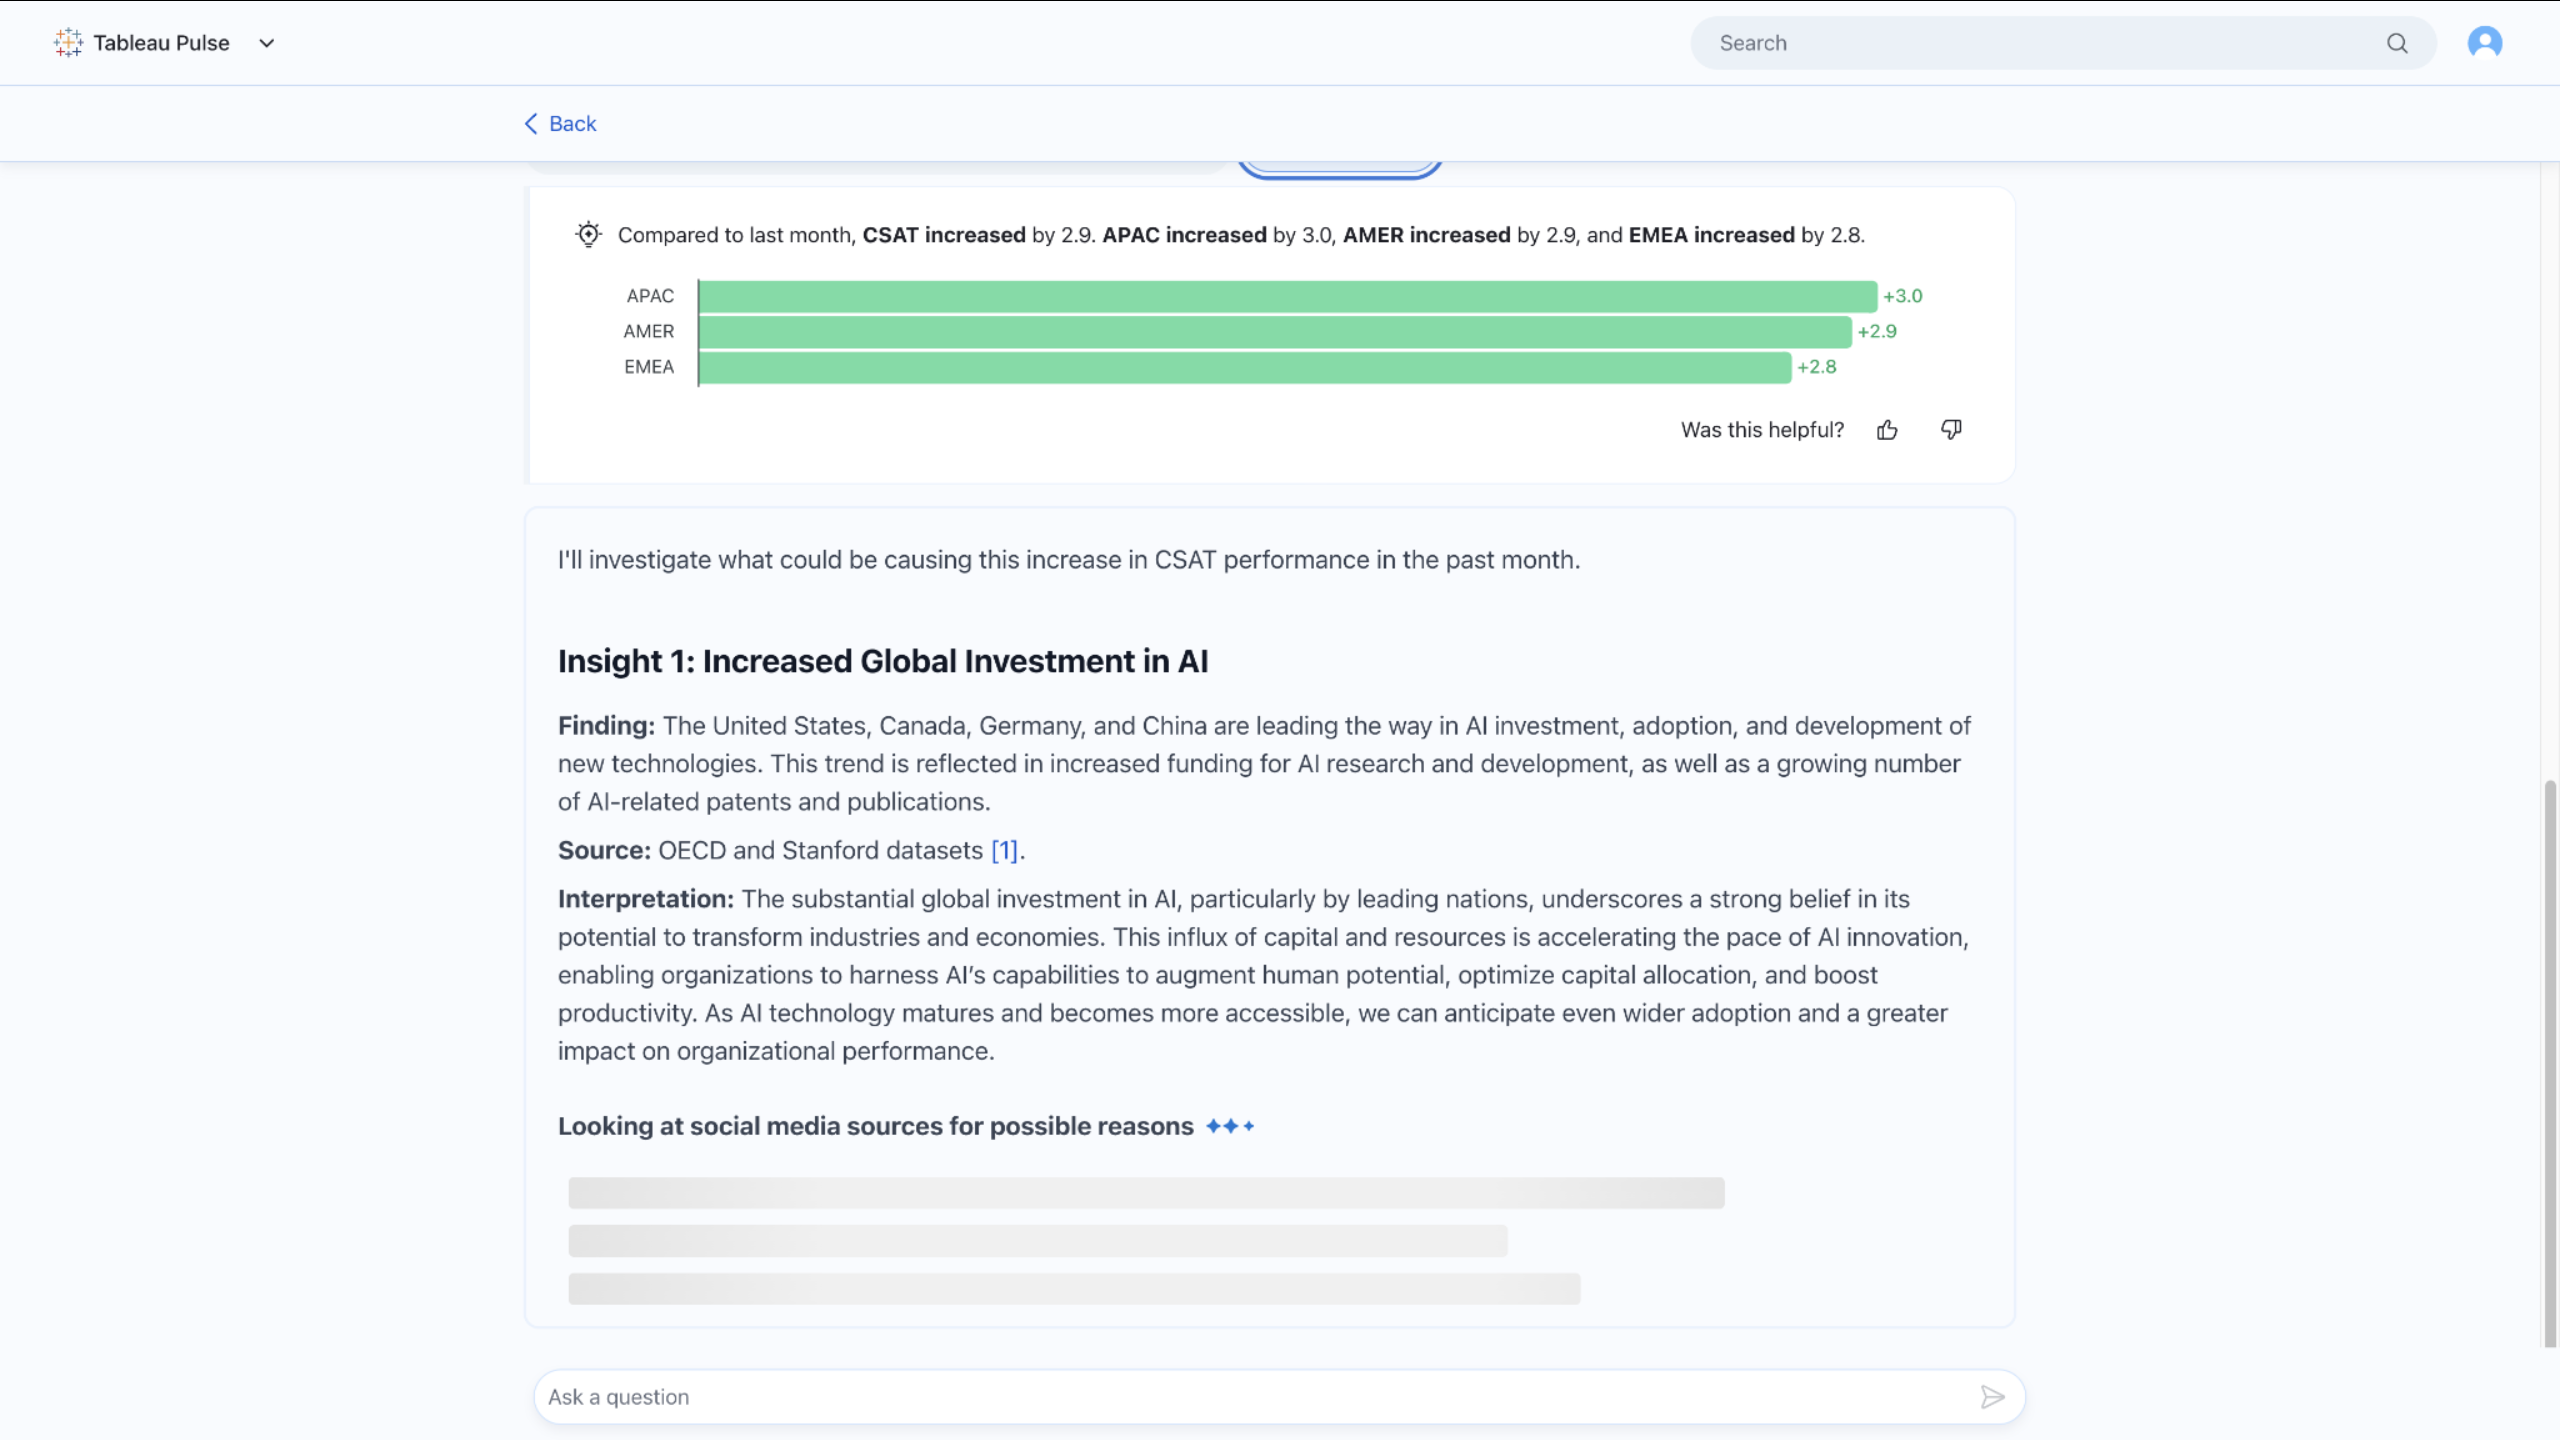
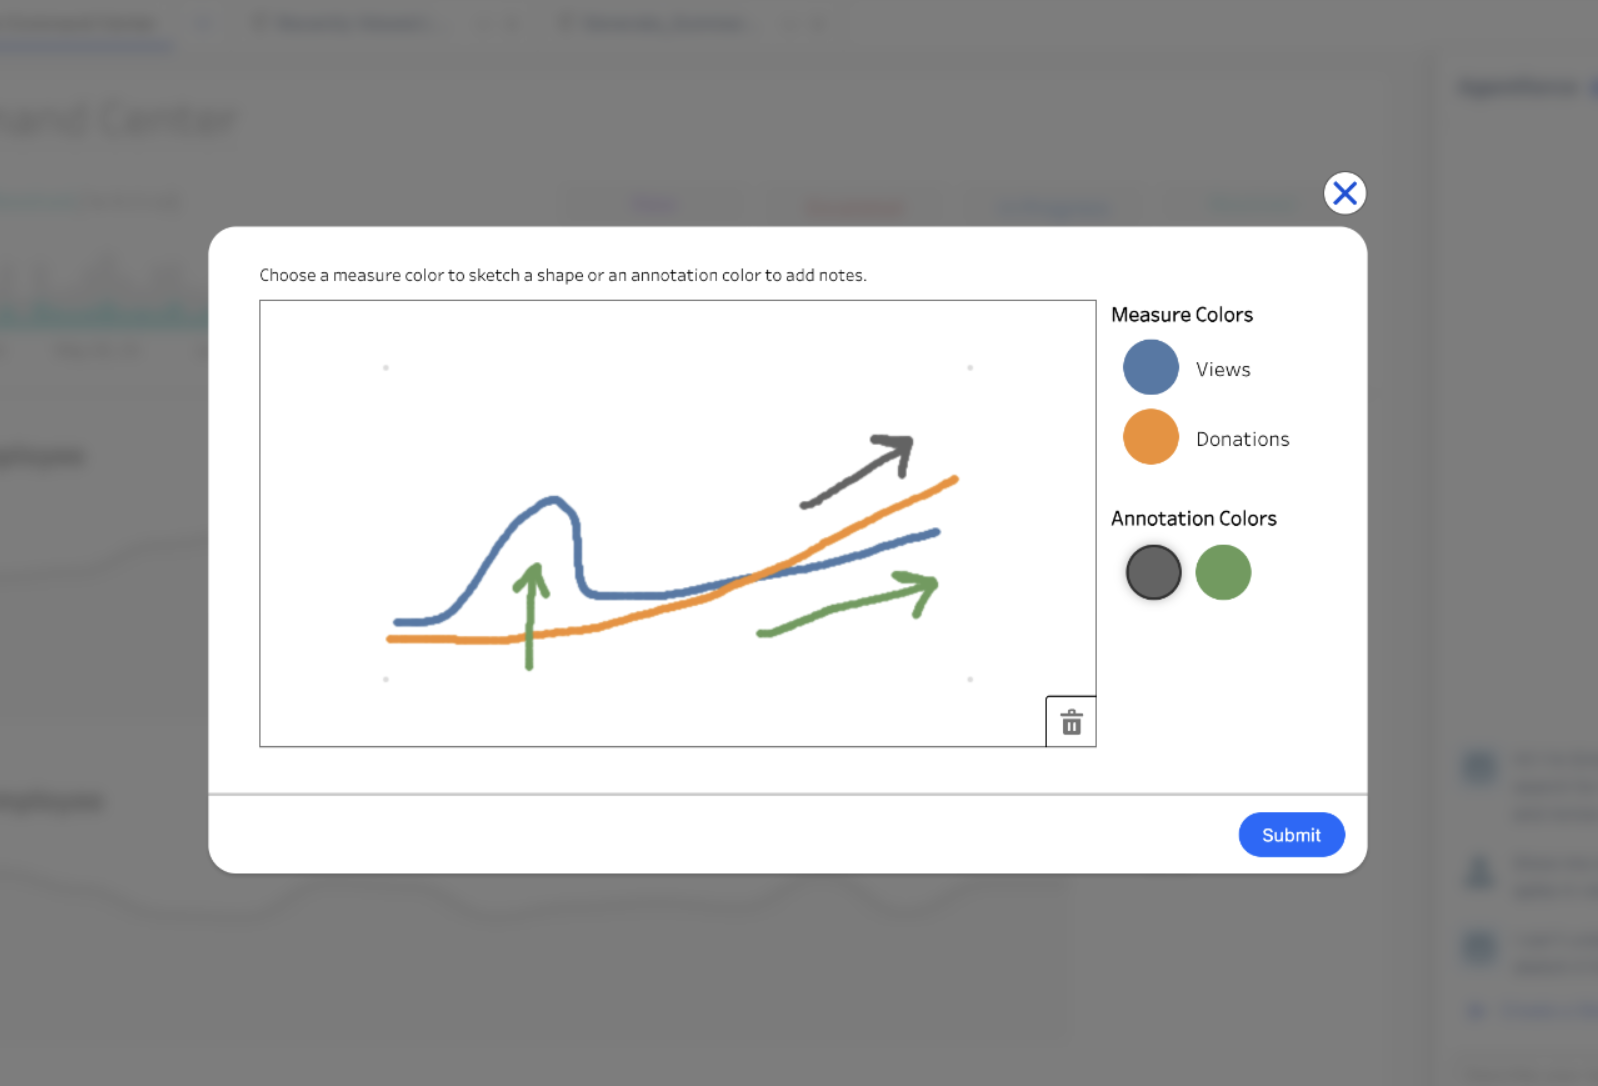
Tableau Sketch
Draw a shape resembling a pattern you’re looking for in your data and Tableau Sketch uses fuzzy matching to filter for results that follow the curve you expressed. From tracking hurricane paths to day trading, the use cases are endless!
Keep the brilliant ideas coming
We're incredibly grateful for the inspiration and feedback provided by our customers, partners, and the Tableau Community over the past two decades. Your contributions are deeply valued, and we're excited for what the future holds. Please continue to share your vision for the future of Tableau by submitting your ideas to the IdeaExchange!
If you missed seeing these new innovations in action, watch Devs on Stage and other TC25 sessions on Salesforce+.
相關文章

The Tableau+ Bundle with Premium AI, Enterprise Capabilities, and Premier Success
 2026/06/24

What is Tableau Prep?
 2026/04/30
Insights Wherever You Work: Meet the Tableau App for Microsoft 365
 2026/03/16