Embed Tableau Pulse In Your Applications


Every additional application you use adds complexity to your workflow. When you switch between tools, you disrupt your productivity, lose valuable context, and open the door for out-of-sync information. That’s why Tableau Embedded Analytics and Tableau Pulse are focused on infusing insights right where you already work. Instead of swiveling between applications to convert insights into action, you can accomplish all you need in one place.
But making data actionable requires more than just making it accessible. The data itself needs to be relevant. Your end-users need an easy way to track metrics at a glance while also having the flexibility to explore those that need attention. That’s where Tableau Pulse comes in. The new embeddable Tableau Pulse web component provides a simple way to get answers from your data with natural language and visual insights. For deeper exploration, a conversational Q&A experience helps your users get all the information they need without leaving your application.
The Tableau Pulse Web Component
The Tableau Pulse web component allows you to embed the insight exploration page into your application in just a couple of lines of code using the Embedding API. For authentication, you can use Connected Apps to provide a secure and seamless way to access the web component. Then, with User Attribute Functions, you can filter content based on user metadata passed through a JSON Web Token to enforce data security policies and provide a personalized view.
<tableau-pulse id="tableauPulse"
src='https://online.tableau.com/site/mysite/pulse/metrics/metric-id'
token='CAtoken'>
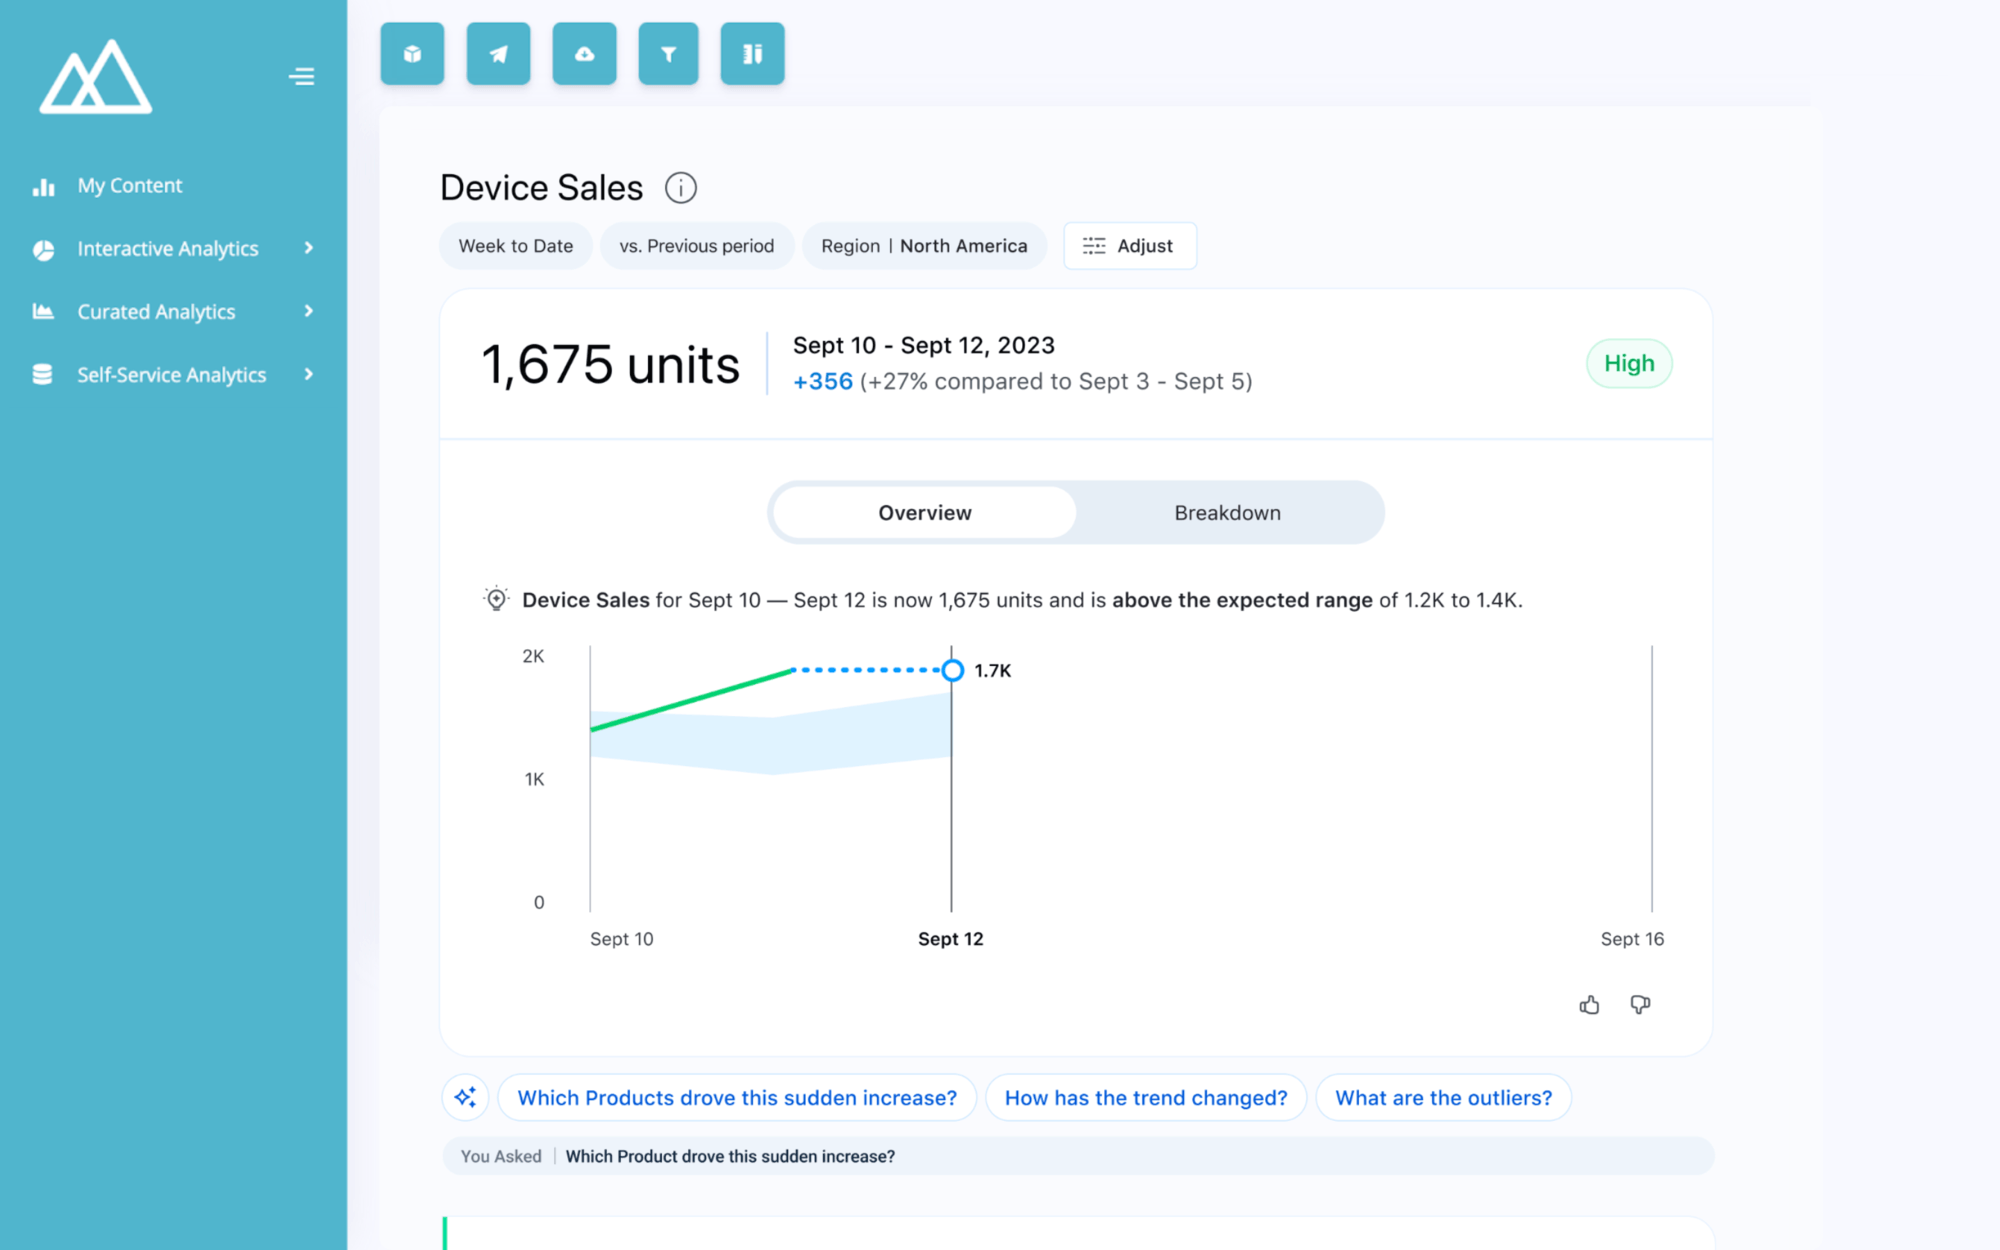
</tableau-pulse>The web component shows a metric’s current and historical values through a sparkline chart and natural language summary, making it easy for your users to keep up with their data at a glance. In the background, Tableau Pulse checks for trends and outliers, flagging any unusual patterns so your users can understand how metrics are trending and if they need closer attention. Tableau Pulse also identifies top contributors and drivers, helping users understand why metrics are trending a certain way. These insights are calculated using statistical algorithms tested for accuracy so you can trust the results. For any remaining questions, your users can use the guided Q&A experience to get answers to recommended prompts.
In addition to the Tableau Pulse web component which is available now, a Tableau Pulse Lightning Web Component is being developed so you can embed the same experience into Salesforce.
Tableau REST API Pulse Methods
Developers will also be able to use the Tableau REST API to programmatically create, update, query, and delete Tableau Pulse metrics and their subscriptions. While you can accomplish the same tasks in the Tableau UI, the Tableau REST API gives you access to the functionality behind Tableau resources to scale and automate tasks.
On top of management, the Tableau REST API can be used in embedded contexts to display content dynamically. Instead of hard-coding which metrics to display for each user, you can create a personalized experience by querying for their subscriptions to display only the metrics the user cares about.
Tableau Pulse is reimagining the analytics experience, and now, with the embeddable web component, you can deliver the same innovation to your users. Get started with Tableau Embedded Analytics and Tableau Pulse.
相關文章

Extend Access to Embedded Tableau Content with On-Demand Access
 2026/07/22
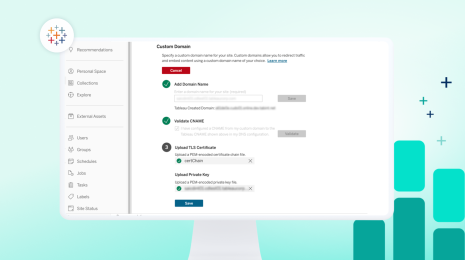
Introducing Tableau Cloud Custom Domains
 2025/08/26

VizQL Data Service: Extend Your Data Beyond Visualizations
 2025/03/19