DataFam Roundup: July 10-14, 2023


Welcome! Dig into this week's DataFam Roundup—a weekly blog that brings together community content all in one post. As always, we invite you to send us your content—and the DataFam content from your peers that have inspired you! Find the content submission form here.
Community Highlight
To recognize new and consistent Tableau contributors—we’re excited to have a section within the weekly DataFam Roundup called the Tableau Community Highlight. Find out how to get involved.

Annie Nelson
New York, USA
Annie Nelson is an Analytics Consultant. She shares her knowledge on Linkedin, YouTube, and TikTok and stays active in the community by participating in community projects and Tableau User Groups.
Before she dove into data analytics as a career, Annie began creating videos on TikTok. She did not set out to gain a large following and after landing her first role in data analytics, she had considered her content creation journey over. However, she began receiving daily messages from viewers stating how helpful her videos were to them in leaving dead-end jobs, switching careers, doubling their salary, etc. which helped her make the decision to keep going. Annie now has almost 70k followers and posts videos multiple times per week about her data journey and to share resources.
Despite her strong fan base on TikTok, Annie’s content focus is now on Linkedin, where she has over 50k followers. Her goal is to be the content creator that she needed when she was trying to get into data. She posts primarily about portfolio building, job searching, soft skills needed to be in data, and creating meaningful dashboards that people actually use.
Annie is also active on YouTube and Tableau Public, posting about similar topics to her other platforms but she believes that she has finally found her niche on each platform which is what has allowed her to be successful.
Connect with Annie on Linkedin, TikTok, YouTube, and Tableau Public.
DataFam content
Dive into content created by the Tableau Community:
-
Dawn Harrington, TechTipsGirl: Apply All Button
-
Salesforce Posse: E26 Analytics Storytelling & Learning Tableau with Zach & Sarah
-
Whitney Wood: Behind the Viz: “Pet Search” with Python and Tableau
-
Will Sutton: Exploring the Unexplored: Build a Winning Data Story with Sebastian Gräff | Behind the Viz
-
Jim Dehner: Order of Operations and Calculations
-
Jared Flores, Put Some Prep in Your Step: New in Tableau 2023.2 - Multi-Row Calculations in Tableau Prep: Put Some Prep In Your Step
-
Sudhir Kulkarni: Data Leadership Collaborative, Why predictive analytics is the future of the retail economy
-
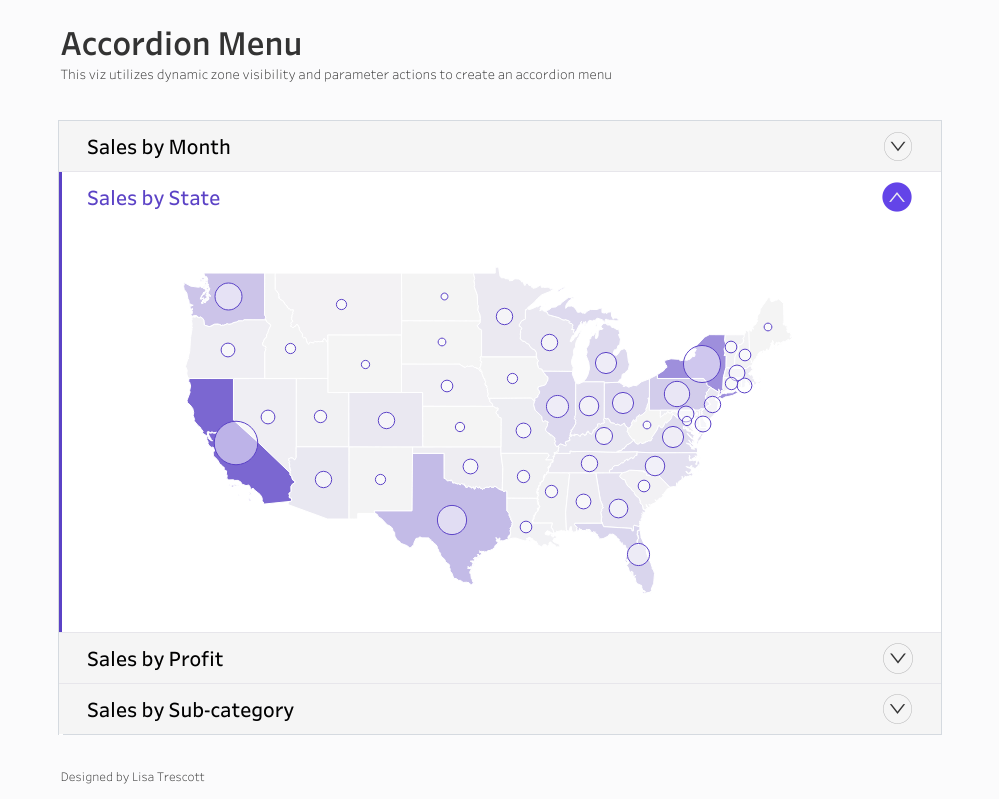
CJ Mayes: Accordion Menus with Lisa Trescott
Team Tableau
Upcoming events and community participation
-
VizIt Sydney is happening October 31 - November 1! A Tableau Community Conference, by the Datafam for the Datafam. Sign up to be the first to know when registration opens and submit to be a speaker now
-
Michelle Frayman, Zak Geis and Nicole Klassen: Viz Feedback Office Hours
-
Data Book Club: This summer, the Data Book Club is reading Living in Data: A Citizen's Guide to a Better Information Future by Jer Thorp.
-
TrailblazerDX ’23 Tableau Quest: Leverage the power of data with the world’s leading analytics platform to drive better business decisions.
-
Community Calendar and Upcoming Events: stay up-to-date on the latest Women in Dataviz events and other data visualization-related events. If you'd like to submit an event to the calendar, please fill out this form.
Vizzes
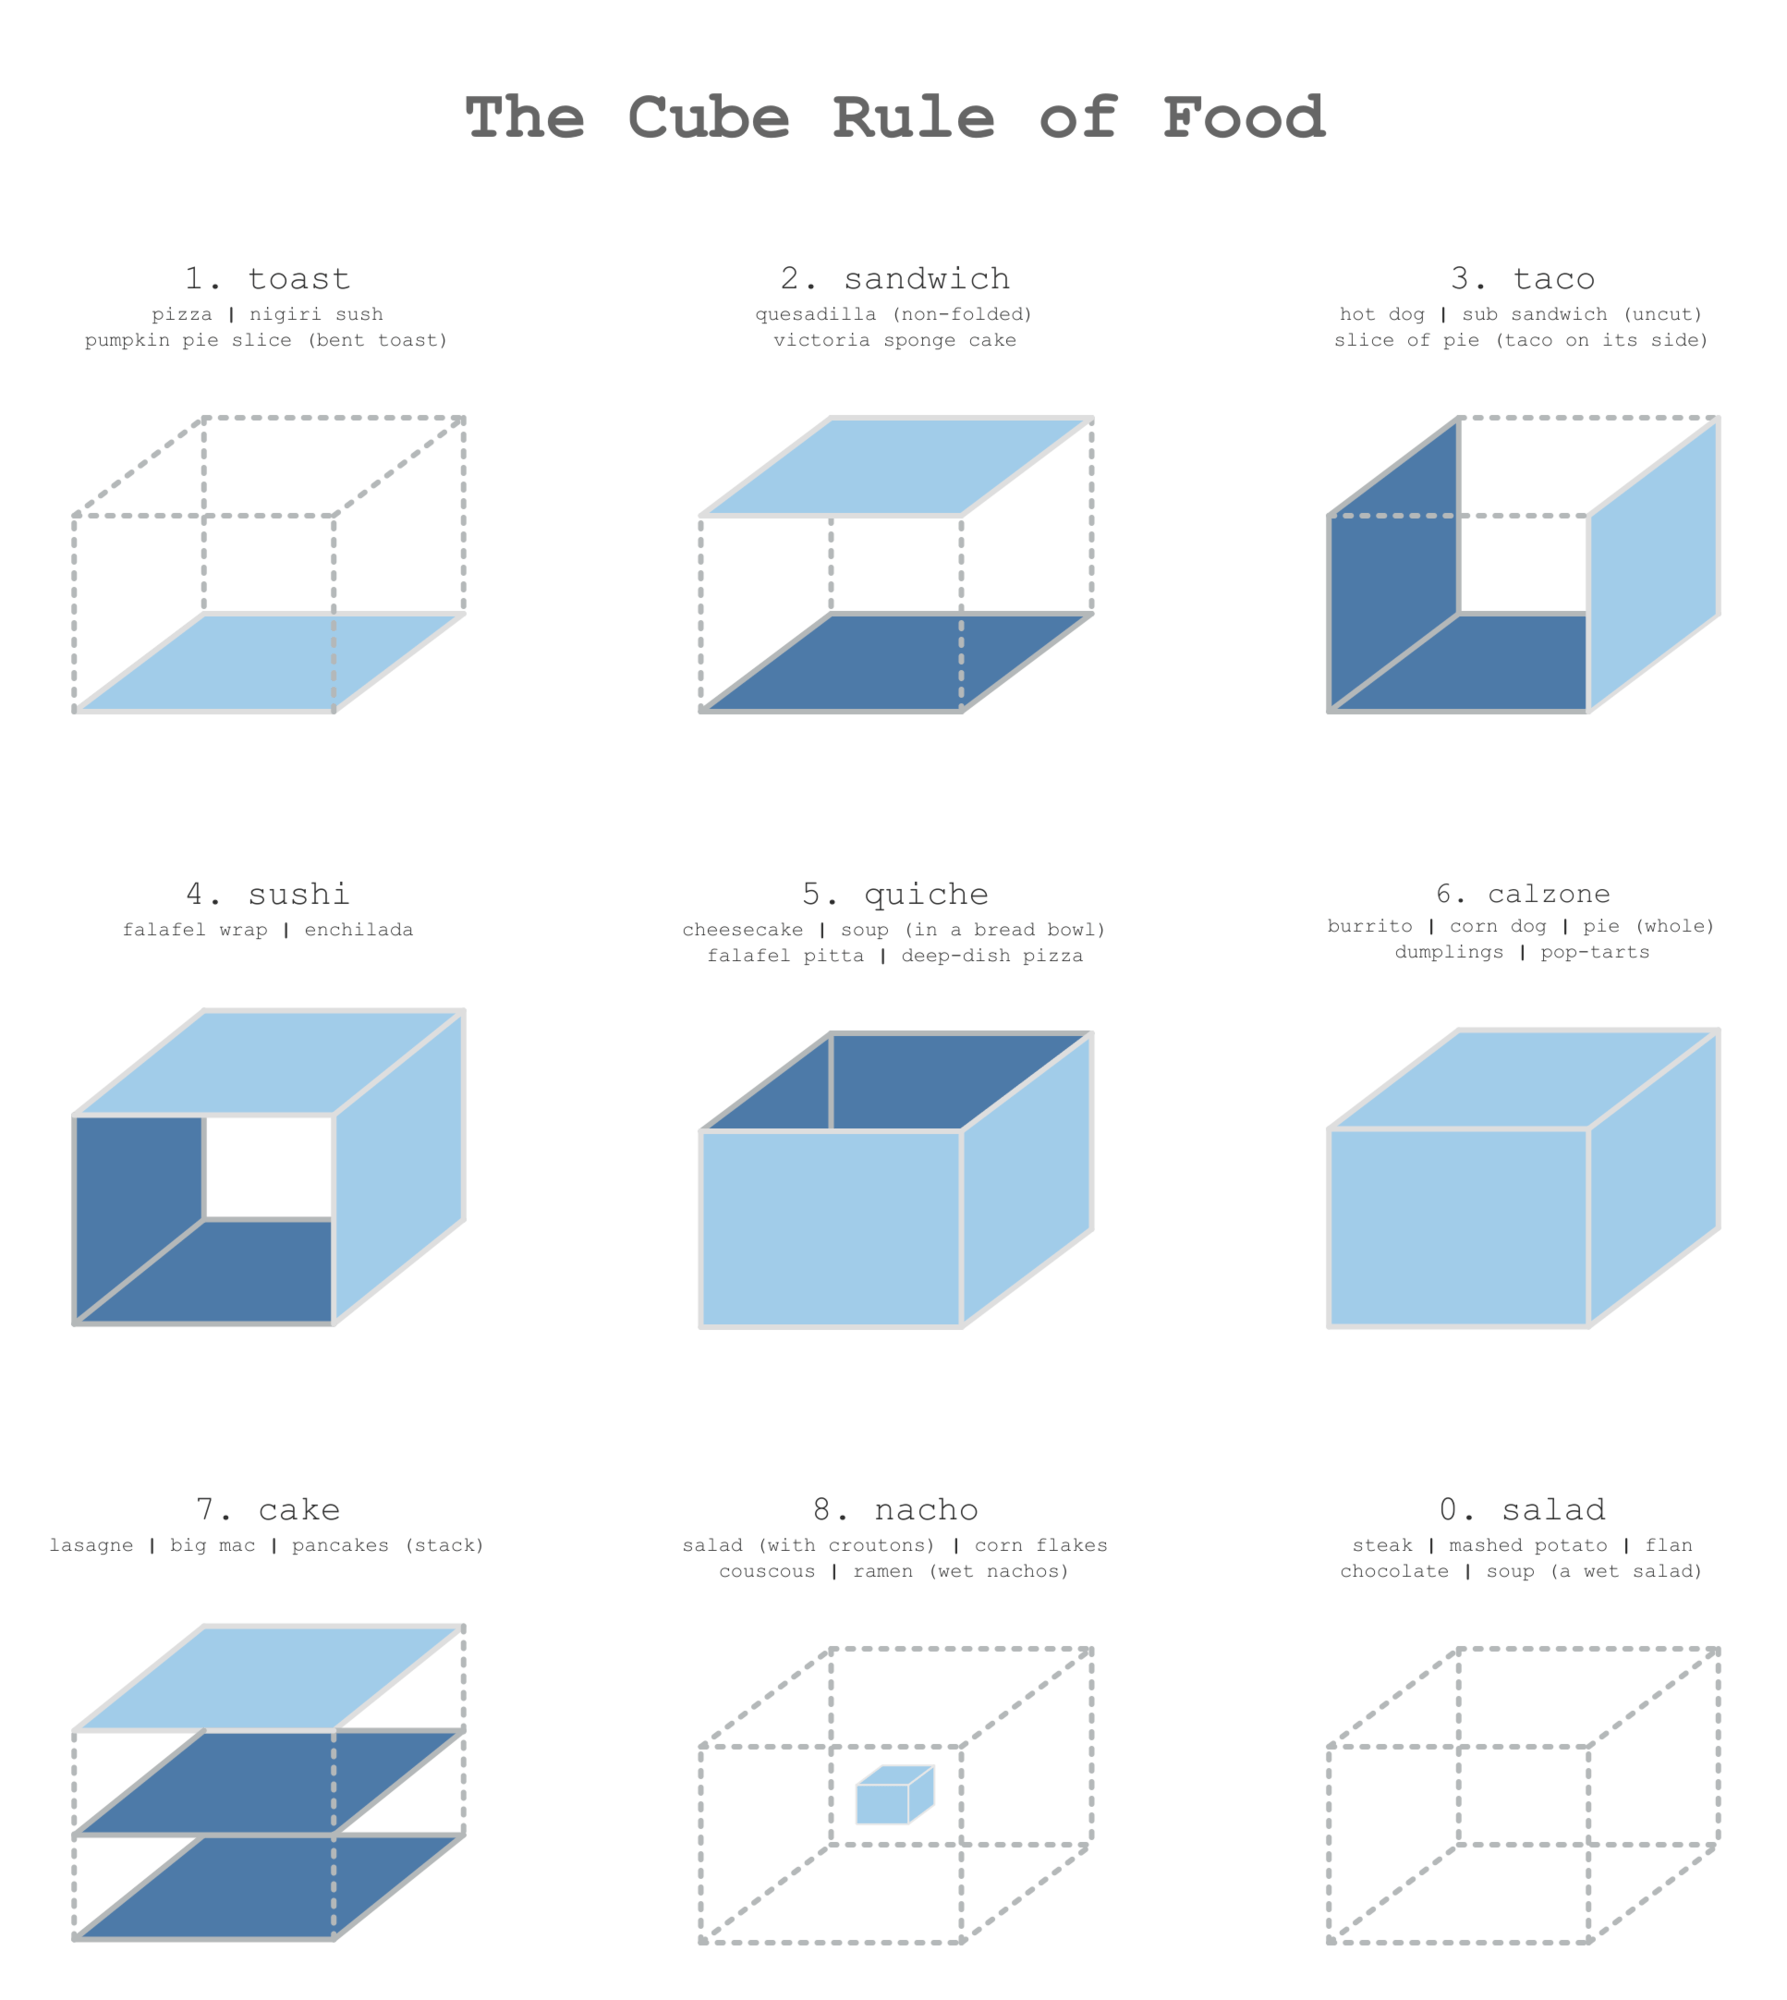
Mo Wootten: The Cube Rule of Food
See the latest Viz of the Day, trending vizzes, featured authors, and more on Tableau Public.
Check out some inspirational vizzes created by the community:
-
Rado Zatovic: HAVE YOU FINISHED THE SERIES? | JOURNEY OF POPULAR TV SHOWS
-
Aakarsh R: Roger Federer - The Maestro
-
Mo Wootten: The Cube Rule of Food
-
Brian Moore: Rubik's Cube
Community Projects
Back 2 Viz Basics
A bi-weekly project helping those who are newer in the community and just starting out with Tableau. Not limited just to newbies!
Web: Back 2 Viz Basics
Twitter: #B2VB
Week 13: Catch-up Week
Workout Wednesday
Build your skills with a weekly challenge to re-create an interactive data visualization.
Web: Workout Wednesday
Twitter: #WOW2022
Week 28: Can you Show & Hide Legends?
Makeover Monday
A weekly social data project.
Web: Makeover Monday
Twitter: #MakeoverMonday
Week 28: The Henley Global Passport Index
Preppin' Data
A weekly challenge to help you learn to prepare data and use Tableau Prep.
Web: Preppin’ Data
Twitter: #PreppinData
Week 27: The Cost of Running the Prep School
DataFam Con
A monthly challenge covering pop culture and fandoms.
Web: DataFam Con
Twitter: #DataFamCon
April 2023: Kids Month!
EduVizzers
A monthly project connecting real education data with real people.
Web: Eduvizzers
July 2023: NYC SAT (College Board) 2010 School Level Results
Games Night Viz
A monthly project focusing on using data from your favorite games.
Web: Games Nights Viz
Twitter: #GamesNightViz
Level 6: The Final Boss
Iron Quest
Practice data sourcing, preparation, and visualization skills in a themed monthly challenge.
Web: Iron Quest
Twitter: #IronQuest
Advanced Chart Types
Storytelling with Data
Practice data visualization and storytelling skills by participating in monthly challenges and exercises.
Web: Storytelling with Data
Twitter: #SWDChallenge
July 2023: bring on the bubbles
Project Health Viz
Uncover new stories by visualizing healthcare data sets provided each month.
Web: Project Health Viz
Twitter: #ProjectHealthViz
June 2023: Funding for Research for Various Conditions and Diseases
Diversity in Data
An initiative centered around diversity, equity & awareness by visualizing provided datasets each month.
Web: Diversity in Data
Twitter: #DiversityinData
May 2023: Mental Health Awareness Month and LGBTQ+ Representation in film
Sports Viz Sunday
Create and share data visualizations using rich, sports-themed data sets in a monthly challenge.
Web: Sports Viz Sunday
Twitter: #SportsVizSunday
January 2023: Is it a Sport or a Game?
Viz for Social Good
Volunteer to design data visualizations that help nonprofits harness the power of data for social change.
Web: Viz for Social Good
Twitter: #VizforSocialGood
June 9 - July 18, 2023: Gord Downie & Chanie Wenjack Fund
Real World Fake Data
Create business dashboards using provided data sets for various industries and departments.
Web: Real World Fake Data
Twitter: #RWFD
Session 5: Diversity Score Card
Data Plus Music
A monthly project visualizing the data behind the music we love!
Web: Data Plus Music
Twitter: #DataPlusMusic
相關文章

DataFam Roundup June 2026

DataFam Roundup May 2026

Iron Viz 2026: Read Between the Data
 2026/05/28