DataFam Roundup: April 10-14, 2023


Welcome! Dig into this week's DataFam Roundup—a weekly blog that brings together community content all in one post. As always, we invite you to send us your content—and the DataFam content from your peers that have inspired you! Find the content submission form here.
Community Highlight
To recognize new and consistent Tableau contributors—we’re excited to have a section within the weekly DataFam Roundup called the Tableau Community Highlight. Find out how to get involved.

Candice Che, Finance Data Viz Lead at Woolworths Group
Sydney, Australia
Candice Che is the Finance Data Viz Lead at Woolworths Group. She enjoys participating in Tableau community projects that serve as a medium for her artistic expression. In these instances, Candice creates artwork using tools such as Figma and Procreate, which she then uses as background images for her dashboards.
Candice’s favorite part of the DataFam is how generous everyone is in sharing their learnings and feedback. Candice gives back to the community through the Tableau Forums, through her new blog, and by sharing tips through Twitter. She has also participated in community projects such as Viz for Social Good, Iron Quest, Games Nights Viz, and Project Health Viz.
In the near future, Candice hopes to begin a project that brings together her interests of gaming and East Asian cultures with her Procreate artwork. Her long term goal is to eventually participate in IronViz and speak at Tableau Conference but in the interim, Candice plans on continuing to build her brand through her blog and Linkedin and become more involved in the community.
Connect with Candice on Linkedin, Twitter, and Tableau Public.
DataFam content
Yamil Medina: Off the Chart Jokes
Dive into content created by the Tableau Community:
- Marc Reid, datavis blog: Dynamic Field Formatting in Tableau
- Andy Kriebel, LinkedIn: 3 Types of Spatial Analysis
- Sarah Bartlett, The Data Leadership Collaborative: Five Strategies to Drive Stronger Data Culture
- Andrés A. Quiroz Sanchez, LinkedIn: Clase 2 Acción de Parámetro
- Yamil Medina: Off the Chart Jokes
- The Data Leadership Collaborative: The Mid-Career Possibilities of a Data Career
- Alex Eskinasy: Monetise better: Charge more for additional value with Tableau User Attribute Functions
- Kevin Wee: Tableau x Figma
- Kevin Flerlage, The Flerlage Twins: 23 Simple Tips to Polish Your Dashboards
Upcoming events and community participation
-
Data Leadership Collaborative (DLC) Networking Hour: Expand your network at an event designed to help facilitate connections among Data Leaders.
-
TrailblazerDX ’23 Tableau Quest: Leverage the power of data with the world’s leading analytics platform to drive better business decisions.
-
Community Calendar and Upcoming Events: stay up-to-date on the latest Women in Dataviz events and other data visualization-related events. If you'd like to submit an event to the calendar, please fill out this form.
Vizzes
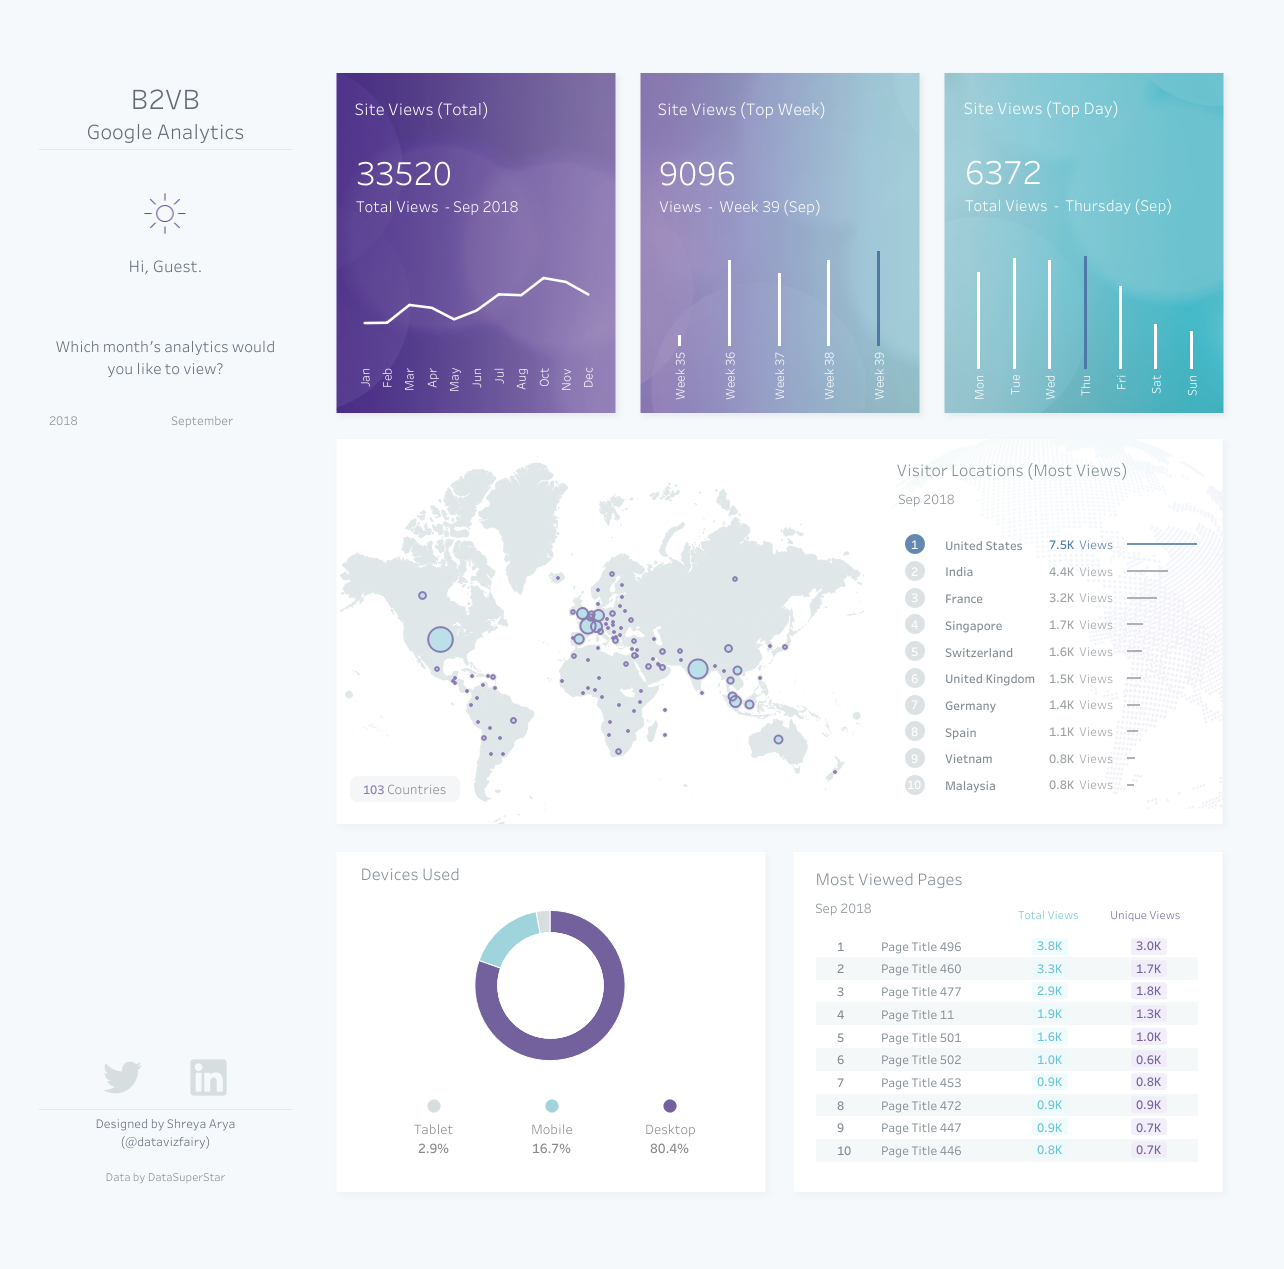
Shreya Arya: B2VB Google Analytics Dashboard | Back 2 Viz Basics
See the latest Viz of the Day, trending vizzes, featured authors, and more on Tableau Public.
Check out some inspirational vizzes created by the community:
-
Nick van Lieshout: Football (Soccer) Performance Dashboard | Jong PSV (live)
-
Lindsay Betzendahl: US State Kindergarten Requirements
- Shreya Arya: B2VB Google Analytics Dashboard | Back 2 Viz Basics
- Sebben Insights: Visual Report #3 - Avian Influenza Overview
- Chimdi Nwosu: Hate Crime in Chicago 2012 - 2022
-
Liwia Wagner: #MakeoverMonday Week 15.2023
Community Projects
Back 2 Viz Basics
A bi-weekly project helping those who are newer in the community and just starting out with Tableau. Not limited just to newbies!
Web: Back 2 Viz Basics
Twitter: #B2VB
Week 7: Create a Ranked Table
Workout Wednesday
Build your skills with a weekly challenge to re-create an interactive data visualization.
Web: Workout Wednesday
Twitter: #WOW2022
Week 15: Can you create Digital Signage with Tableau?
Makeover Monday
A weekly social data project.
Web: Makeover Monday
Twitter: #MakeoverMonday
Week 15: The DougScore
Preppin' Data
A weekly challenge to help you learn to prepare data and use Tableau Prep.
Web: Preppin’ Data
Twitter: #PreppinData
Week 15: Easter Dates
DataFam Con
A monthly challenge covering pop culture and fandoms.
Web: DataFam Con
Twitter: #DataFamCon
April 2023: Kids Month!
EduVizzers
A monthly project connecting real education data with real people.
Web: Eduvizzers
April 2023: Open Database of Educational Facilities in Canada (ODEF)
Games Night Viz
A monthly project focusing on using data from your favorite games.
Web: Games Nights Viz
Twitter: #GamesNightViz
Level 6: The Final Boss
Iron Quest
Practice data sourcing, preparation, and visualization skills in a themed monthly challenge.
Web: Iron Quest
Twitter: #IronQuest
Storytelling with Data
Practice data visualization and storytelling skills by participating in monthly challenges and exercises.
Web: Storytelling with Data
Twitter: #SWDChallenge
April 2023: design in light and dark
Project Health Viz
Uncover new stories by visualizing healthcare data sets provided each month.
Web: Project Health Viz
Twitter: #ProjectHealthViz
April 2023: The Lown Institute Hospital Index on Equity
Diversity in Data
An initiative centered around diversity, equity & awareness by visualizing provided datasets each month.
Web: Diversity in Data
Twitter: #DiversityinData
April 2023: Arab American Heritage Month & Language
Sports Viz Sunday
Create and share data visualizations using rich, sports-themed data sets in a monthly challenge.
Web: Sports Viz Sunday
Twitter: #SportsVizSunday
January 2023: Is it a Sport or a Game?
Viz for Social Good
Volunteer to design data visualizations that help nonprofits harness the power of data for social change.
Web: Viz for Social Good
Twitter: #VizforSocialGood
Apr 18, 2023: World Health Organization (WHO)
Real World Fake Data
Create business dashboards using provided data sets for various industries and departments.
Web: Real World Fake Data
Twitter: #RWFD
Session 5: Diversity Score Card
Data Plus Music
A monthly project visualizing the data behind the music we love!
Web: Data Plus Music
Twitter: #DataPlusMusic
相關文章

DataFam Roundup June 2026

DataFam Roundup May 2026

Iron Viz 2026: Read Between the Data
 2026/05/28