New browsing experience with mixed content types


Update: This feature is now available! Check out the latest release of Tableau.
Exploring and analyzing data sometimes requires our customers to navigate a large repository of content. It's crucial that they can find their way around as intended by the way they organize their data and content—so we’re introducing a new browsing experience with mixed content types in Tableau Online and Tableau Server with our 2019.1 release.
Take advantage of your project structure
With a new browsing experience, we bring you a better way to take advantage of how you’ve organized your data and content, with everything in a single view.
- Larger cards and high-resolution workbook thumbnails make it easier to spot content while browsing.
- Workbooks, data sources, and projects within a project are now displayed in a single list.
- Content analytics help advanced users find the most used content.
Project, workbooks, and data sources: better together
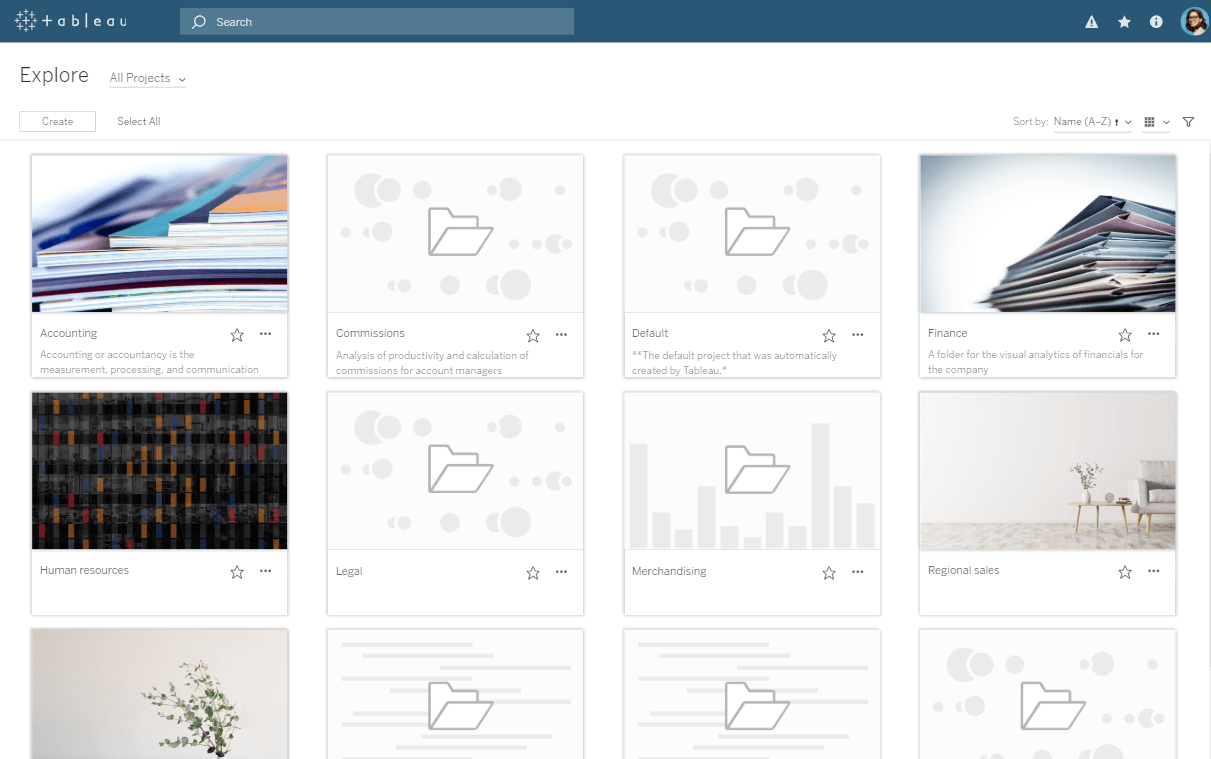
When you first log in, you’ll see all your projects at the top level. You’ll also see that this new browsing experience offers the ability to favorite projects!
As you dive into a project, you’ll find your subprojects, workbooks, and data sources here in one place, mixed together. Now you can browse the same intuitive way you do on a computer, where folders contain multiple file types.
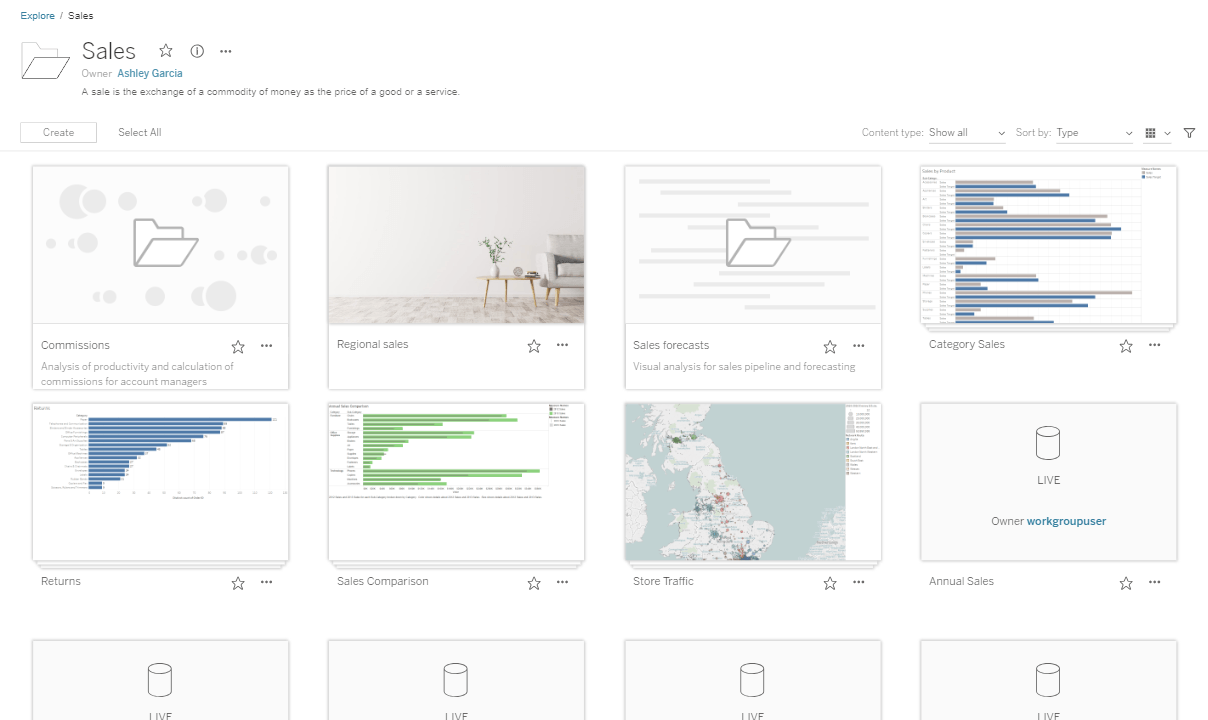
Cards in the new grid view are now larger and workbook thumbnails are high resolution, making browsing easier and more engaging.
Currently, you can access different content types across the top of the page, and filtering options on the left-hand side.

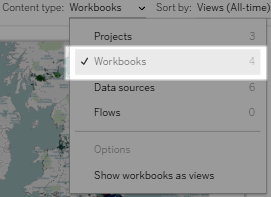
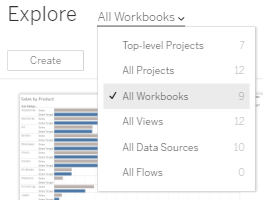
In the new browsing experience, content types can be accessed in a dropdown. For example, hide projects and data sources if you just want to see workbooks.
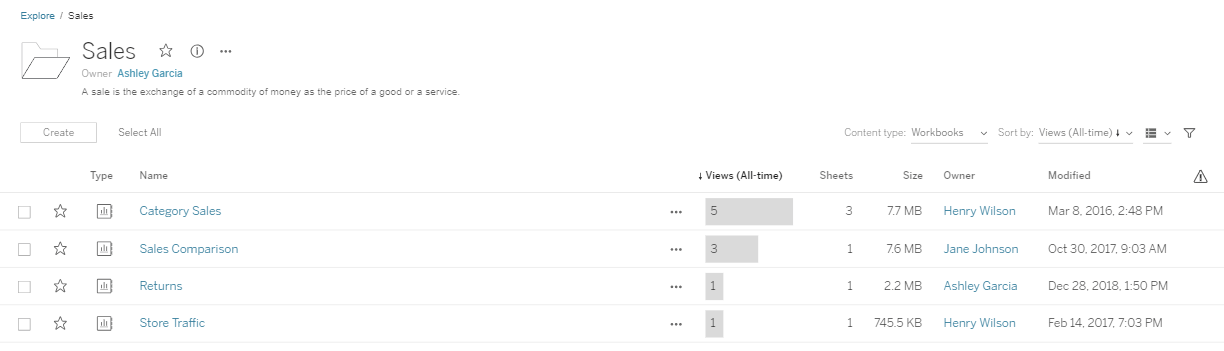
Switch to list view, and you’ll get even more information, with content analytics to help you make decisions about where to go next or which resources are most used.
For those of you who own and manage data across many projects, you may want to find all workbooks, views, or data sources—regardless of the projects they’re organized in. With the option to explore the entire site by content type, you can take stock of all the assets in the site.
This post was updated in January 2019.
相關文章

The Tableau+ Bundle with Premium AI, Enterprise Capabilities, and Premier Success
 2026/06/24

What is Tableau Prep?
 2026/04/30
Insights Wherever You Work: Meet the Tableau App for Microsoft 365
 2026/03/16