University of Akron Teaches High School Students to Analyze Social Media Data with Tableau
The majority of our Tableau for Teaching instructors work with university students. On occasion, we see innovative examples of data analysis skills being introduced early on, to high school students. This summer, Professor William McHenry led an information technology career camp using Tableau, for 26 high school students.
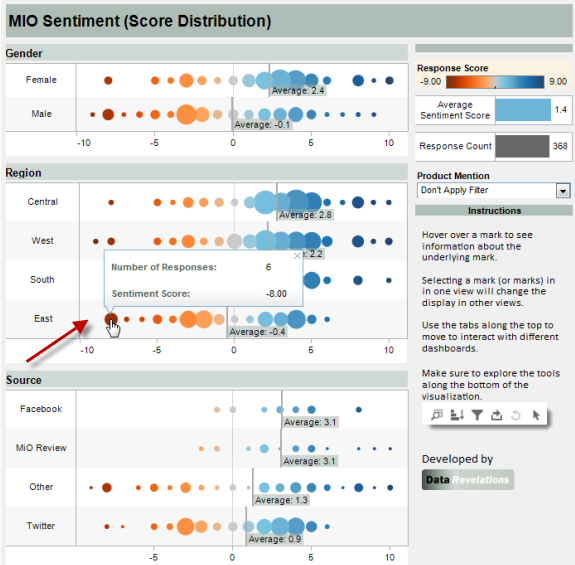
The objective of the IT camp course was to help students “understand the various ways in which businesses are analyzing (large) amounts of data”. To engage his students, McHenry created a simulation and case study on a new product from Kraft Foods called MiO, a water enhancement flavoring product. As part of the exercise, students used Tableau to analyze 368 real tweets, facebook comments, and other blog comments on MiO. They also taste-tested the product themselves, and each recorded their own sentiments on MiO (on a scale of -10 to 10).
The students were given a brief introduction to Tableau before being turned loose to explore the visuals and tools for themselves. Each team gave a report at the end of the exercise, showcasing their visualizations that provided the best insight on public sentiment towards MiO.
Prof. McHenry also partnered with Steve Wexler of Data Revelations, who helped him prepare dashboards of the analyzed results, such as the MiO Sentiment Score Distribution viz below.
Students then learned how the same data could be used to construct a predictive analytics model using a combination of both IBM SPSS Modeler and Tableau. Prof.
McHenry plans to use this lesson as a basis for a similar exercise in his upcoming
undergraduate and graduate level courses.
Q&A
What I enjoy most about teaching Tableau is the fact that you can generate so many insights from the data in such a short period of time.
What I enjoy most about teaching Tableau is the fact that you can generate so many insights from the data in such a short period of time. With Excel, for example, you have to set up each graph separately, and the available views are limited compared to Tableau. It was a great pleasure, as well, to see how the students were able to catch on to Tableau and get meaningful results in such a short period of time. I like that the students can keep track of different analyses they have tried by duplicating tabs and then altering the copy to try something else.
How did you teach Tableau to your students?
We spent time introducing the basics, and then let them go for it.
Why did you choose Tableau?
Power plus ease of use.
What would you recommend to fellow instructors?
Make sure that the problems students analyze are something the students can
relate to, and that they give the students a quick introduction to the key concepts,
such as the dimensions and measures, and how the various drag and drop options
work. Then I would turn them loose and let them experiment with all the things
they can find.