Relationships: Data modeling in Tableau
With the Tableau 2020.2 release, Tableau introduced some new data modeling capabilities, with relationships.


Combine multiple tables for analysis with relationships
With the Tableau 2020.2 release, we’ve introduced some new data modeling capabilities, with relationships. Relationships are an easy, flexible way to combine data from multiple tables for analysis. You define relationships based on matching fields, so that during analysis, Tableau brings in the right data from the right tables at the right aggregation—handling level of detail for you. A data source with relationships acts like a custom data source for every viz, but you only build it once. Relationships can help you in three key ways:
- Less upfront data preparation: With relationships, Tableau automatically combines only the relevant tables at the time of analysis, preserving the right level of detail. No more pre-aggregation in custom SQL or database views!
- More use cases per data source: Tableau’s new multi-table logical data model means you can preserve all the detail records for multiple fact tables in a single data source. Say goodbye to different data sources for different scenarios; relationships can handle more complex data models in one place.
- Greater trust in results: While joins can filter data, relationships always preserve all measures. Now important values like money can never go missing. And unlike joins, relationships won’t double your trouble by duplicating data stored at different levels of detail.
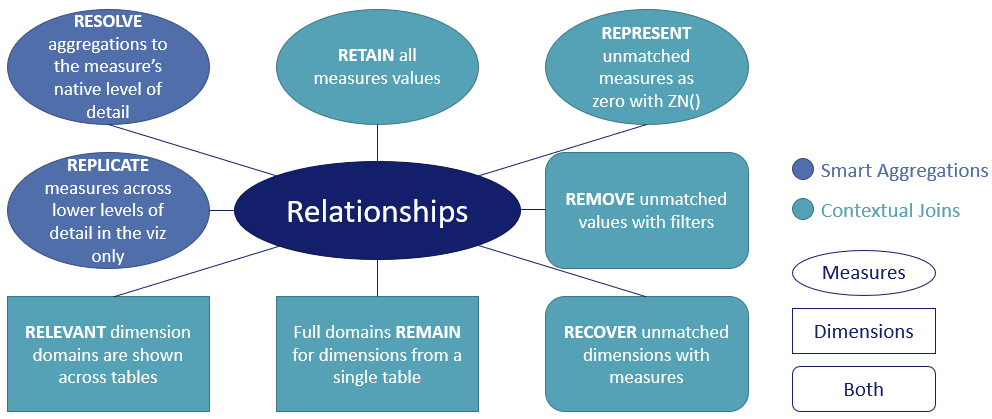
The 8 Rs of relationship semantics
Tableau needs rules to follow—semantics—to determine how to query data. Relationships have two types of semantic behavior:
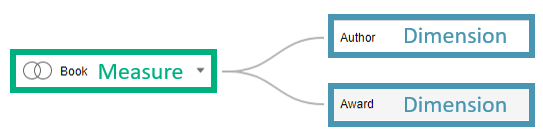
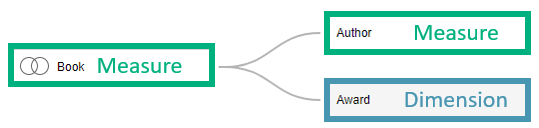
- Smart aggregations: Measures automatically aggregate to the level of detail of their pre-join source table. This differs from joins, where measures forget their source and adopt the level of detail of the post-join table.
- Contextual joins: Unmatched values are handled individually per viz, so a single relationship simultaneously supports all join types (inner, left, right, and full)
With contextual joins, the join type is determined based on the combination of measures and dimensions in the viz, and their source tables. The figure below illustrates the 8 Rs of relationship semantics, with smart aggregation behaviors in purple and contextual join behavior in teal.
A quick note before we dive deeper: The examples that follow are all built on a bookstore dataset. If you’d like to follow along in Tableau Desktop, you can download the Tableau workbook here.
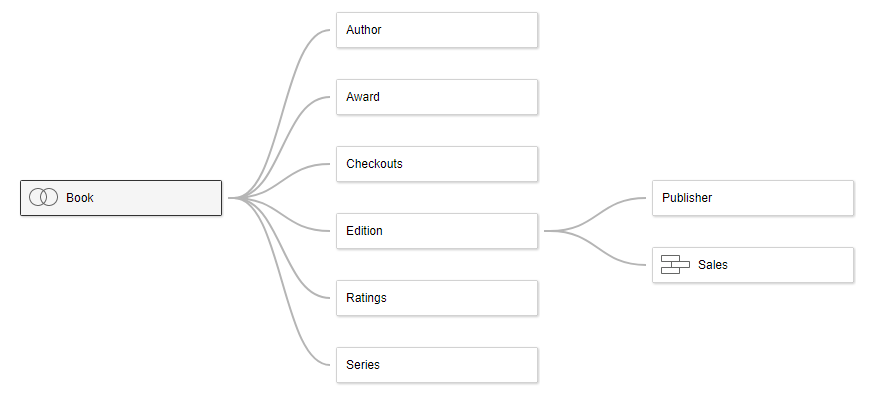
Interpreting results of analysis across multiple related tables
Tableau only pulls data from the tables that are relevant for the visualisation. Each example shows the subgraph of tables joined to generate the result.
Full domains remain for dimensions from a single table

Analyzing the number of books by author shows all authors, even those without books.
If all dimensions come from a single table, Tableau shows all values in the domain, even if no matches exist in the measure tables.
Representing unmatched measures as zeros
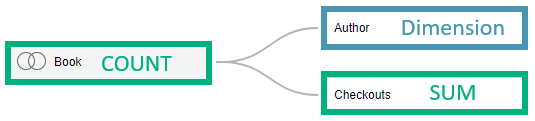
Adding Sum of Checkouts into the viz shows a null measure for authors with no books, unlike the count aggregation which automatically represents nulls as zeros.
Wrapping the SUM in the ZN function represents unmatched nulls as zeros.
Relevant domains are shown for dimensions across tables
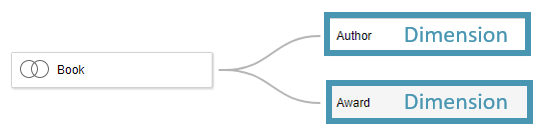
Tableau is showing authors with awards, excluding authors without awards and awards that no authors won, if any exist.
Combining dimensions across tables displays the combinations that exist in your data.
Unmatched measure values are always retained
Adding in the Count of Books measure shows all books by author and award. Since some books did not win any awards, a null appears representing books without awards.
The golden rule of relationships that will allow you to generate any join type is that all records from measure tables are always retained. Note that an emergent property of contextual joins is that the set of records in your viz can change as you add or remove fields. While this may be surprising, it ultimately serves to promote deeper understanding in your data. Nulls are often prematurely discarded, as many users perceive them as “dirty data.” While that may be true for nulls arising from missing values, unmatched nulls classify interesting subsets at the outer section of a relationship.
Recovering unmatched values with measures
The previous viz showed authors who have books. Adding the Count of Author measure into the viz shows all authors, including those with no books.
Since Tableau always retains all measure values, you can recover unmatched dimensions by adding a measure from their table into the viz.
Removing unmatched values with filters

Combining average rating by book title and genre shows all books, including those without ratings, as per the ‘remain’ property from the first example. To see just books with ratings, filter the Count of Ratings to be greater or equal to 1.
You may be wondering “why not just exclude null ratings?” Filtering the Count of Ratings, as above, removes books without ratings but preserves reviews that may lack a rating . Excluding null would remove both, because nulls do not discern between missing values and unmatched values. Relationships postpone choosing a join type until analysis; applying this filter is equivalent to setting a right join and purposefully dropping books without ratings. Not specifying a join type from the start enables more flexible analysis.
Aggregations resolve to the measure’s native level of detail, and measures are replicated across lower levels of detail in the viz only
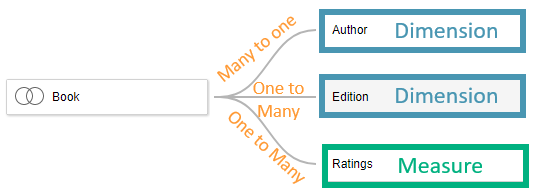
Each book has one author. One book can have many ratings and many editions. Reviews are given for the book, not the edition, so the same rating can be counted against multiple editions. This means there is effectively a many-to-many relationship between ratings and editions. Observe Bianca Thompson—since all of her books were published in hardcover, while only some were published in other formats, the number of reviews for her hardcover publications is equal to the total number of reviews for her books.
Using joins, ratings would be replicated across editions in the data source. The count of ratings per author would show the number of ratings multiplied by the number of editions for each book—a meaningless number. With relationships, the replication only occurs in the specific context of a measure that is split by dimensions with which it has a many-to-many relationship. You can see the subtotal is correctly resolving to the Authors level of detail, rather than incorrectly showing a sum of the bars.
Tip: Empty marks and unmatched nulls are different
The records included in the previous viz are all books with ratings, as per the ‘retain all measure values’ property. To see all books we must add in a measure from the Books table. Adding Count of Books to columns introduces Robert Milofsky, an author who has an unpublished book with no ratings. To represent no ratings with zeros, you might try wrapping the measure in ZN. It may be surprising that zeros do not appear—this is because the measure is not an unmatched null; the mark is missing.
Tableau generates a query per marks cards and joins the results on the dimension headers.
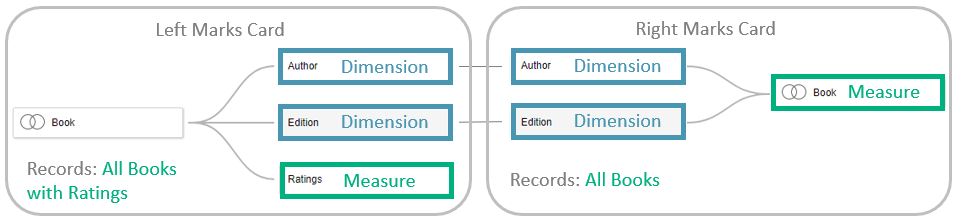
To show Robert Milofsky’s number of ratings as zero, the records represented by that marks card must be all books. That is accomplished by adding Count of Books to the Count of Ratings marks card.
Learn more about relationships
Relationships are the new default way to combine multiple tables in Tableau. Relationships open up a lot of flexibility for data sources, while alleviating a lot of the stresses of managing joins and levels of detail to ensure accurate analysis. Stay tuned for our next post about relationships, where we’ll get into detail on asking questions across multiple tables. Until then, we encourage you to read more about relationships in Online Help.
相關文章

Extend Access to Embedded Tableau Content with On-Demand Access
 2026/07/22

The Tableau+ Bundle with Premium AI, Enterprise Capabilities, and Premier Success
 2026/06/24

What is Tableau Prep?
 2026/04/30