Metrics, headlines for your data
Learn about Metrics for Tableau—Optimized for mobile, track all your KPIs from various dashboards at a glance, all in one place—anytime, anywhere.


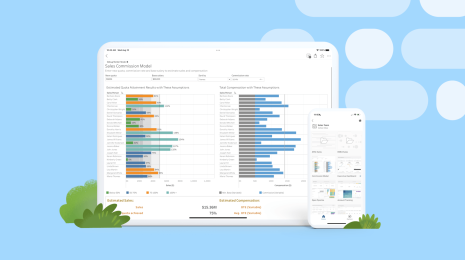
Tracking your data will never be the same. With the launch of Metrics in Tableau 2020.2, you can track data points from any number of dashboards in a single location. For years, Tableau customers have created amazing custom KPI dashboards to visualize and track data. However, building these dashboards often takes time and expertise, and viewers may need to load several dashboards to stay on top of a few key numbers. Metrics provide a consistent and quick way to track your data at a glance. And since Metrics are optimized for Tableau Mobile, you can track your metrics anytime and anywhere.
What are Metrics?
A metric is a new type of content that is fully integrated with Tableau's data and analytics platform through Tableau Server and Tableau Cloud. Metrics can be created from nearly any Tableau dashboard, enabling business users to track their business data just like stocks in an investment portfolio. Metrics is optimized for Tableau Mobile, so you can monitor your data on the go with the Tableau Mobile app for iOS and Android. Metrics update automatically and display the most recent value. If you have multiple dashboards you frequently check, you can create metrics for the key numbers from those dashboards and monitor them all at once, by adding them to your favorites or creating them to the same project.
How to create a metric
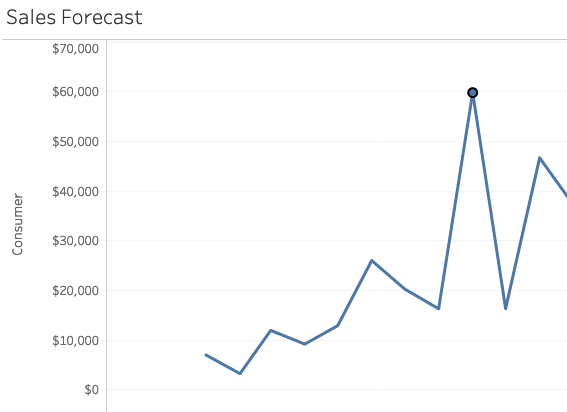
- Load a dashboard or view that shows the data you’d like to track with your metric. Time series work great, but you can also use a single point. Not all types of views support metric creation—for more info, see our Help documentation.
- Select a mark that you’d like to track as a metric. This may be a single data point that updates over time, or a mark on a time series. A metric also includes any applied filters or interactions, which is a great way to create several customized metrics from a single view.
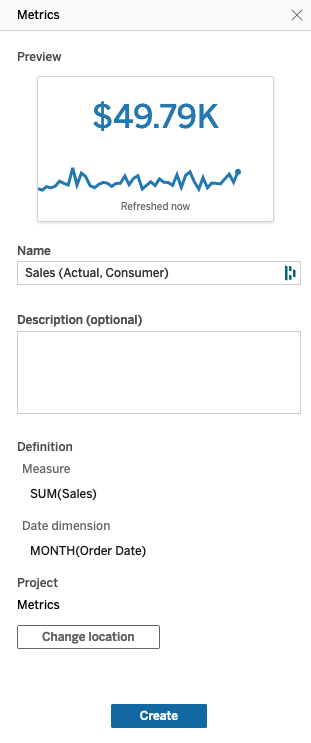
- Click the “Metrics” toolbar button to open the Metrics authoring panel
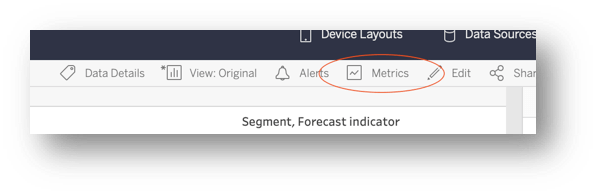
- Use the authoring panel to name your metric, add a description, and choose a destination project. Then just click “Create.”
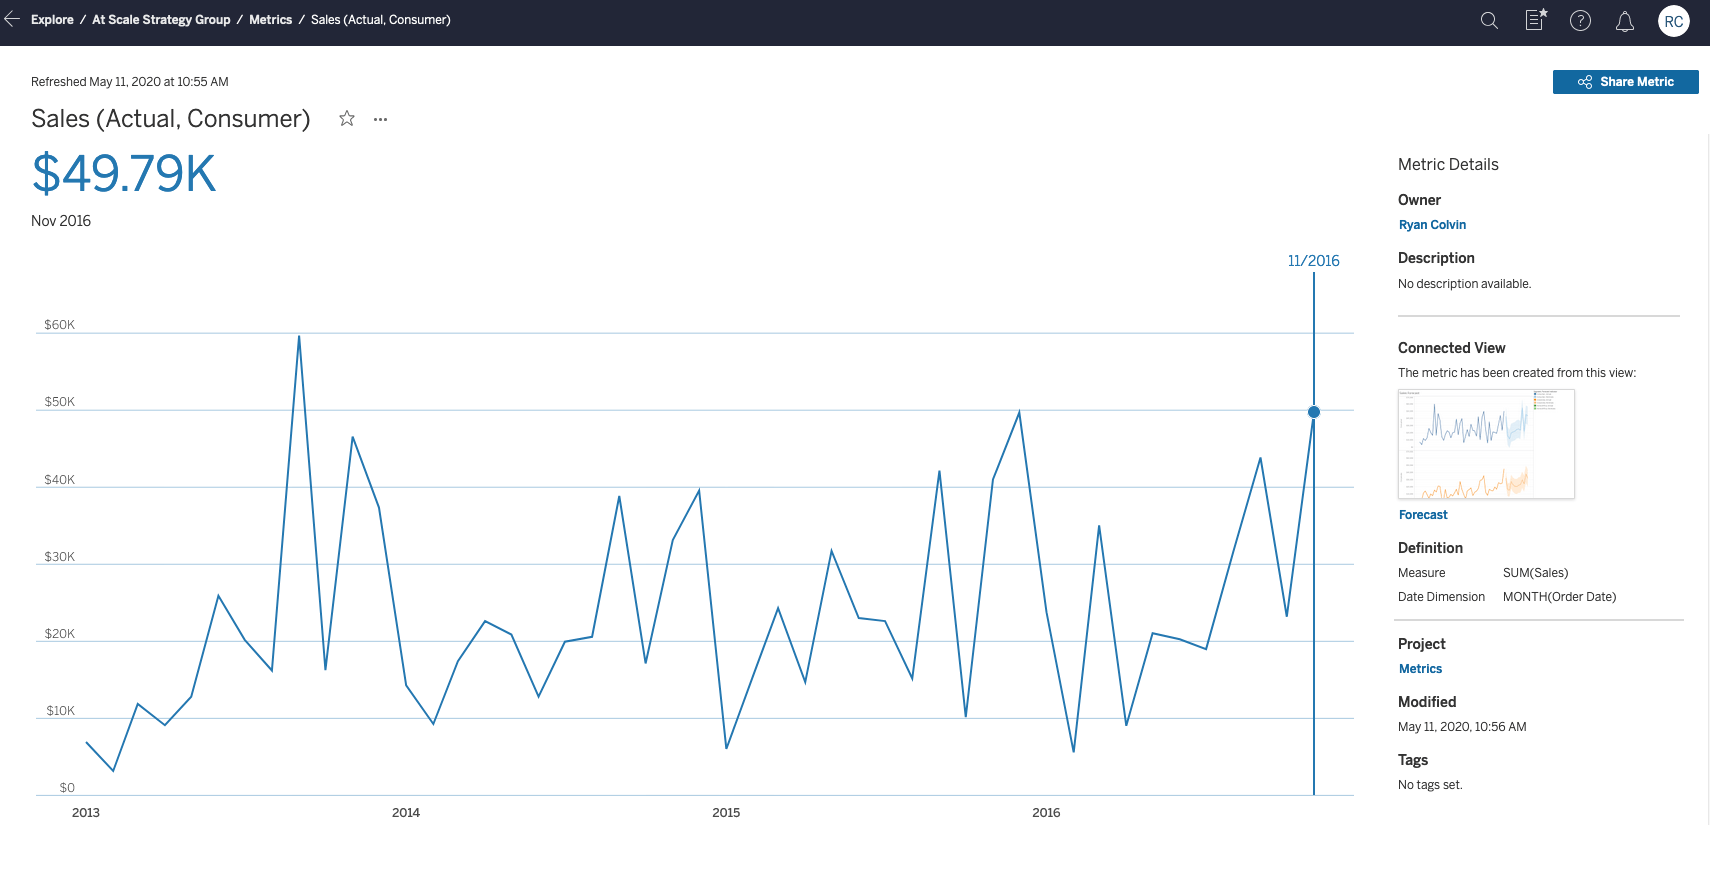
- A success message will be shown—click “Go to Metric” to view your new metric.

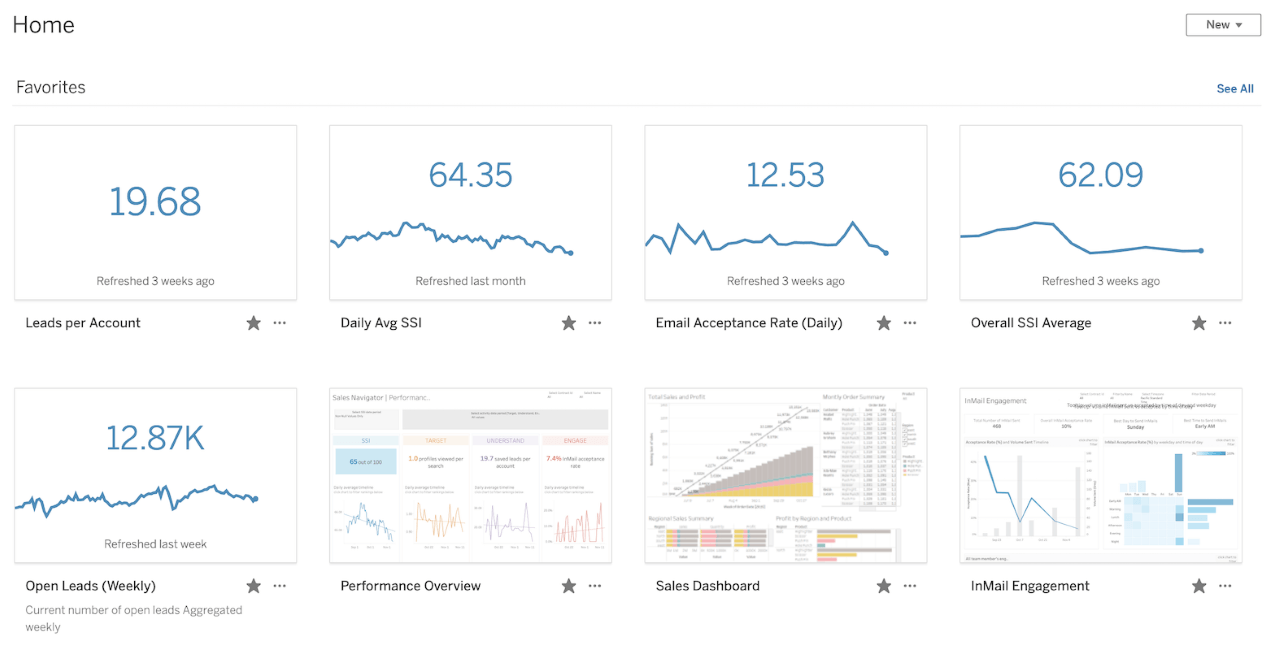
- For a fast way to monitor your metric, add it to your favorites so you can stay up to date every time you visit your Tableau site. These favorites show up front and center in the Tableau Mobile app, so be sure to download the latest version for iOS or Android.
Tracking your metrics
Once created, a metric stays up to date with the latest values from the connected view. Metrics can be managed just like workbooks—set custom permissions, search, share, sort, organize into projects, and favorite them for easy access. Your data is always available with a glance right from the metric card or grid view, plus you can open the metric to view more details, such as past values, metric owner, description, and a quick link to the dashboard view which was used to create the metric.
Tracking metrics is even easier when you add them to your favorites and take advantage of another new feature in Tableau 2020.2—reordering favorites! Drag and drop your favorited metrics, views, or workbooks to create a custom KPI dashboard.
Taking metrics on the go with Tableau Mobile
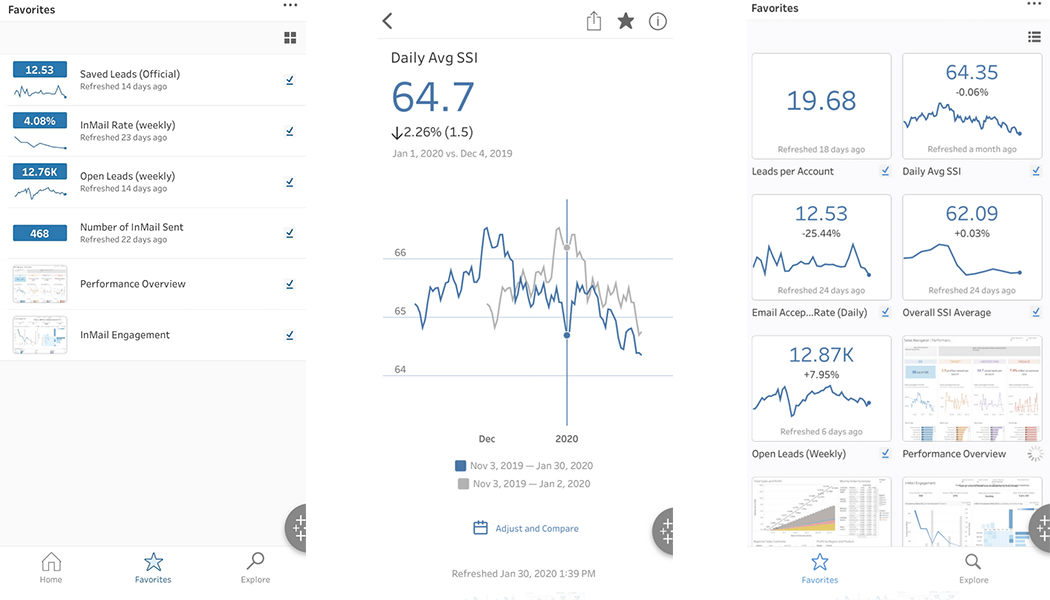
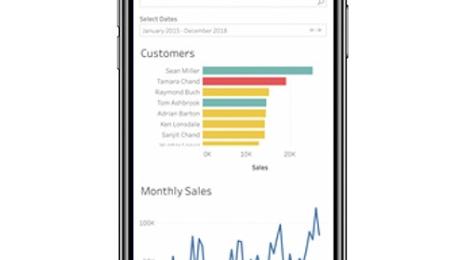
Metrics are optimized for use with the Tableau Mobile app. You can use metrics just like a stocks app on your phone, but for your data. At a glance, you’ll see the current value and a comparison in a list or grid view. You can tap on a metric to see past values or adjust the comparison settings.
Get started using Metrics today
Start tracking all of your most important KPIs in one place with Metrics. Upgrade to Tableau 2020.2 and be sure you’ve downloaded the latest version of the Tableau Mobile app for iOS or Android to make use of Metrics on the go.
Want more? Check out these tips and tricks to become a Metrics expert.
相關文章
How to Improve Business Productivity with Tableau Mobile
 2022/08/31
Introducing improved online/offline flows in Tableau Mobile
 2020/11/17
5 questions to ask when designing a mobile dashboard
 2019/08/15