Tableau 在行业中的应用
教育和非营利组织分析
充分利用数据的力量来为决策制定提供依据,发现趋势所在,管理收入并降低运营成本

通过自助式分析为每一级的决策制定提供支持
了解休斯顿凯蒂独立学区 (Katy Independent School district) 如何整合多个系统中的数据,加速制作出强大的仪表板来解答关键问题。
立即观看
圣母大学:Tableau 与 Snowflake 珠联璧合,将分析速度提高 10 倍
了解这所大学如何通过 DataND 这个基于 Tableau Server 打造的校园级门户,访问管控有序的数据和标准化的定义。
阅读此案例我发现在任何对话中,数据都是强有力的工具。当我们前往国会时,我们能够说:这就是我们需要做的事情,这就是为什么,这就是发生这种情况时可能产生的影响。

Instituto Unibanco 为 2,500 所学校的数百万学生改善了公共教育水平
了解 Instituto Unibanco 如何将标准报告用时从一个月缩短到一周,从而省出额外的时间来进行深入的分析,以及优化和加速制作报告。
了解更多信息
见证每一位学生通过机会均等学校取得成功
了解 Tableau 在软件、培训和资金方面提供的支持如何帮助机会均等学校 (Equal Opportunity Schools, EOS) 在全美找到 100,000 名高中生,为他们报名学习大学先修课程 (AP) 和国际文凭课程 (BI),并跟踪他们的表现。
阅读此案例
世界自然基金会 (WWF) 利用 Tableau 通过数据来更好地保护生命
了解 Tableau 如何帮助 WWF 将其全球 80 个办事处所产生的大量数据集中到一起,通过协调和分析这些数据帮助在组织内的每一个级别做出更好的决策。
阅读此案例
更多
资源
解决方案
特色解决方案
传达所开展计划取得的效果
通过在 Tableau 中制作报告,您可以更高效地传达信息并更有效地开展合作。只需几秒钟时间,您的数据就能够以故事的形式传达贵组织为这个世界带来了哪些改观。
了解更多信息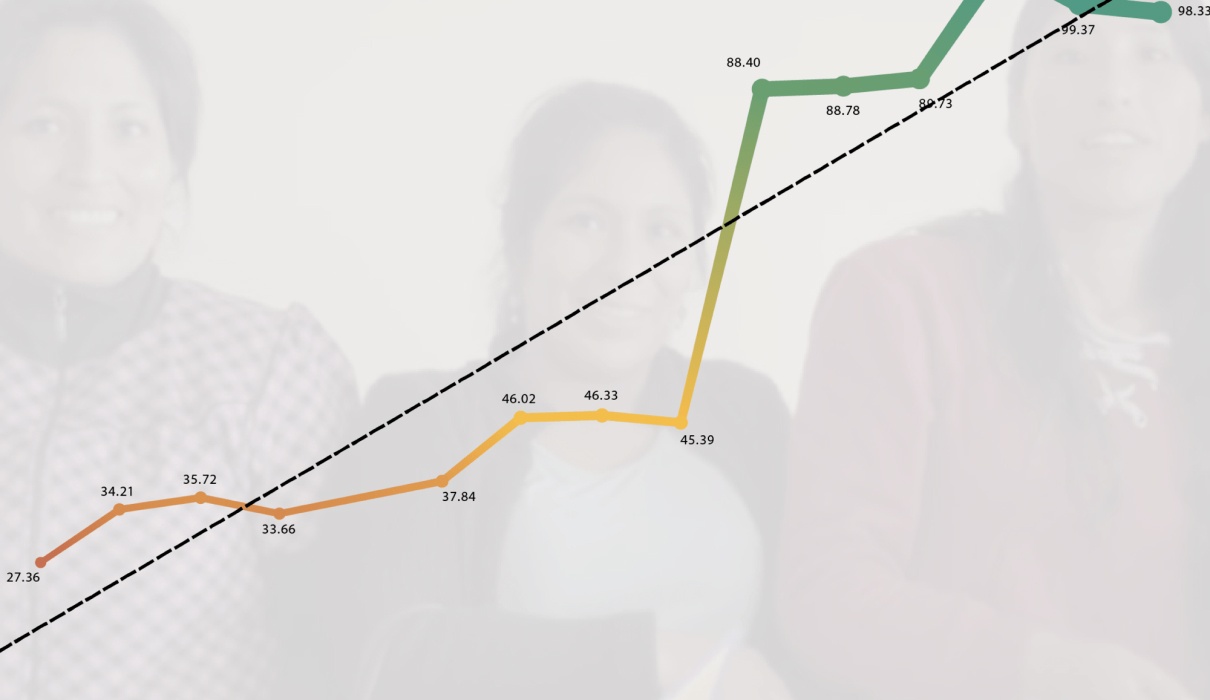
产品和
用例
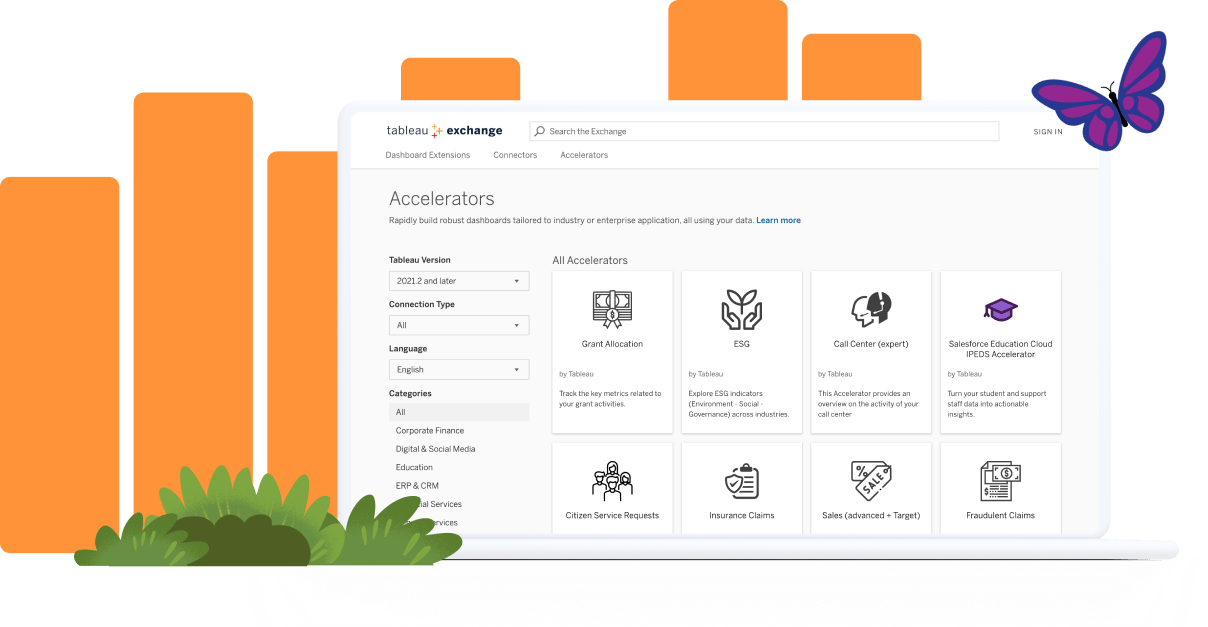
利用 Tableau Accelerators 快速上手分析
利用 Tableau Exchange 上的 Accelerators,获取由专家制作的仪表板来满足教育行业特有的业务需求。
探索 Accelerators针对教育和非营利组织举办的活动
查看活动
合作伙伴
亚特兰大公立学校 (Atlanta Public Schools) 利用 Tableau 数据可视化工具和 AWS 云端数据平台(全都符合 ISO 标准),基于数据得出清晰明确的见解,从而为教育工作者、家长和学生提供有益的参考。
了解具体方法以可视化的形式直观呈现教育和非营利组织的数据
Salesforce 与 Tableau
CRM Analytics 是一个全方位的智能平台,基于世界一流的 CRM 系统 Salesforce 构建而成,可为教育机构和非营利组织提供原生分析体验。Salesforce 用户直接在其工作流程中就能呈现可指导行动的智能见解,从而提升工作效率。欢迎探索 Salesforce 针对教育和非营利组织提供的解决方案。