
Data Viz Debate: Andy Cotgreave v Andy Kirk
The Data Viz Debate brings together two of the sharpest minds in data to share their opposing views on the most divisive issues in data visualisation design. Discover how you can overcome your own data visualisation challenges using more than one method.
Vote for your favourite after each round and join the conversation using #DataVizDebate.
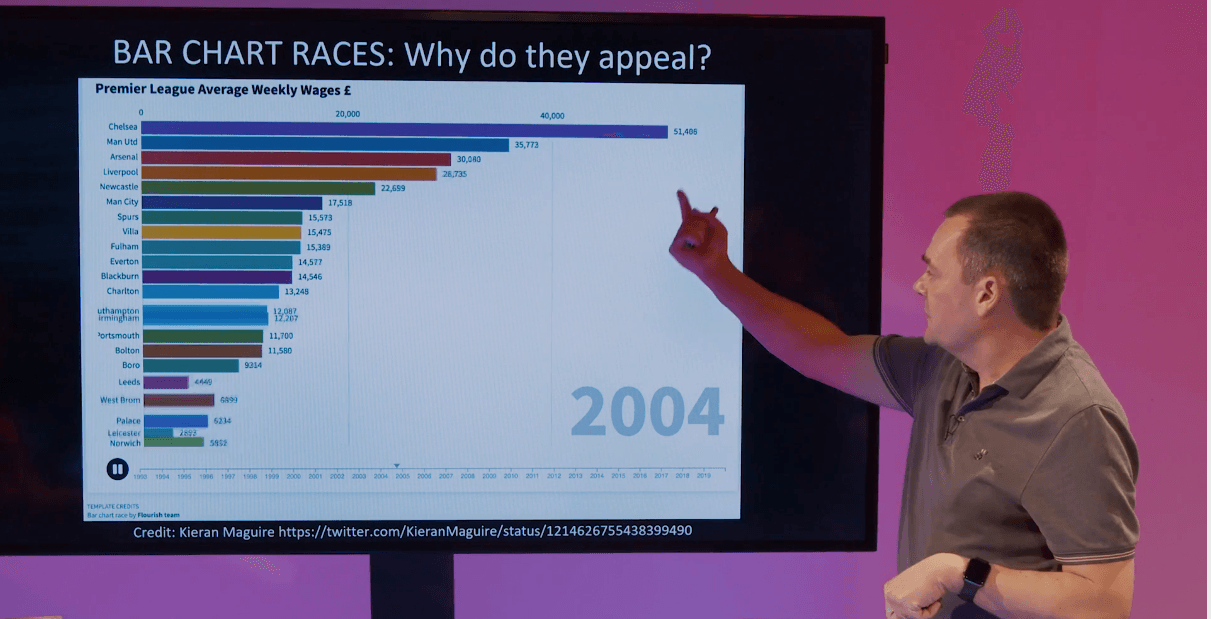
Bar Chart Race
Is the Bar Chart Race more than just a gimmick?
Watch Round 1 of the Data Viz Debate as Andy Cotgreave and Andy Kirk share opposing views on the role of the bar chart race in visualising time.
watch now
Best Decade for Data Viz
Which is the best decade for data viz - the 1910s or 2010s?
Watch Round 2 of the Data Viz Debate as Andy Cotgreave and Andy Kirk discuss what they believe to be the golden age of data viz development.
watch now
Business Executives
Do business executives need, or want, interactive charts?
Watch Round 3 of the Data Viz Debate as Andy Cotgreave and Andy Kirk share their thoughts on the level of interactivity that business executives need and want when consuming data visualisations.
Watch Now
Colour or Title?
Which can most transform the effectiveness of a viz - colour or title?
Watch Round 4 of the Data Viz Debate as Andy Cotgreave and Andy Kirk share their thoughts on whether or not a visualisation's title can supersede colour in understanding the data.
Watch Now
Long Form or Single Screen?
Long form or single screen visualisations?
Watch Round 5 of the Data Viz Debate as Andy Cotgreave and Andy Kirk discuss whether mobile phone scrolling has made long form visualisations a necessity or is single screen still relevant.
Watch now
Blue and Orange
Blue Orange colour palette - love or hate?
Watch Round 6 of the Data Viz Debate as Andy Cotgreave and Andy Kirk discuss whether Blue and Orange is the best colour scheme to visualise data, or is there a better colour pair.
Watch now